

Abstract
Temporal cortical neurons are known to respond to visual dynamic-action displays. Many human psychophysical and functional imaging studies examining biological motion perception have used treadmill walking, in contrast to previous macaque single-cell studies. We assessed the coding of locomotion in rhesus monkey (Macaca mulatta) temporal cortex using movies of stationary walkers, varying both form and motion (i.e., different facing directions) or varying only the frame sequence (i.e., forward vs backward walking). The majority of superior temporal sulcus and inferior temporal neurons were selective for facing direction, whereas a minority distinguished forward from backward walking. Support vector machines using the temporal cortical population responses as input classified facing direction well, but forward and backward walking less so. Classification performance for the latter improved markedly when the within-action response modulation was considered, reflecting differences in momentary body poses within the locomotion sequences. Responses to static pose presentations predicted the responses during the course of the action. Analyses of the responses to walking sequences wherein the start frame was varied across trials showed that some neurons also carried a snapshot sequence signal. Such sequence information was present in neurons that responded to static snapshot presentations and in neurons that required motion. Our data suggest that actions are analyzed by temporal cortical neurons using distinct mechanisms. Most neurons predominantly signal momentary pose. In addition, temporal cortical neurons, including those responding to static pose, are sensitive to pose sequence, which can contribute to the signaling of learned action sequences.
Introduction
Primates recognize actions of their own and different species, which is essential for survival and social behavior. Visual temporal cortex has been implicated in the coding of actions by macaque single-cell (Oram and Perrett, 1994, 1996; Vangeneugden et al., 2009; Singer and Sheinberg, 2010), macaque (Nelissen et al., 2006) and human functional imaging (Grossman et al., 2000; Vaina et al., 2001; Beauchamp et al., 2003; Puce and Perrett, 2003; Jastorff and Orban, 2009), and lesion studies (Saygin, 2007). Indeed, the superior temporal sulcus (STS) and inferior temporal cortex (IT) can provide a visual description of actions to be used by other regions to infer intention, action goals, etc. (Rizzolatti and Sinigaglia, 2010).
Models of action recognition (Giese and Poggio, 2003; Schindler and Van Gool, 2008) suggest that actions can be described using either kinematic or form cues. Previously, we demonstrated that motion- and form-sensitive STS/IT neurons can represent similarities among actions, suggesting contributions from both cues to action coding (Vangeneugden et al., 2009). In that study, action patterns were simple and restricted to one limb, limiting the scope of its conclusions. Furthermore, it was unclear whether form-sensitive neurons additionally carried an action sequence signal, as postulated by computational work (Giese and Poggio, 2003; Lange and Lappe, 2006).
Locomotion consists of rather complex motion patterns involving simultaneous movements of all limbs and is widely used to study mechanisms of biological motion at the computational and psychophysical level. Although discrimination between rightward and leftward walkers (i.e., facing direction) can be achieved using different body poses, differentiating between forward and backward walking requires an integration of successive body poses (Beintema and Lappe, 2002; Lange and Lappe, 2006) or motion information, since the body poses are identical. Here, we examine how well macaque STS/IT neurons can discriminate between forward and backward walking, and thus signal pose sequence instead of mere momentary pose. For comparison, we parametrically manipulated facing direction, using controlled displays based on motion-captured human walkers. The complexity of the displays was a compromise between that of difficult-to-control, fully textured body images and easily controllable, but abstract, point light displays used in human biological motion studies (Blake and Shiffrar, 2007) but that might not be easily perceived as biological by macaques (Vangeneugden et al., 2010).
As in human psychophysical studies, we used stationary walkers (i.e., walking as if on a treadmill). This contrasts with previous macaque studies in which walkers moved across the display (Oram and Perrett, 1994, 1996; Jellema et al., 2004; Barraclough et al., 2006; Jellema and Perrett, 2006), adding a strong translatory motion and spatial component that might engage different mechanisms. In a previous psychophysical study using the same stimuli, monkeys required a lengthy training to discriminate forward from backward locomotion (Vangeneugden et al., 2010). Here, we examine the single-cell STS/IT responses in these trained animals to the locomotion stimuli. Furthermore, we used machine-learning classification tools to analyze the signal that neuronal populations carry concerning locomotion direction, thus providing insight into what it is that IT/STS neurons tell other regions about visual actions.
Materials and Methods
Subjects and surgery
Two female rhesus monkeys (Macaca mulatta; monkey M1, 6 kg; M2, 7 kg) participated in the single-cell recording experiments. These are two of the three subjects trained extensively in the discrimination of some of the stimuli used in this study (see below) (Vangeneugden et al., 2010). Each monkey had a custom-made plastic head post attached to the skull. Guided by preoperative structural magnetic resonance imaging of each monkey's head [3T Siemens Trio; magnetization-prepared rapid-acquisition gradient echo (MPRAGE) sequence; 0.6 mm resolution], we implanted a plastic recording chamber over the left hemisphere, dorsal to the rostral temporal cortex, allowing a vertical approach to the rostral STS and lateral convexity of IT. The recording chambers (Crist Instrument) were positioned 10 mm anterior to the auditory meatus and 24 mm lateral to the midline for M1 and 13 mm anterior and 21 mm lateral for M2. Between recording sessions, we repeatedly verified recording locations by scanning the brain (MPRAGE sequence; 0.6 mm resolution) while copper sulfate-filled glass tubes were inserted into the Crist grid at locations of interest. These magnetic resonance imaging (MRI) images were then compared with depth readings of the white and gray matter transitions and of the base of the skull obtained during the single-cell recording sessions. This procedure allowed us to assign neurons to the appropriate bank of the STS or to the lateral convexity of IT.
During the course of the experiments, the animals were kept on a controlled fluid intake schedule while dry food was available ad libitum in the home cage. The surgeries were performed under aseptic conditions and isoflurane gas anesthesia. All animal care and experimental and surgical procedures followed national and European guidelines and were approved by the Katholieke Universiteit Leuven Ethical Committee for animal experiments.
Stimulus apparatus and recordings
During the single-cell recordings sessions, the monkeys were seated in custom-made primate chairs with their heads fixed. Standard extracellular single-unit recordings were performed with epoxylite-insulated tungsten microelectrodes (FHC; in situ measured impedance, ∼1 MΩ) using techniques as described previously (Vangeneugden et al., 2009). Briefly, the electrode was lowered with a Narishige microdrive into the brain using a guide tube that was fixed in a standard Crist grid positioned within the recording chamber. After amplification and filtering, spikes of a single unit were isolated on-line using a custom amplitude- and time-based discriminator.
The position of one eye was continuously tracked by means of an infrared video-based tracking system (SR Research EyeLink; sampling rate, 1 kHz). Stimuli were displayed on a cathode ray tube display (Philips Brilliance 202 P4; 1024 × 768 screen resolution; 60 Hz vertical refresh rate) at a distance of 57 cm from the monkey's eyes. As in all our previous studies, the onset and offset of the stimulus was signaled by means of a photodiode detecting luminance changes in a small square in the corner of the display (but invisible to the animal), placed in the same frame as the stimulus events. All stimuli were dark gray and were presented on a light gray background. A digital signal processor-based computer system developed in-house controlled stimulus presentation, event timing, and juice delivery while sampling the photodiode signal, vertical and horizontal eye positions, spikes, and behavioral events. Time stamps of the recorded spikes, eye positions, stimulus, and behavioral events were stored for off-line analyses.
Stimuli and tests
Main stimuli.
A motion capture system (MoCap; Vicon) at the Motion Capture Laboratory of the Eidgenössische Technische Hochschule Zürich (Zürich, Switzerland) was used to generate the stimuli (Vangeneugden et al., 2010). Six cameras were positioned around an actor of average physical constitution walking on a treadmill at 4.2 km/h. The actor wore a skintight suit with 41 markers located on major anatomical landmarks. The three-dimensional spatial positions of each marker (spatial resolution, 1 cm; sampling rate, 120 Hz; total duration, 10 s) were stored and integrated into a 16-point three-dimensional body representation. Commercially available animation software (Maya; Autodesk) was used to render “humanoid-like” displays consisting of cylindrical geometrical primitives, the position and motion of which were based on the motion-captured three-dimensional coordinates. The motion-captured locomotions were rendered at eight different facing directions: 0, 45, 90, 135, 180, 225, 270, and 315° (Fig. 1a). The 0, 45, 90, 270, and 315° displays were generated based on the motion-captured three-dimensional coordinates, whereas the other three remaining facing directions (135, 180, and 225°) were obtained by mirroring the frames of the 45, 0, and 315° displays, respectively. For each facing direction, the agent could move either forward or backward. Backward locomotion displays were created by reversing the temporal order of the frames of the forward locomotions. Thus, the snapshots of forward and backward locomotion displays were identical and differed only in their sequences.

Schematic representation of the locomotions from the main test. a, An agent walked as if on a treadmill along one of four axes (dotted lines: 0–180°, 45–225°, 90–270°, and 315–135°), in either facing direction, either forward or backward (full arrows). The start frame for each locomotion is depicted. Locomotion in the forward direction is toward the center. b, Sequences of six snapshots sampling the locomotion movies every 216 ms (except for 200 ms between snapshots 5 and 6). Facing directions are indicated. Left to right corresponds to forward walking, and right to left to backward walking. Note that in the forward condition the legs close and then open, whereas the opposite is the case in the backward condition. Movies were presented without translatory component at the center of the screen.
The stimuli consisted of approximately a full walking cycle and lasted 65 frames, equivalent to a stimulus duration of 1086 ms. The differences between the stimuli can be appreciated from Figure 1b, which shows condensed sequences of snapshots, taken every 13 frames (but with only 12 frames between snapshots 5 and 6; sampling frames: 1, 14, 27, 40, 53, 65). Note the differences in poses (i.e., legs closing vs opening) when advancing through the forward and backward sequences, respectively. The height of the agent and the maximum lateral extension of the ankles measured ∼6 × 2.8°, respectively. All stimuli were presented at the center of the monitor (i.e., nontranslatory motion as on a treadmill) with a red fixation square located just below the hip of the agent. Unless stated otherwise, the start frame for each movie was kept constant across presentations.
Throughout the remainder of this paper, stimuli will be annotated according to the facing direction followed by F or B to indicate forward or backward walking, respectively. Thus, “0F” indicates 0° facing direction, walking forward, and “225B” indicates 225° facing direction, walking backward, etc.
Main test.
The main test consisted of the eight different facing directions with the agent walking either forward or backward (8 × 2 = 16 conditions). The 16 movies were presented in an interleaved pseudorandom fashion. This test was used to search for responsive neurons that we tested with at least 4 unaborted trials (median, 7) per stimulus condition. Cells still adequately isolated at the end of this test were further subjected to at least one of the following tests.
Random-start frame test.
In this test, the starting frame of the movie for any given stimulus condition was randomized across trials. Three stimulus conditions were included in this test: 0F, 0B, and 180F. The randomization of the start frame covered the full 65 frame walking cycle. This was accomplished by generating 22 different movies beginning at 3 frame intervals. Temporally reversing the sequence and mirroring the 22 different movies of the 0F condition resulted in the 0B and 180F movies, respectively. The various movies of the three conditions were pseudorandomly interleaved with a minimum of 6 unaborted (median, 16) trials per condition.
Snapshot test.
We extracted seven different body poses, representative of the full walking cycle and spaced by at least 10 frames, for each forward movie of the eight facing directions. The snapshot test consisted of eight pseudorandomly interleaved conditions: the most effective locomotion display as determined in the main test, together with the seven snapshots from that movie. Each snapshot was displayed for 303 ms while the locomotion was displayed exactly as in the main test. A minimum of 5 unaborted (median, 10) trials per stimulus condition were presented.
Half-body test.
For each of the 16 movies of the main test, we generated two half-body configurations: displays showing only the upper (torso, arms, and head) or lower body parts (legs). The locations of the half-body stimuli on the screen corresponded to their locations in the original full body display. The test consisted of six conditions, which included the full-body and two half-body displays of the most and least effective stimuli. At least 6 unaborted trials (median, 10) were presented per movie, in pseudorandomly interleaved fashion.
Tasks
Passive fixation.
The animals performed a passive fixation task in all tests, except the random-start frame test. The advantage of the fixation task is that a large number of stimuli can be presented to the animal with no previous training. The sequence of the fixation task was as follows. The trial started with the onset of a red, square fixation target (size, 0.12 × 0.12°), which the animal had to fixate within a time period of 2 s. After fixating the target for 500 ms, the locomotion was shown with the fixation target superimposed. To obtain a juice reward, the animal was required to continue fixating throughout the entire stimulus duration plus 200 ms after stimulus offset. Failure to do so resulted in an aborted trial. The size of the fixation window varied between 1.3 and 1.7° across monkeys. Only responses obtained in trials with successful fixations were analyzed.
Locomotion categorization.
During the random-start frame test (and only in that test), the animals performed a three-alternative categorization task, categorizing three locomotion conditions: 0F, 0B, and 180F. The trial sequence in the locomotion categorization task was similar to that of the passive fixation task, except that 100 ms after stimulus offset, the fixation target was replaced by three red target squares (size, 0.4 × 0.4°), located 8.4° to the right, left, and above the fixation target. The animals had been trained to saccade to one of these eccentric targets to indicate the perceived locomotion condition. The conditions 0F, 0B, and 180F were associated with a rightward, leftward, and upward saccade, respectively. An immediate saccade to the correct target, followed by holding fixation on this target for 100 ms, was rewarded with juice. Incorrect trials or aborted trials resulted in no reward. Before the recording sessions, the animals had been extensively trained in this locomotion categorization task. Additional details concerning the training and behavioral results in this and a related task can be found in the study by Vangeneugden et al. (2010). Note that the animals had been trained only to discriminate the 0F, 0B, and 180F conditions and not the other facing directions, nor forward versus backward walking for the other facing directions. This explains why only the 0F, 0B, and 180F conditions were used in the random-start frame test.
The passive fixation and categorization tasks were run in separate blocks of trials.
Data analysis
Main test.
The responsiveness of each cell was assessed by a split-plot ANOVA (Kirk, 1968) comparing baseline with stimulus-driven activity. For each trial, the baseline activity was computed in a time window from −400 to 0 ms, whereas activity elicited by the stimulus was computed in a window from 50 to 1100 ms, 0 representing stimulus onset. Baseline versus stimulus activity served as a repeated-measure within-trial factor, and the 16 stimulus conditions as a between-trial factor. Cells with either a significant main effect for the baseline-stimulus activity factor (p < 0.05) or a significant interaction between the two factors (p < 0.05) were considered for additional analysis. All neurons in the reported sample (N = 171) had significant responses based on this ANOVA analysis.
We used a two-way ANOVA of the net responses to examine the main effects and interaction between the following factors: forward versus backward locomotion (two levels) and facing direction (eight levels). Net responses were calculated by subtracting the firing rate in the baseline window from the firing rate in the stimulus window for each individual trial. The time windows (baseline and stimulus) were identical to the ones used in the split-plot ANOVA. A factor (e.g., facing direction) was deemed to have a significant effect on the response of the neuron if either the main effect of that factor or the interaction effect was significant (p < 0.025, Bonferroni's correction for multiple comparisons).
The degree of selectivity for the different locomotion conditions was quantified using the d′ index: d′ = (mean (resp(c1)) − mean (resp(c2)))/sqrt((var(resp(c1)) + var(resp(c2)))/2), where mean and var correspond to the mean and between-trial variance of the gross response (time window, 50–1100 ms) to c1 and c2, respectively. c1 refers to the action, selected from the 12 conditions, that produced the largest mean response. These 12 conditions were: 0F, 0B, 45F, 45B, 135F, 135B, 180F, 180B, 225F, 225B, 315F, and 315B. Given that the perceived difference between the forward and backward walking is poor for the 90 and 270° stimuli, we excluded those conditions from the d′ computation. We computed three sorts of d′, differing in the identity of c2: (1) d′ fwd-bwd: c2 being the forward or backward condition of the same facing direction as c1 (e.g., 0F and 0B), (2) d′ facing: c2 being the least effective facing direction (of five) with forward/backward locomotion being the same as c1 (i.e., if c1 is a forward condition then c2 will also be a forward condition), and (3) d′ axis, c2 being the facing direction of the same axis as c1 with forward/backward locomotion of c1 and c2 being the same (e.g., 0F and 180F). We use d′ as an index of selectivity since it takes into account the mean trial-to-trial variability of the responses in addition to differences in the strengths of responses to c1 and c2.
To visualize mean tuning for facing direction in neurons that demonstrated selectivity for that parameter, we performed the following analysis. First, for each neuron we performed two one-way ANOVAs on the net responses to the eight facing directions, one for the backward and one for the forward conditions. Next, we selected those cases in which the ANOVA showed a significant effect (p < 0.05) for facing direction. For each selected case, the preferred direction was determined based on the odd trials, whereas the mean responses of the even trials for each of the eight facing directions were plotted in polar coordinates. The tuning curves of the even trials were then rotated so that the preferred direction of each neuron, as determined by the odd trials, equaled the 0° coordinate. The rotated tuning curves were then averaged across all cases and across cases for which the preferred directions lie along the same axis. The odd-even averaging procedure makes certain that the preferred stimulus is defined on a set of trials that are independent of the trials used to plot the tuning curve. This prevents favoring the response to the best direction compared with the other directions, and thus guards against overestimating the actual tuning. This odd-even procedure has also been used in other analyses in this paper in which we compare population responses between conditions.
We used support vector machines (SVMs) (Cortes and Vapnik, 1995; Hung et al., 2005) to classify the facing directions, using temporal cortical responses as input. A support vector machine performs classifications by constructing hyperplanes in a multidimensional space that separates items (responses on individual trials) of different class labels (locomotion stimuli). Basically, we used the same procedure as that of Köteles et al. (2008) except that, in the present paper, we used a linear rather than a radial-basis-function kernel. Classification using a linear SVM should be more biologically plausible since it is formally identical with classification based on a linear combination of the weighted responses of each of the neurons. We used the machine learning package “Spider” (http://www.kyb.tuebingen.mpg.de/bs/people/spider/main.html) to implement a multiclass SVM using a one-versus-one approach (Weston and Watkins, 1998). Training was performed using a grid search algorithm to find the optimal regularization parameter C of this linear SVM algorithm. In addition, we applied during training a threefold cross-validation to optimize the C-parameter of the SVM classifier during the grid search. Importantly, the classification performances that we report are obtained using tests with responses from trials that are different and independent of the trials used to train the SVM. This in fact assesses the generalization capabilities of the classifier: when overfitting occurs during training, the trained classifier will yield an inferior generalization performance during testing. Also, note that overfitting results in classification performances during testing that is higher than or equal to chance level, but not substantially below chance level, at least when a considerable number of resamplings of training and test trials are used, as is done here (see below). Performance below chance level corresponds to a reversal of the label–condition assignment during testing (label A is assigned to condition B, whereas label B is assigned to condition A).
The input to the SVMs consisted of population response vectors that were constructed by concatenating the responses of a set of N neurons on a single trial for a given stimulus. For the SVM analyses, we pooled the responses of the two animals into single population vectors. Note that the neurons were recorded in separate sessions, and thus we ignore any correlated activity between neurons. However, having simultaneous recordings would most likely not have changed our conclusions since we are mainly interested in comparisons of relative classification ability across stimulus conditions and over time. Furthermore, a recent study (Anderson et al., 2007) has suggested that the responses of simultaneously recorded IT neurons, taking response correlations into account, do not produce more information about the stimulus presented than taking the responses without considering response correlations (as with sequential recordings). We used three sorts of response vectors. In one such analysis, the firing rates, averaged within a 50–1100 ms window, were computed for each trial and for each neuron, and the population response vector was defined as the concatenation of the average firing rates of the individual neurons for a single trial (vector length: N neurons). In a second set of analyses, average firing rates were computed for each 50 ms bin between 50 and 1100 ms after stimulus onset. Population response vectors in this case were a concatenation of the responses in the individual bins of a single trial for the different neurons (vector length: N neurons × 21 bins). In a third set of analyses, the response vector consisted of the concatenation of the responses of the individual neurons obtained in a single, 50 ms bin of a single trial (e.g., the 100–150 ms bin; vector length = N neurons).
For all SVMs, training and testing followed the same scheme. For each neuron, four trials of each condition were randomly drawn, without replacement, from all the recorded trials of that condition and used to create four population response vectors. These vectors were then used to train the SVM. Testing was performed using two different trials randomly drawn from all the recorded trials (except the four used for training). Consequently, only neurons for which at least six trials per condition had been recorded were incorporated in the SVM. Each SVM was run 1000 times using a different sampling of four training and two test trials per neuron each time. Based on the classifications, confusion matrices were created which indicated the proportion of classifications in which a response vector belonging to condition X was classified as condition Y. These proportions are computed from the classifications of the test trials across the 1000 resamplings.
One set of SVM analyses classified the 16 locomotion conditions of the main test based on the responses of a population of neurons. Chance level for this 16 condition classification is theoretically 1/16 = 0.0625. We ran a control SVM analysis in which we randomly shuffled the labels of the trials and then performed exactly the same SVM classification as for the real, correctly labeled data, except that here 100 rather than 1000 resamplings were performed. These control SVMs were done for each of the SVMs (response averaged across full duration SVMs and 50 ms binned responses SVMs) performed on the correctly labeled data shown in Results. For each of the control analyses, the mean proportion of correct classifications was 0.0625, as expected, and all gave SEs (computed on the 100 resamplings) <0.02. In a second set of SVM analyses, we classified the 0F, 0B, and 180F conditions. Control SVMs using randomly reshuffled trial labels all produced the expected proportion of correct responses [i.e., 0.33 (SE on 100 resamplings was <0.04)]. Although performance levels during training were above chance level in some of these control SVMs, the performance levels obtained during testing were all at chance level, hereby indicating overfitting. The chance performance during these control tests using shuffled data demonstrates that the generalization tests using independent trials effectively protect against erroneously high performance levels that result from overfitting.
To assess the reliability of the classification scores in the confusion matrices, we computed SEMs for the 1000 resamplings. For all analyses, the maximum SE across all cells of the confusion matrix was ≤0.01.
When comparing the SVM-based classification performances of two classes of neurons, we equated the numbers of neurons in these two classes. The number of neurons randomly selected (in each of the 1000 resamplings) to provide input to the SVMs was set equal to the sample size of the smallest class. We also ensured that the number of neurons contributed by each animal was equal for the two classes. Thus, differences in classification scores between the two groups of neurons cannot be attributable to difference in the number of neurons or differences between animals.
For the third set of SVM analyses, we trained and tested using the responses in single 50 ms bins. In these analyses, training was performed for a particular bin (e.g., 100–150 ms) while testing was performed for the same and all other bins separately. Responses from the same trial were used to classify all bins during testing. In one analysis, the responses in the different bins were taken as the raw spike counts (as in all other SVM analyses), whereas another analysis used responses standardized across bins. The standardization was performed for each bin by computing the difference between the spike count and the mean spike count for that particular bin, averaged across trials and neurons. This difference was then divided by the SD of all spike counts within that particular bin across all trials and neurons. This z-standardization ensured that the mean response was the same across all bins. The SVM classification scores with and without standardization were virtually identical (data not shown). The data shown in Results are the classification scores obtained without the standardization.
Random-start frame test.
Neuronal responsiveness to the three locomotion conditions was assessed by means of a split-plot ANOVA (see Main test). The same time windows were used as in the analyses of the main test. All neurons reported in Results showed significant responses as judged from the split-plot ANOVA.
Snapshot test.
We considered only neurons that showed a significant response to the dynamic locomotion condition. This was tested by means of the Wilcoxon matched-pairs test (p < 0.05), comparing baseline (i.e., −400 to 0 ms) versus stimulus-driven activity at 50–350 ms. To determine whether the static snapshot displays elicited significant activity, a split-plot ANOVA was performed on the responses of the seven snapshots (between-trial factor) comparing baseline (time window, −400 to 0 ms) with stimulus-driven activity (time window, 50–350 ms; within-trial factor). When the main effect of the baseline-stimulus factor, or the interaction between these two factors (both effects; p < 0.05), proved to be significant, we determined whether the neuron showed a significant effect of pose using a one-way ANOVA of the net responses to the seven static conditions.
Using the Pearson product-moment correlation coefficient, we correlated the neuronal responses to the static snapshots with the neuronal responses to the same snapshots embedded in the locomotion sequence. Only those neurons showing a significant response to the action and a significant selectivity for the static snapshots were incorporated in this analysis. The correlation coefficients presented in Results were computed using a time window of 150 ms and a delay of 50 ms. Thus, for the snapshots in the locomotion sequence, the neuronal activity was averaged across a window of 150 ms starting 50 ms after the occurrence of the snapshot in the locomotion sequence. The responses for the static presentations of these snapshots were computed in a window of the same duration that started 50 ms after stimulus onset. We examined a range of delays (0–100 ms) and time window durations (100–250 ms), all of which yielded qualitatively similar results.
To compare the strengths of responses to the action and to the static presentations of the snapshots, we computed an action index = (Pa − max Ps)/(Pa + max Ps) for each neuron, with Pa being the net peak firing rate, between 50 and 1100 ms, for the action, and max Ps being the maximum net firing rate, between 50 and 350 ms, for the seven static snapshots (times relative to stimulus onset). We followed the procedure of Vangeneugden et al. (2009) to compute this index. Briefly, we smoothed the response using a Gaussian kernel (SD, 25 ms) before determining the maximum firing rate. Only neurons with a net peak firing rate exceeding 10 spikes/s for the action were considered. Other analyses of the responses in this and other tests are described in the relevant sections in Results.
Results
We recorded the responses of single rostral temporal cortical neurons to locomotion displays in two macaque monkeys (M1 and M2) that had been extensively trained to categorize facing direction and forward versus backward walking by a “humanoid” walker (Vangeneugden et al., 2010). Neurons from both banks of the STS and the lateral convexity of IT were sampled. Although the recording locations explored were, on average, more posterior in M1 than in M2, there was still considerable overlap (Fig. 2).

Estimated range of recording locations. Top, Sagittal MRI sections of each monkey marking the most posterior and anterior recording locations. The bottom coronal MRI sections show the most posterior and anterior recording locations. a, Monkey M1, 1 and 2. b, Monkey M2, 3 and 4. The boxes approximately demarcate the lateral-medial extent of responsive cells at those coronal planes.
Effect of facing direction and forward versus backward walking: single-neuron examples
The main test included 16 conditions: movies of 8 facing directions combined with forward and backward walking for each of these facing directions (Fig. 1). The stimuli were presented during controlled fixation on a small red target. Figure 3 shows three examples of single neurons that responded to at least one of the stimuli. The first neuron (Fig. 3a) shows strong selectivity for facing direction, responding mainly to the 180° facing direction (two-way ANOVA with facing direction and forward vs backward as factors; main effect of facing direction: p < 0.00001). Note the similar responses to the forward and backward conditions of the same facing direction (no main effect of forward vs backward nor an interaction effect between the two factors: all values of p > 0.14). Such a response pattern was typical of the majority of neurons (see below). The neuron shown in Figure 3b not only shows a strong effect of facing direction (main effect: p < 0.00001) but also for forward versus backward locomotion (main effect: p < 0.005). Note, however, that the modulation between the forward and backward conditions was relatively weak. The neuron shown in Figure 3c shows a much stronger effect of forward versus backward locomotion (main effect: p < 0.00001), in addition to strong selectivity for facing direction and a significant interaction effect (both values of p < 0.00001). Note the similar responses shown by this neuron for facing directions along the same axes (e.g., 0 and 180°).

Selectivity for locomotion stimuli in the main test: single-neuron examples. PSTHs and raster plots are positioned according to the conventions of Figure 1a. The left and right PSTHs of a pair indicate responses to forward and backward walking, respectively, for a particular facing direction. Facing directions are indicated in the central inset. All three neurons show a significant effect of facing direction (all values of p < 0.00001) combined with a, no significant effect of forward versus backward locomotions, nor a significant interaction effect (both values of p > 0.14); b, only a significant effect of forward-backward (p < 0.005); and c, a significant main effect of forward versus backward and a significant interaction effect (values of p < 0.00001). Bin width is 25 ms. For each neuron, firing rates in spikes/second are indicated on the vertical axis. The vertical lines mark stimulus onset and offset; stimulus duration was 1086 ms.
These examples demonstrate that single STS/IT neurons can show selectivity for facing direction and that some can also distinguish between forward and backward walking directions. The movies of the eight different facing directions vary in both snapshots and the motion trajectories. Hence, selectivity for facing direction could be attributable to selectivity for the body poses and/or for motion trajectories associated with the different facing directions. However, forward and backward movies for the same facing direction differ only in their frame sequence (backward movies are forward movies played in reverse) and contain the same snapshots. Thus, different neuronal responses between the forward and backward locomotions, when averaged across the whole movie presentation, suggest selectivity for snapshot sequence and/or motion. This will be examined in more detail below.
Selectivity for facing direction
Of the 171 responsive neurons (81 and 90 neurons in M1 and M2, respectively) tested with 2 × 8 facing-direction conditions (main test), the majority (65%) showed a significant effect of facing direction (two-way ANOVA: main effect of facing direction or interaction significant; p < 0.025). In a complementary analysis, we examined the significance of the facing direction effect by means of a one-way ANOVA. We conducted this one-way ANOVA for the forward and backward conditions separately, thus giving two values for each neuron (2 × 171 = 342 cases in total). This yielded 187 cases (55%; 187 of 342) showing a significant effect of facing direction. Interestingly, of these 187 selective cases, 35% preferred the trained walking directions (0F, 0B, and 180F), which is a significantly larger proportion than the 19% (3 of 16) expected from a uniform distribution of preference (p < 0.05, binomial test). This may suggest that the extensive training that the monkeys received before the recording sessions affected the preferences of the facing-direction selective neurons.
Figure 4e shows the average facing direction tuning for all facing-direction selective neurons (n = 187 cases). Note that this average tuning curve was obtained by determining the preferred direction using an independent set of trials (see Materials and Methods). Such a procedure avoids the overestimation of the actual tuning that occurs when peak responses are selected from noisy data. Two points are noteworthy regarding the average tuning curve for facing direction. First, a change in facing direction of only 45° from the preferred direction is sufficient to cause a marked drop of the average response strength, with little additional decrease in the response strength with larger direction differences. Second, at 180°, opposite the preferred facing direction, the average response is stronger than that at facing directions closer to the preferred direction. This differs from classic direction tuning, where the response decreases with increasing distance from the preferred direction (classic bell-shaped tuning curves as observed in, e.g., macaque area MT for motion direction). Instead, it suggests that there is less selectivity for two facing directions lying along the same axis than for other direction differences. This sort of axial selectivity was most prominent for neurons preferring the 90 and 270° directions (Fig. 4c), which is not surprising given that these stimuli differ relatively little in appearance (Fig. 1b). Nonetheless, axial selectivity was also clearly present for the 0 and 180° directions (Fig. 4a). The neurons tuned to the other two axes showed the lowest average direction selectivity (Fig. 4b,d). These analyses show that the neuronal responses vary with facing direction, but that in general, the dependence on facing direction is unlike classic, bell-shaped direction tuning.

Average facing direction tuning for facing-direction-selective neurons. The tuning curves, after alignment of the preferred facing direction (P) to 0°, were averaged. The responses of neurons with a preferred facing direction along the same axis were averaged. Response strengths were not normalized before averaging, but the averaged responses are normalized by their maximum in the plots. The thin black lines indicate SEMs. a, 0–180° (n = 72; maximum average firing rate, 19.8 spikes/s). b, 45–225° (n = 38; maximum firing rate, 16.3 spikes/s). c, 90–270° (n = 51; maximum firing rate, 20.3 spikes/s). d, 315–135° (n = 26; maximum firing rate, 25.7 spikes/s). The average tuning curve for all selective neurons is shown in e (n = 187; maximum firing rate, 20.1 spikes/s).
Selectivity for forward versus backward walking
Of the 171 responsive neurons recorded in the main test, a minority (18%) showed a significant effect of forward versus backward walking (two-way ANOVA: main effect of walking direction or interaction significant; p < 0.025). In a complementary analysis, we tested, for each neuron, whether the response in the forward condition differed from that in the backward condition for at least one facing direction. Since the perception of forward versus backward walking is rather subtle for the 90 and 270° locomotions, we excluded these directions from this analysis. The response differences were tested with the nonparametric Mann–Whitney U test using a corrected p value of 0.008 (0.05/6 comparisons for each neuron). Applying this second analysis showed that only 13% of the neurons responded significantly differently to the forward versus backward walking for at least one of the six facing directions tested.
We quantified the degree of selectivity by computing a d′ index (see Materials and Methods) comparing responses to the forward and backward stimuli for the best facing direction (d′ fwd-bwd). Given that the perception of the difference between forward and backward walking for the 90 and 270° locomotions is poor, we again excluded those conditions from the present analysis. Thus, the best response was chosen from the 12 remaining stimulus conditions. We thereby excluded three neurons that were highly selective for the 90 or 270° conditions and failed to respond to any of the other conditions. For comparison, we also computed d′ values contrasting the best and worst facing direction (d′ facing) (see Materials and Methods) and contrasting the best facing direction with the one differing by 180°, along the same axis (d′ axis) (see Materials and Methods), for the same neurons. The distributions of these three d′ indices (n = 168) are shown in Figure 5a. As expected from the ANOVA analyses described above, the median d′ fwd-bwd (0.75) was significantly lower than that for facing direction (1.65; Wilcoxon's matched-pairs test, p < 0.00001). Also, the d′ for stimuli differing in facing direction by 180° (0.98) was significantly higher than the d′ for forward versus backward (0.98 vs 0.75, respectively; Wilcoxon's matched-pairs test, p < 0.00001). Thus, the overall degree of selectivity for forward versus backward stimuli was rather weak, with only 10 of 168 neurons exhibiting a d′ >2.

Distributions of single-cell selectivity for different walking directions for the main (a) and random-start frame test (b). a, Distributions of d′ indices for forward-backward (blue; d′ fwd-bwd), facing direction (orange; d′ facing), and facing direction along the same axis (red; d′ axis) for all neurons responsive in the main test (n = 168). b, Distributions of d′ indices for responsive neurons in the random-start frame test (n = 45). Note that, in this test, only three conditions were shown, and thus the preferred direction was not always included, explaining the lower average d′ values. Also, d′ facing and d′ axis are identical for this test, since only two facing directions (along the same axis) were presented. Medians of each of the distributions are indicated by arrowheads. Significant differences between the distributions are denoted by asterisks (all values of p < 0.001).
Classification of walking direction by the population of temporal neurons
All analyses thus far have described the selectivity of single STS/IT neurons. As is the case for many of the selectivities observed in visual cortex, single neurons varied markedly in their degree of selectivity for facing direction and also, to some extent, with regard to forward versus backward walking. This raises the question of how well this population of STS/IT neurons can classify the locomotion movies and which movies tend to be “confused” by this population of neurons. To answer these questions, we trained linear SVM classifiers using population response vectors as inputs. Population response vectors were constructed by concatenating the responses of randomly drawn, single trials of neurons for which at least six trials per condition were available (n = 146; 85% of the total population; 67 and 79 neurons from M1 and M2, respectively). We used four randomly drawn trials (without replacement) from each neuron to train the classifier while using two of the remaining trials to measure the performance of the classifier (for details, see Materials and Methods). Thus, training and testing were performed on different and independent data, avoiding circularity and protecting against overfitting. We tested 1000 permutations of trial numbers and neurons.
In an initial SVM analysis, the response was defined as the mean firing rate averaged across the entire stimulus duration (as for the single-neuron analyses above). Figure 6a displays the confusion matrix plotting the relative frequency with which a particular stimulus (“expected”; rows) is classified as one of the 16 possible stimuli (“predicted”; columns). Note that each of the rows (expected or presented stimuli) sums to 100%. Perfect classification corresponds to values of 100% on the right diagonal (predicted = expected). Classification accuracy averaged across the 16 locomotions was 48% correct, which was considerably and significantly greater than expected by chance (1/16 = 6.25%). However, the overall classification performance was far from perfect. Inspection of the confusion matrix shows that the classification errors are not randomly distributed and thus do not merely reflect noisy data. First, classification of the facing direction, regardless of walking forward or backward, is much better than overall classification accuracy. Indeed, overall classification performance for the former was 76% correct. Thus, the low overall classification accuracy is attributable more to a confusion of forward versus backward walking than to a difficulty in distinguishing locomotions differing in facing direction. This is revealed in the confusion matrix by the 2 × 2 square patterns along the diagonal. Second, errors in the classification of facing direction were also distributed systematically. Three groups of facing direction stimuli were rarely confused: (1) the 0 and 180° directions, (2) the 45, 135, 225, and 315° directions, and (3) the 90 and 270° directions. Notably, the neurons tended to confuse the oblique directions and even more so the 90 and 270° directions. Third, locomotions along the different axes varied greatly in their classification accuracies: the average performance for the 0 versus 180° stimuli was 76% (range, 65–84%), whereas it averaged only 38% (range, 25–54%) for the other axes. Fourth, except for the 90 and 315° facing directions, the percentage of correct classifications of forward locomotions exceeded the misclassifications of that stimulus as backward and vice versa. Thus, the population activity was able to classify forward versus backward walking but this ability depended strongly on facing direction axis: for the 0 and 180° directions, the mean accuracy of forward-backward classification was 83% correct (chance level, 50%), whereas only 56% of the oblique-facing directions and about chance level (49%) of the 90 and 270° directions were correctly classified. Thus, the classification accuracy of forward versus backward walking was relatively high for the trained stimuli, but less for the other, untrained stimuli. The difference between trained and untrained stimuli was present even within the 0–180° direction axis. The monkeys were extensively trained on three locomotions: 0F, 0B, and 180F. The classification accuracy for these three trained stimuli ranged from 75 to 84% correct (mean, 79%), whereas it was only 65% for the untrained, 180° backward stimulus.

Confusion matrices displaying the performance of the linear SVM classifier. In each panel, the rows indicate the actual presented, and thus expected, locomotion, and the columns, the classifications (i.e., the predictions made by the classifier). The classification scores are plotted using the color scale shown at the bottom. Numbers indicate classification scores in percentage. Perfect classification corresponds to values of 100% along the right diagonal. The proportions of a row add up to 100%. Facing directions are indicated in degrees following the convention of Figure 1a. Forward and backward walking are denoted by “F” and “B,” respectively. a, b, Confusion matrices for the main test, when taking as input averaged neuronal activity per trial in a 1050 ms window (a) or in 21 bins of 50 ms each (b). The latter incorporates temporal within-action response modulation. Training and testing was performed using the responses of 146 neurons. c, d, Comparison of the confusions made between three locomotion categories (0F, 0B, and 180F) using random- or fixed-start positions for the same neurons. The responses for the random-start SVM were obtained in the random-start frame test, whereas the responses for the fixed-start SVM were from the main test of the same neurons. Neuronal activity was computed for each trial in a 1050 ms window (c) or in 21 bins of 50 ms each (d). Training and testing was performed using the responses of 42 neurons.
In all the analyses so far, we have used the mean firing rate computed for the entire stimulus duration. From an inspection of the peristimulus time histograms (PSTHs) of single neurons, it was clear that most neurons did not respond over the whole stimulus duration but only to certain segments of the action (e.g., neurons in Fig. 3b,c). One possible explanation for this within-action response modulation is that these neurons respond selectively to particular snapshots or motion patterns that occur at specific moments during the action (this possibility will be addressed later). Now, we will determine whether incorporation of such within-action response modulation increases the ability to classify the actions. To this end, we binned the responses for each trial, using 50 ms bins starting 50 ms after stimulus onset. The population response vector of a trial then consisted of the concatenation of the binned firing rates of the neurons (n = 146). Otherwise, the SVM analysis was identical with the one described above (with the average firing rate computed over the entire stimulus duration).
The confusion matrix obtained when the population response vector consisted of these binned responses is presented in Figure 6b. It is obvious that, except for the 90 and 270° facing directions, the stimuli were classified perfectly or nearly perfect (97–100% correct). It is important to note that the SVM analysis based on the population response vectors consisting of binned firing rates could classify forward from backward walking extremely well, even for the 90 and 270° directions (mean forward-backward classification, 94% correct; 80% correct for the latter two conditions and 99% correct for the remaining 12 conditions; chance level, 50%). In fact, in the case of the 90 and 270° directions, confusions existed mainly between opponent facing directions with the walker moving in the same direction (i.e., with some confusion between the 90F and 270F but less between 90F and 90B or 270B and 270F).
The above SVM takes the within-action differences in response into account. The increased performance compared with when using average firing rates computed across the stimulus duration suggests that this within-action modulation carries information about forward versus backward walking. An alternative and less interesting interpretation is that the improved performance of the classifier is attributable to the increased number of input features. Results reported below (comparison of random-start frame and fixed-start frame conditions), however, strongly suggest that the improved performance is not merely attributable to an increase in the number of input features but attributable to the added information of within-action response modulations. Note that this added information does not refer to temporal dependencies within the responses, since the SVM treats the different time bins as independent features. Instead, the added information refers to firing rate differences between conditions within the different 50 ms bins that are obscured when averaging across bins. Note that when areas downstream to STS/IT use this information, they need to store the firing rates of the different bins or at least part of the temporal fluctuations in the response. At the least, our analysis shows that the information to discriminate forward from backward locomotion is present.
Subsequently, we questioned how the classification accuracy evolved during the course of the response and whether the stimulus preferences remained invariant during the course of the response. In theory, it is possible that neurons coding for, for example, forward walking at the beginning would continue to do so during the course of the response. However, given the strong impact of the 50 ms binning on the overall classification performance, it might also be that stimulus preferences shift during the course of the response or that different neurons contribute to the classification at different moments during the response, in other words, that the stimulus code is not stationary but changes during stimulus presentation. To answer both questions, we trained the classifier using population vectors (n = 146 neurons) based on the average firing rate of a particular 50 ms bin and tested the SVM using the average firing rates, on independent trials, of this and all other bins (e.g., training with trial X: bin 150–200 ms while testing different trial Y: bins 50–100, 100–150, 150–200, 200–250, etc.). Training and testing using the same bin will assess the time course of the classification, whereas training and testing using different bins will assess the stationarity of the code.
Since we were mainly interested in the classification of facing direction along any given axis (e.g., 0 vs 180°) or forward versus backward classification for a particular facing direction, we computed, for each axis (Fig. 7) and each facing direction (Fig. 8), the percentage correct classifications of facing direction and forward versus backward locomotion, respectively. The classification score was plotted as a function of the difference between the trained and the tested bin [training–test time difference (TTTD) plot]. Note that, in all TTTD plots, chance performance corresponds to 50%.

TTTD plots of SVM classification of facing direction along the same axis. Classification accuracy is plotted as a function of trained (ordinate) and tested (abscissa) 50 ms bins. For the data shown along the right diagonal, tested and trained bins coincided. Classification accuracies were computed for pairs of facing directions along the same axis (e.g., 0 and 180° facing directions; rows) and for forward (left column) and backward walking (right column) separately. Chance performance corresponds to 50% (green color). Note that blue colors correspond to a reversed classification (e.g., 0° facing direction classified as 180°). Training and testing was performed using the responses of 146 neurons.

TTTD plots of SVM classification accuracy between forward and backward locomotions of the same facing direction. The TTTD plots show the forward-backward classification performance (chance, 50%) for each of the eight facing directions. They are ordered according to the schema presented in the center (Fig. 1a). Training and testing was performed using the responses of 146 neurons. Conventions are the same as in Figure 7.
First, we will discuss the classification of facing direction along a single axis (e.g., 0 vs 180°) (Fig. 7). As expected from the previous analyses (Fig. 6a,b), the overall classification performance was poorer for the 90–270° axis (mean accuracy along the diagonal, 62%), whereas high-to-excellent classification performances were achieved for the other axes when training and test bins coincided (mean accuracy along the right diagonal, 86%). Overall, classification performance varied little over the course of the response and was already high by the 50–100 ms bin. Importantly, performance deteriorated quickly with increasing temporal offset between test and training bins (data offset from the diagonal in the TTTD plots of Fig. 7). Overall, performance remained stable only when test and training bins differed by <100 ms, although this margin varied during the course of the action. Thus, these neurons code predominantly for momentary action snippets and not for the overall facing direction. A prominent feature of the TTTD plots is the periodicity of the pattern of the classification scores. A classifier trained at a particular time period will classify the response vectors well not only for the same time period (±100 ms) but also for response vectors ∼500 (0–180° axis) or 750 ms (oblique axes) distant from it. This is probably related to the cyclic, repetitive nature of the limb movements during locomotion (see below). Importantly, between such classification peaks, performance drops to below chance level (Fig. 7, blue colors), showing that response patterns that were trained as belonging to direction A are consistently classified as belonging to direction B and vice versa. This reversal of classification is a strong demonstration of the nonstationary coding of facing direction by these neurons. As shown in the supplemental material (supplemental Fig. 1, available at www.jneurosci.org as supplemental material), the median period of the cyclic patterns that are present in the TTTD plots for the 0–180° axis, where these are most apparent, was 500 ms (pooled across peak and trough periods and across forward and backward locomotions), which fits the 500 ms period of the cyclic pattern in the locomotion stimulus (e.g., the distance between the ankles). Since opening and closing of the legs correlate with arm movements, it is impossible to know which features determine the cyclic pattern in the TTTD plots and the corresponding spike trains, but this analysis suggests it is related to the cyclic pattern of the locomotion.
Figure 8 shows the TTTD plots of forward-backward classification for each of the eight facing directions. Overall, the forward-backward classifications have slower time courses than those for facing direction. Here, also, classification performance varied substantially during the course of the response. In a manner similar to the facing-direction classification, marked periodic patterns are present in the TTTD plots for the 0 and 180° directions: performance is best when training and testing bins coincide, or where they differ by ∼500 ms (supplemental Fig. 2, available at www.jneurosci.org as supplemental material). Between these points, classification performance is worse than expected by chance, indicating a reversal of the classification (Fig. 8, blue). Such reversals are also prominent for other facing directions, particularly the oblique directions.
Comparing responses to actions and static presentations
To determine whether motion was required to drive the neurons, we compared the response during the action with responses to static presentations of representative frames, or snapshots, sampled from the complete walking cycle. This test was performed for 133 neurons responsive to at least one locomotion direction. We found that some neurons required motion, since they did not respond to the static presentations of the snapshots (Fig. 9a), whereas other neurons responded equally well to the static presentations (Fig. 9b) and motion.

Neuronal responses to static snapshots and locomotions compared: two example neurons. PSTHs with raster plots displaying a neuron not responding to static poses (a; action index, 0.85) and a neuron firing selectively to different body poses (b; action index, −0.15). The snapshots are shown above the corresponding PSTH. The PSTHs for the locomotion stimuli are shown in each row to the left. The dynamic walker elicited a significant discharge in both neurons. The neuron in a is the same as in Figure 3c (note that the start frame position of the 180F locomotion differed from that in Fig. 3c). The neuron in b is the same as in Figure 3b.
To capture differences in the responses to static and dynamic displays, we computed an action index (Vangeneugden et al., 2009). A positive action index indicates a higher peak response to the action than to the preferred static snapshot, and a negative index, a lower peak response. As shown in Figure 10, most neurons had negative or near-zero action indices (median action index = −0.02; n = 133), indicating strong responses to the static presentations. The distribution of the action indices differed between regions: neurons in the upper bank and fundus of the STS had a significantly higher median action index (0.33; n = 35) than neurons in the lower bank of the STS (median, −0.08; n = 82; Mann–Whitney U test, p < 0.00001) and lateral convexity of IT (median, −0.05; n = 16; Mann–Whitney U test, p < 0.00001).

Distribution of the action indices of neurons (n = 133) recorded in different anatomical STS/IT regions. Regions included the following: lateral convexity of IT (light gray) and STS lower (dark gray) and upper bank (black). Medians are indicated by arrowheads above the graph. Significant differences between medians are denoted by asterisks (Mann–Whitney U test, values of p < 0.00001). Positive (negative) action indices indicate smaller (greater) responses to static presentations of body poses than to the locomotion. Following Vangeneugden et al. (2009), the criterion to distinguish between SA and A neurons was set at 0.2 (stippled vertical line). The values on the x-axis indicate neurons with action indices of the same or larger size as the plotted value.
Vangeneugden et al. (2009) distinguished two classes of neurons based on these action indices. Neurons with an action index >0.2 responded more strongly to the action than to the static presentations, and were labeled “motion” neurons. In the present paper these neurons will be labeled “A” neurons (“A” stands for “action”). Neurons of the complementary class were labeled “snapshot” neurons by Vangeneugden et al. (2009). We will label these neurons “SA” (“static and action”) since they responded as well (or even better) to the static presentations of the snapshots than to the action. The majority (72%) of the 36 A neurons were recorded in the upper bank and fundus of the STS, whereas the great majority (91%) of the 97 SA neurons were recorded either in the ventral bank of STS or in lateral convexity of IT, corroborating previous results (Vangeneugden et al., 2009). Both types of neurons were observed in each of the two animals. The action indices of neurons with a significant effect of facing direction (median action index = −0.04) did not differ significantly from those showing no effect of facing direction (median, 0.06; Mann–Whitney U test, p = 0.46). However, neurons with a significant effect of forward versus backward locomotion demonstrated a significantly larger action index than those that did not (medians, 0.08 and −0.05, respectively; Mann–Whitney U test, p = 0.034). The majority of the neurons showing a significant forward-backward effect were SA neurons (68%; 19 of 28), which demonstrates that it is not only the A neurons that can distinguish forward from backward locomotion. This led us to ask how well A and SA neurons can classify facing direction and forward versus backward walking. Note that for these SVM analyses, the number of A and SA neurons were made equal (both groups contained 32 neurons with at least six trials per condition) (see Materials and Methods) (SA neurons: 9 and 23 from M1 and M2, respectively), allowing a proper comparison of the two classes of neurons. Figure 11 shows the confusion matrices obtained from SVM classification using population response vectors of A and SA neurons separately (Fig. 11a,c, with per-trial averaged firing rate as input; c,d, using the per-trial binned firing rates as input). Excluding the poorly performing 90 and 270° facing directions, the A neurons had an average forward versus backward classification performance of 80% correct (averaged across the remaining six facing directions, in the SVM analysis using the averaged, per-trial firing rate; chance level, 50%). The classification performance using an equal number of SA neurons was poorer but still above chance (average, 59%). In fact, the sample of SA neurons was able to classify the behaviorally trained 0F and 0B stimuli with an accuracy of 76%. The population of A neurons, in comparison, could classify these stimuli with an accuracy of 88%.

Confusion matrices displaying the classification performance of the linear SVM classifier using the responses of A (a, b) or SA (c, d) neurons. Confusion matrices for the main test, when taking as input averaged neuronal activity per trial (a, c) in a 1050 ms window or (b, d) in 21 bins of 50 ms each. Note that all SVMs were trained and tested using the same number of neurons (n = 32). Conventions are the same as in Figure 6.
Taking into account the response modulation during the course of the locomotions (Fig. 11b,d; binned, per-trial firing rate) improved the classification performance of the SA neurons considerably, more so than that of the A neurons. In fact, the A neurons confused facing directions along the same axis more often than forward versus backward locomotion. These results are in line with the idea that SA neurons signal predominantly momentary body pose, which can be used to classify both facing direction and forward versus backward locomotion (at least for a fixed starting frame and when within-action response modulations of the response are taken into account) (see below). These data also agree with the idea that A neurons carry a signal that can be used to classify stimuli that differ in motion parameters such as forward versus backward locomotion (even when using firing rates averaged across the full analysis window).
Body pose selectivity
Signaling momentary body poses in locomotion displays assumes that single neurons are sufficiently selective to body poses. This is not trivial, given the relatively small differences in form associated with the different poses of a walking human. The neuron illustrated in Figure 9b, however, shows an exquisite selectivity for statically presented body poses. To determine the range of static snapshots to which the neurons responded, we computed for each of the 118 neurons with significant responses to the static snapshots (split-plot ANOVA; main effect of baseline-stimulus response; p < 0.05) the number of snapshots (of the seven tested) to which the neuron responded with at least one-third of its maximum net response (Vogels, 1999). The median snapshot range for the population of responsive neurons was 6 (first quartile, 5; third quartile, 7; N = 118). Similar snapshot range distributions were obtained when considering only neurons tested with snapshots of the 0 and 180° facing directions (median snapshot range, 6; N = 72) and for neurons that showed a significant difference between forward and backward locomotion (median snapshot range, 6; N = 20) (supplemental Fig. 3, available at www.jneurosci.org as supplemental material). Of the 118 neurons, 65 (55%) showed a significant effect of body pose (one-way ANOVA, p < 0.05). The average pose selectivity for the selective neurons is shown in supplemental Figure 4 (available at www.jneurosci.org as supplemental material). To quantify the degree of pose selectivity we computed for each pose selective neuron a best-worst index = (best net response − worst net response)/best net response; net responses computed for each of the seven snapshots. The median best-worst index was 0.82 (first quartile, 0.54; third quartile, 1.04; N = 65), indicating an on average fivefold difference in response between the best and worst responses to the different poses. The two animals showed a similar degree of snapshot selectivity [median best-worst index: M1, 0.78 (N = 43); M2, 0.94 (N = 22)]. For the 39 pose selective neurons that were tested with the same snapshots of the 0 and 180° facing directions, we determined whether some postures were more often represented than others. This was not the case since the distribution of the preferred poses of these neurons did not significantly differ from a uniform distribution (χ2 test; NS; N = 39) (Fig. 12a).

Neuronal selectivity for body poses. a, Distribution of preferred poses for 39 pose-selective neurons tested with snapshots from the 0 and 180° facing directions. b, Distribution of the Pearson product-moment correlation coefficients computed between the neuronal activity evoked by the static snapshots and the same snapshots embedded in the locomotion sequence. The correlations were only computed for neurons (n = 65) showing pose selectivity. The arrowhead indicates median correlation.
Next, we examined whether body pose tuning could predict the response modulation during the course of the locomotion. Therefore, we examined the correlation between responses to the static snapshots and the responses to the same snapshots/body poses when the latter were embedded in the locomotion. This correlation analysis was performed for the 65 neurons that showed significant body pose selectivity. Figure 12b shows the distribution of the Pearson correlation coefficients between these spiking activities as measured in a 150 ms window, beginning 50 ms after the onset of the snapshot within the locomotion or the static presentation. The median correlation coefficient was 0.46, which was significantly greater than 0 (Wilcoxon's test, p < 0.001). This analysis shows that the modulation of the response during the locomotion is related to the body pose selectivity of the neuron. Thus, these neurons are able to signal momentary body poses during the course of the action.
The selectivity for body poses can explain why the population of SA neurons is able to code for forward versus backward locomotion when the within-action response modulation is taken into account. It also explains the cyclic patterns observed in the TTTD forward-backward plots (Fig. 8), since forward and backward locomotion displays differ in their component snapshots at particular moments in time within the movie. Although the same snapshots are present in the forward and backward stimuli, their sequences and thus the times at which a particular snapshot occurs, differ in both movies (Fig. 1b, e.g., comparing 0F and 0B, initially the legs close and open, respectively). We quantified the differences between snapshots between the forward and backward versions of the 0 and 180° movies, by computing the signed difference between the distances between the two ankle points at corresponding frames. This signed difference followed a cyclic pattern during the course of the movie, with a period of 500 ms. This period was close to the measured median period of the cyclic pattern in the TTTD plots for these conditions (median period pooled across peak and trough periods and across the two facing directions, 550 ms), as shown in supplemental Figure 2 (available at www.jneurosci.org as supplemental material). Thus, the periodicity observed in the TTTD plots can be related to the periodicity in the differences between snapshots in the forward and backward conditions. Note that such a mechanism, sensitive to momentary body pose, has strong limitations in signaling forward versus backward motion, since it signals only when a particular pose occurs. This limitation is illustrated nicely by the reversals of the classification in the TTTD plots for forward and backward walking: given the cyclic nature of the poses during walking, and thus the cyclic nature of the momentary differences between the poses in the forward and backward stimuli, a classifier reading out the neuronal responses will erroneously classify forward as being backward walking, and vice versa, when training and testing use opposite phases of the walking cycle.
Start frame randomization
The momentary, body pose mechanism will not be able to distinguish forward from backward walking when the start frames of the movies are randomized, since then a particular pose can occur at any time in both the forward and the backward movies. However, monkeys, after considerable training (Vangeneugden et al., 2010), can successfully categorize movies of forward or backward walking when the start frame is randomized across trials. This poses the question of whether individual neurons are also able to differentiate forward from backward walking when start frames are randomized. A strong hint that this might be the case arises from the fact that a non-negligible proportion of the neurons were able to significantly discriminate forward from backward locomotion when the firing rates were averaged over the stimulus duration (see above, Selectivity for forward versus backward walking). Averaging neuronal activity removes momentary differences in firing rates among the stimulus conditions.
To obtain direct evidence for coding of sequence information, we measured neuronal responses to the 0F, 0B, and 180F locomotions, while randomizing the start frame across trials. Since the monkeys were trained to categorize these locomotions, we could record the responses of the neurons during the actual classification of the stimuli by the animals (see Materials and Methods). We recorded 45 responsive, isolated neurons using randomized start frames. Behavioral categorization of forward versus backward locomotion averaged 96% correct (chance level, 50%), whereas the categorization of the facing direction of the forward locomotion was performed at 99% correct. Interestingly, the animals confused the 180F and 0B conditions to a somewhat greater extent (accuracy, 93% correct). In these two conditions, although facing differently, the agent walked in the same direction (i.e., to the left) (on a treadmill).
Forty percent of the 45 neurons (18 of 45) responded significantly differently to the two facing directions (Mann–Whitney U test, p < 0.05; firing rate computed for the whole stimulus duration). More importantly, 20% of the neurons (9 of 45) also responded significantly differently to the forward versus backward locomotions, a proportion significantly higher (binomial test, p < 0.05) than the expected 5% chance level (given that we used a type 1 error rate of 0.05 in the Mann–Whitney U test) and is similar to the 18% obtained when the stimuli had fixed starting positions (see above). Figure 13a shows an example neuron whose responses differed significantly in the forward and backward, 0° facing-direction conditions (Mann–Whitney U test, p = 0.0002). This neuron responded strongly to static presentations of snapshots (SA neuron). Figure 13b illustrates the average difference in the normalized responses to the forward and backward conditions for the nine neurons showing a significant effect of forward versus backward walking. For this figure, we ranked the two conditions according to their response in one-half of the trials, and then computed the PSTH for the other one-half of the trials. The normalized PSTHs for the best and worst condition were subsequently averaged across neurons. For these neurons, the response to the best locomotion direction (either forward or backward) was approximately twice that of the worst condition. Thus, even when the start frame position is randomized across trials, temporal cortical neurons can signal a difference between stimuli that differ only in their snapshot sequence.

Neuronal responses to locomotions with randomized start frames across trials. a, Example neuron recorded in the random-start frame test responding significantly different to forward and backward walkers (0F vs 0B) and to walkers facing in different directions (0F vs 180F). This neuron also responded strongly to static presentations of the snapshots (SA neuron). b, The mean normalized response plotted for the best and worst walking direction (forward or backward walking; same facing direction), averaged across neurons that showed a significant effect of forward versus backward walking (n = 9). Best and worst ranking and plotting were performed on independent sets of trials.
The difference between forward and backward locomotions appeared relatively late in the course of the response of the neuron of Figure 13a, much later than the greater response difference seen between the two facing directions. This was true for the population of nine neurons that showed both a significant difference between forward and backward locomotion and between left versus rightward walking when randomizing the start frame (supplemental Fig. 5, available at www.jneurosci.org as supplemental material). This difference in onset latency between forward-backward and facing direction discrimination agrees with the idea that the latter can be based on fast form discrimination, whereas the former requires integration across several frames. The onset of the response difference allows one to estimate approximately how many frames the neurons require to discriminate forward from backward sequences. Note that this estimate represents an upper bound of the required real number of frames since the response latency to the snapshot and snapshot sequences are also included in this estimate. Twenty frames (at 60 Hz: 333 ms) (supplemental Fig. 5, available at www.jneurosci.org as supplemental material) were required to obtain a significant forward-backward response difference in the nine selective neurons, but this is likely an overestimation of the real number of required frames given the low number of neurons and correspondingly weak statistical power. Indeed, eyeballing supplemental Figure 5 (available at www.jneurosci.org as supplemental material) provides a lower estimate of 10 frames (or 167 ms).
The distributions of d′ fwd-bwd and d′ facing are shown in Figure 5b. As expected, the average d′ for facing direction (median, 0.67) was significantly larger than that for forward versus backward (median, 0.35; Wilcoxon's matched pairs test, p < 0.001). Since the same neurons were also tested using a fixed-start frame across trials, one can correlate the selectivity measures obtained in the fixed- and the random-start frame conditions. Such correlation analyses showed that, for both the fwd-bwd and the facing d′ indices, there was a significant correlation (p < 0.05) between the d′ values for the fixed- and the random-start position conditions, although this correlation was greater for the facing direction (d′ facing; r = 0.58) than for the forward-backward comparison (d′ fwd-bwd; r = 0.36). This distinction may be attributable to the smaller range of the d′ facing compared with the d′ fwd-bwd index. Nonetheless, this analysis again shows that forward-backward selectivity is still present when the start frame is randomized across trials, suggesting genuine selectivity for body pose sequence.
For 40 of the neurons tested with the random-start frame conditions, we also collected data with the snapshot test. Ten of these neurons were classified as A neurons and 40% (4 of 10) of these neurons showed a significant effect of forward versus backward when using a random-start frame. This proportion dropped to 17% for the 30 SA neurons. However, probably because of the small number of A neurons (n = 10), the difference in the incidences of forward-backward selectivity between the two classes of neurons failed to reach significance. Again, however, the important thing to note here is that some SA neurons can differentiate forward from backward locomotion when the start frame is randomized, indicating that these neurons signal body pose sequence (e.g., the neuron of Fig. 13a).
To determine how well the population of neurons tested in the random-start frame test could classify the three different stimulus conditions, we trained an SVM classifier using response population vectors. Forty-two of the 45 neurons were also tested with at least six trials per condition in the main test (locomotions having fixed-start frames). To allow a comparison of the classification accuracies in the two tests for the same sample of neurons, the SVMs were applied to these 42 neurons. In total, we trained four sets of SVMs: using averaged firing rates, computed for the whole stimulus duration, or using binned vectors, and then using those two measures for both the random- and the fixed-start frame tests (see above). As shown in Figure 6c, classification of forward versus backward was inferior to the classification of facing direction, when per-trial averaged firing rates were used as the input to the SVM. The classification of forward versus backward was marginally better for the fixed- (74% correct) compared with the random-start frame conditions (66% correct). The important point here, however, is that the classification of forward versus backward remains greater than chance level even when the start frame is randomized between trials. Taking into account the response modulation that occurs over the course of the action improved classification of forward versus backward markedly (100% correct) when the start frame between trials was fixed (Fig. 6d). However, such an improvement was absent in the random-start frame conditions (classification performance forward vs backward, 63% correct).
Despite the large increase in the number of features of the 50 ms binned response SVMs, the performance of the classifier was similar for the random-start frame conditions between the 50 ms binned and full duration SVMs. However, there was a marked increased performance for the 50 ms binned response SVM for the fixed-start frame conditions. Note that the difference between the number of input features of the SVMs for the 50 ms binned and full response SVM was identical in the fixed and random-start frame tests. This shows that the increased performance for the 50 ms bins classifier in the case of the fixed-start frame conditions is not attributable to the increase of the number of input features—since the same increase was also present for the random-start frame test—but depends on the information that is added when binning the response. This result corroborates our conjecture that the improvement in classification ability with the binned responses is attributable to the response modulations linked to between-condition differences in the body poses of the walker during the action. When these differences are randomized between trials, the benefit gained from the temporal response modulation to classification will disappear. The remaining classification of forward versus backward is then attributable to a signal related to body pose sequence (i.e., the temporal context of the body pose or motion information). Thus, the data show that, in addition to a momentary body pose mechanism, a body pose sequence mechanism is also present in visual temporal cortex.
Responses to full- and half-body configurations compared
We asked whether the responses of the neurons required the whole-body configuration or just parts of the body. To answer this question, we measured the responses of 42 neurons that responded to the full-body locomotion, to three stimulus conditions including the movie of the effective full-body locomotion and the same locomotion, but with only the upper or lower body half visible (Fig. 14a). A large majority of the neurons (31 of 42; 74%) showed a significant effect of configuration (one-way ANOVA with three configuration conditions, p < 0.05). An example of such a neuron is shown in Figure 14b. This neuron responded much less strongly to the upper-body configuration than to the two other conditions, while responding equally well to the lower- and the full-body locomotions. This was typical since 27 of the 31 configuration-selective neurons preferred the lower-body over the upper-body configuration.

Neuronal responses to full- and half-body configurations compared. a, The three body configurations presented in the half-body test: lower, upper, and full bodies. b, Example neuron (same neuron as in Figs. 3c, 9a). c, d, Mean normalized response to the half- and full-body configurations for the tested population of A (n = 14) (c) and SA neurons (n = 26) (d).
To quantitatively assess the effect of configuration on the response of each neuron, we computed two indices (upper- and lower-body indices) in which the net response to the full-body was subtracted from the responses to the upper- or lower-body half, respectively. This difference was then divided by the sum of the two responses. We computed these indices only when the net responses in either condition were at least 5 spikes/s, to avoid any inflated values. The median index contrasting lower and full body was −0.02 (n = 38), not significantly different from 0 (Wilcoxon's test, p = 0.08) indicating overall similar responses to lower- and full-body locomotions. In contrast, the median index comparing upper and full body was −0.49, significantly less than 0 (Wilcoxon's test, p < 0.0001; n = 38), indicating a response to the upper half reduced to only a third of that for the full body. Notably, the presence of a markedly reduced response to the upper-body configuration, combined with a response that was little affected by the presentation of only the lower half of the body, was most pronounced in the A neurons (Fig. 14c) [median upper-body index, −0.55 (p < 0.05; n = 11); median lower-body index, 0.02 (n = 12; p = 0.7334)]. The responses of the SA neurons could be reduced by removing either body half (Fig. 14d), although there was less reduction in the response for presentations of the lower half of the body (median lower-body index, −0.20; p < 0.01; n = 24) compared with the upper half (median upper-body index, −0.47; p < 0.005; n = 26). Only six neurons had both lower- and upper-body indices smaller than −0.33, indicating that only a minority of the neurons responded at least twice as strongly to the full-body than to both the lower- and upper-body halves.
These analyses indicate that the presentation of the full body was not required to elicit a strong response from most neurons, and that the majority of the neurons responded more strongly to the lower- than to the upper-body half.
Discussion
We found that the mean firing rates of STS/IT neurons discriminated locomotion direction quite accurately if walkers faced different directions, whereas only a minority of the neurons discriminated forward and backward walking (same snapshots, different sequence). Taking into account the response modulations during the locomotion, however, markedly improved the ability of the neuronal population to signal locomotion direction in displays differing only in snapshot sequence. The classification of walking direction was highly nonstationary and could even reverse during the course of the action. These findings suggest that most of the discriminatory signal is carried by momentary differences between action snippets. Comparing responses between static snapshots and the dynamic locomotion showed that discrimination between actions was driven by motion in some neurons but, in the majority, was based mostly on momentary differences between body poses. Randomizing the start frames of locomotion sequences, however, showed that neurons responding to static snapshots can carry sequence information.
Our findings agree with existing computational models of action recognition. Giese and Poggio (2003) proposed two parallel pathways, a motion and a form pathway, for analyzing actions (Schindler and Van Gool, 2008). The former is driven by motion and analyzes motion patterns providing information with which to discriminate among actions. It is tempting to identify the A neurons as part of the motion pathway of the computational models since these neurons by definition respond stronger to motion than static form. Alternatively, these A neurons may be part of the form pathway, corresponding to neurons that selectively respond to pose sequence but receiving form input [as postulated in the form-based pathway of the Giese and Poggio (2003) and Lange and Lappe (2006) models]. To decide among these alternatives, one needs to know whether the A neurons receive input from motion- or form-selective neurons. Also, one cannot exclude the possibility that these neurons integrate form and motion signals, as suggested previously for upper bank STS neurons (Oram and Perrett, 1996; Jellema and Perrett, 2003, 2006). The responses of most A neurons were modulated in a cyclic fashion during the course of the walking cycle, indicating sensitivity to action segments. The SVM analyses show that A neurons discriminate forward from backward locomotion well but, paradoxically, tend to confuse facing directions along the same axes (e.g., 0F vs 180F). These A neurons also respond more strongly to motion in lower- than upper-body features, reflecting the fact that most of the information that can distinguish forward from backward walking is present in the movements of the lower limbs. Psychophysical studies of biological motion have also pointed to the importance of the lower limbs in the perception of locomotion direction (Troje and Westhoff, 2006; Chang and Troje, 2009; Vangeneugden et al., 2010).
The form pathway in the models of Giese and Poggio (2003) and Lange and Lappe (2006) computes momentary body pose, followed by a sequence-specific integration of these poses. The momentary pose mechanism can differentiate among actions comprised of different body poses (e.g., different facing directions or walking vs jumping), whereas the pose sequence mechanism is needed to differentiate between actions differing only in their sequences of poses (e.g., forward vs backward). Both mechanisms are present in our STS/IT neurons. Importantly, sensitivity to pose sequence was also present in some neurons that responded well to static presentations: the pose-selective response of these neurons was modulated by the locomotion sequence in which it occurred. Thus, pose sequence sensitivity is not a unique property of the motion system but is also present in some form-sensitive neurons.
The population SVM analyses suggest that the momentary-pose signal is stronger than the pose sequence mechanism. This might explain why our monkeys required longer training to categorize forward versus backward walking compared with facing-direction stimuli (Vangeneugden et al., 2010). Human psychophysical studies and computational studies have also shown that forward-backward discrimination is more difficult than the discrimination of facing direction (Beintema et al., 2006). Interestingly, the neuronal classification accuracy for both facing direction and forward versus backward was greater for trained than for untrained stimuli. Performance levels for the three trained actions was also greater than for the untrained 180B, which is either a mirror image (0B) or sequence reversal (180F) of the trained stimuli. Thus, the better accuracy for the trained stimuli does not merely reflect differences in stimulus similarity. Also, stimulus similarity cannot explain why more facing-direction-selective cells preferred the trained stimuli. Thus, it is tempting to conclude that part of the response selectivities are induced by the categorization training. Also, the sequence sensitivity that we observed in SA neurons might result from the extensive training. Thus, the pose sequence mechanism might operate only for highly familiar actions, whereas other actions are represented by their poses or motion-snippet description.
The SVM analyses showed that the neurons could differentiate poses that occurred ∼100 ms apart in the context of an action, in agreement with an indirectly estimated STS integration duration for action sequences of ∼120 ms (Singer and Sheinberg, 2010). This is also in line with rapid serial visual presentation studies showing that IT neuronal selectivity is still present at stimulus onset asynchronies of 100 ms (De Baene et al., 2007) and less (Keysers et al., 2001). Note that estimated integration times depend on how different the successive snapshots are relative to the tuning width of the neuron. For sequences of natural actions in which successive snapshots differ little, the estimated integration times might exceed the real values. Some SA neurons also signal the sequence in which the pose occurs, implying sensitivity to temporal context. IT and STS neurons are known to be influenced by stimulus history, with adaptation effects being the clearest example (Baylis and Rolls, 1987; Miller et al., 1991; Sawamura et al., 2006; Liu et al., 2009; Perrett et al., 2009; De Baene and Vogels, 2010). A fast adaptation mechanism may at least partially explain sensitivity to reversals of the same sequence (Singer and Sheinberg, 2010; our data), but the sensitivity to the sequence per se (independent of start frame position) shown here is likely attributable to different mechanisms (e.g., temporally asymmetric, leaky integrators of neurons tuned to different snapshots) (Giese and Poggio, 2003). Alternatively, the pose sequence sensitivity might also depend on input from the motion pathway (e.g., from dorsal STS “motion neurons”). Unlike those of Singer and Sheinberg (2010), our monkeys could not free view but were required to maintain fixation during stimulus presentation. This prevents eye movement patterns that can differ between stimulus sequences, causing response modulations.
The A and SA neurons were to some extent anatomically segregated, with A neurons being predominantly present in the upper bank/fundus of the STS. The segregation was less pronounced, with relatively more SA neurons in the STS upper bank/fundus, than reported by Vangeneugden et al. (2009) for more simple stimuli. This agrees with other reports of strong responses to static, complex images in the upper bank of the STS (Jellema and Perrett, 2003; Barraclough et al., 2006; Singer and Sheinberg, 2010).
Our stimuli were less natural and complex than those used in previous single-cell studies of locomotion (Oram and Perrett, 1994, 1996; Jellema et al., 2004; Barraclough et al., 2006). We have observed similar weak selectivity to forward versus backward locomotion using movies of a nontranslatory, real human walker (J. Vangeneugden, N. E. Barraclough, R. Vogels, unpublished observations), suggesting that our conclusions also hold for more complex and natural images. Oram and Perrett (1994, 1996) and Jellema and Perrett (2006) found stronger selectivity for forward versus backward walking in the STS, but in that study, the agent walked across the room. It is likely that the apparent forward-backward selectivity is attributable to the strong translatory component in their locomotion stimuli. Our humanoid walkers are more complex than the point light displays used in most human biological motion studies. Apart from this difference in format, our stationary walkers are similar to those used in human studies and modeled in computational work. Thus, we believe that our data are relevant for understanding mechanisms of biological motion perception.
Our data suggest that actions are analyzed by temporal cortical neurons using distinct mechanisms. The predominant signal is a pose-based form signal, which is useful in everyday action recognition, since actions and body poses usually correlate. In addition to this pose-based mechanism, temporal cortical neurons, including those responding to static pose, are sensitive to pose sequences that can contribute to signaling learned action sequences.
Footnotes
This work was supported by Detection and Identification of Rare Audiovisual Cues FP6-IST 027787, EF/05/014, IUAP 6/29, Geneeskundige Stichting Koningin Elizabeth, and Geconcerteerde Onderzoeksacties. J.V. was a research assistant of the Fund for Scientific Research Flanders (Fonds voor Wetenschappelijk Onderzoek Vlaanderen). P.A.D.M. is currently supported by European Commission Grant IST-2004-027017 and the Interuniversity Attraction Poles Programme–Belgian Science Policy (IAP P6/29). Furthermore, we thank the Katholieke Universiteit Leuven for the use of their high-performance computing infrastructure. The help of P. Kayenbergh, G. Meulemans, M. De Paep, W. Depuydt, S. Verstraeten, I. Puttemans, and M. Docx, as well as the comments of J. Jastorff and S. Raiguel on an earlier version, is kindly acknowledged.
- Correspondence should be addressed to Rufin Vogels, Laboratorium voor Neuro- en Psychofysiologie, Katholieke Universiteit Leuven Medical School, Campus Gasthuisberg, B-3000 Leuven, Belgium. rufin.vogels{at}med.kuleuven.be


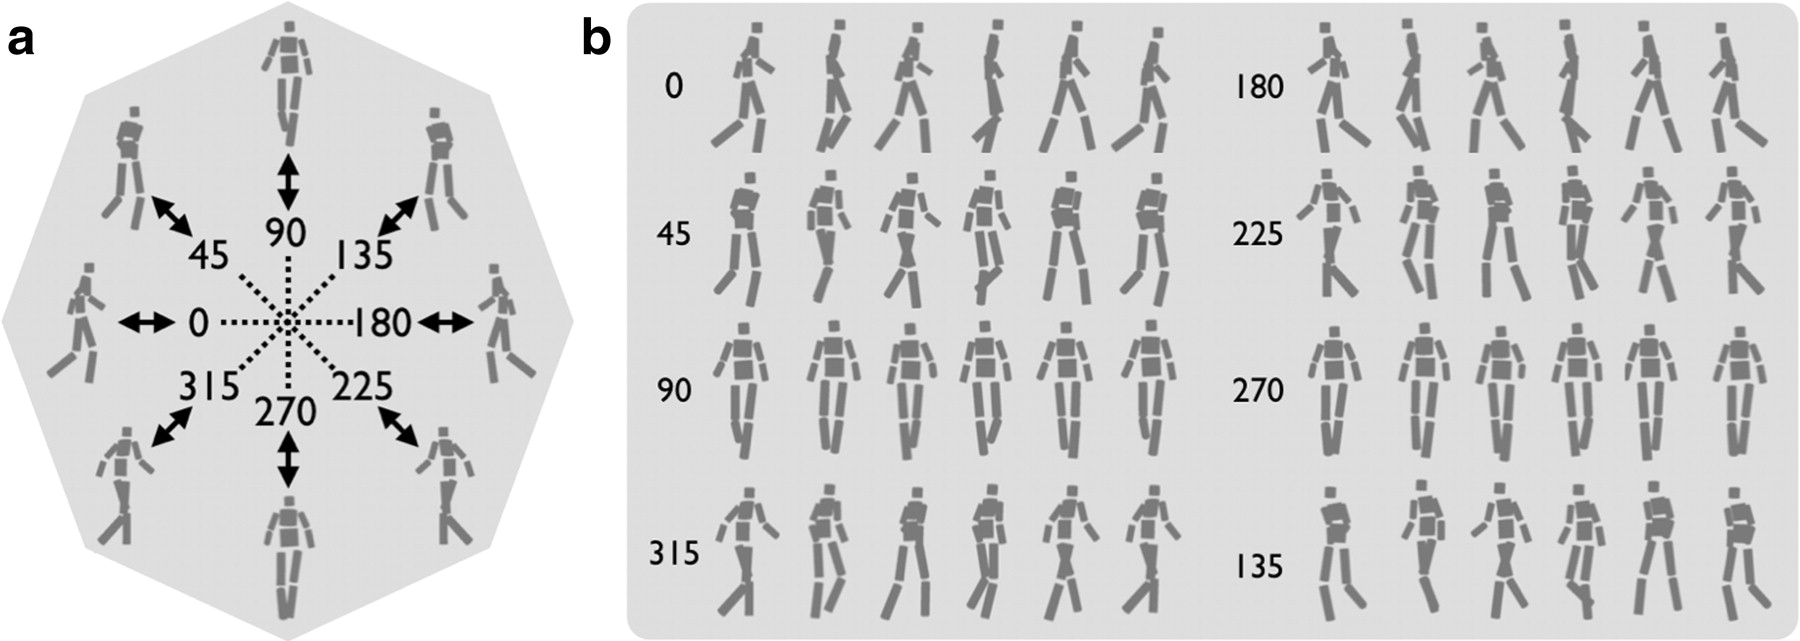
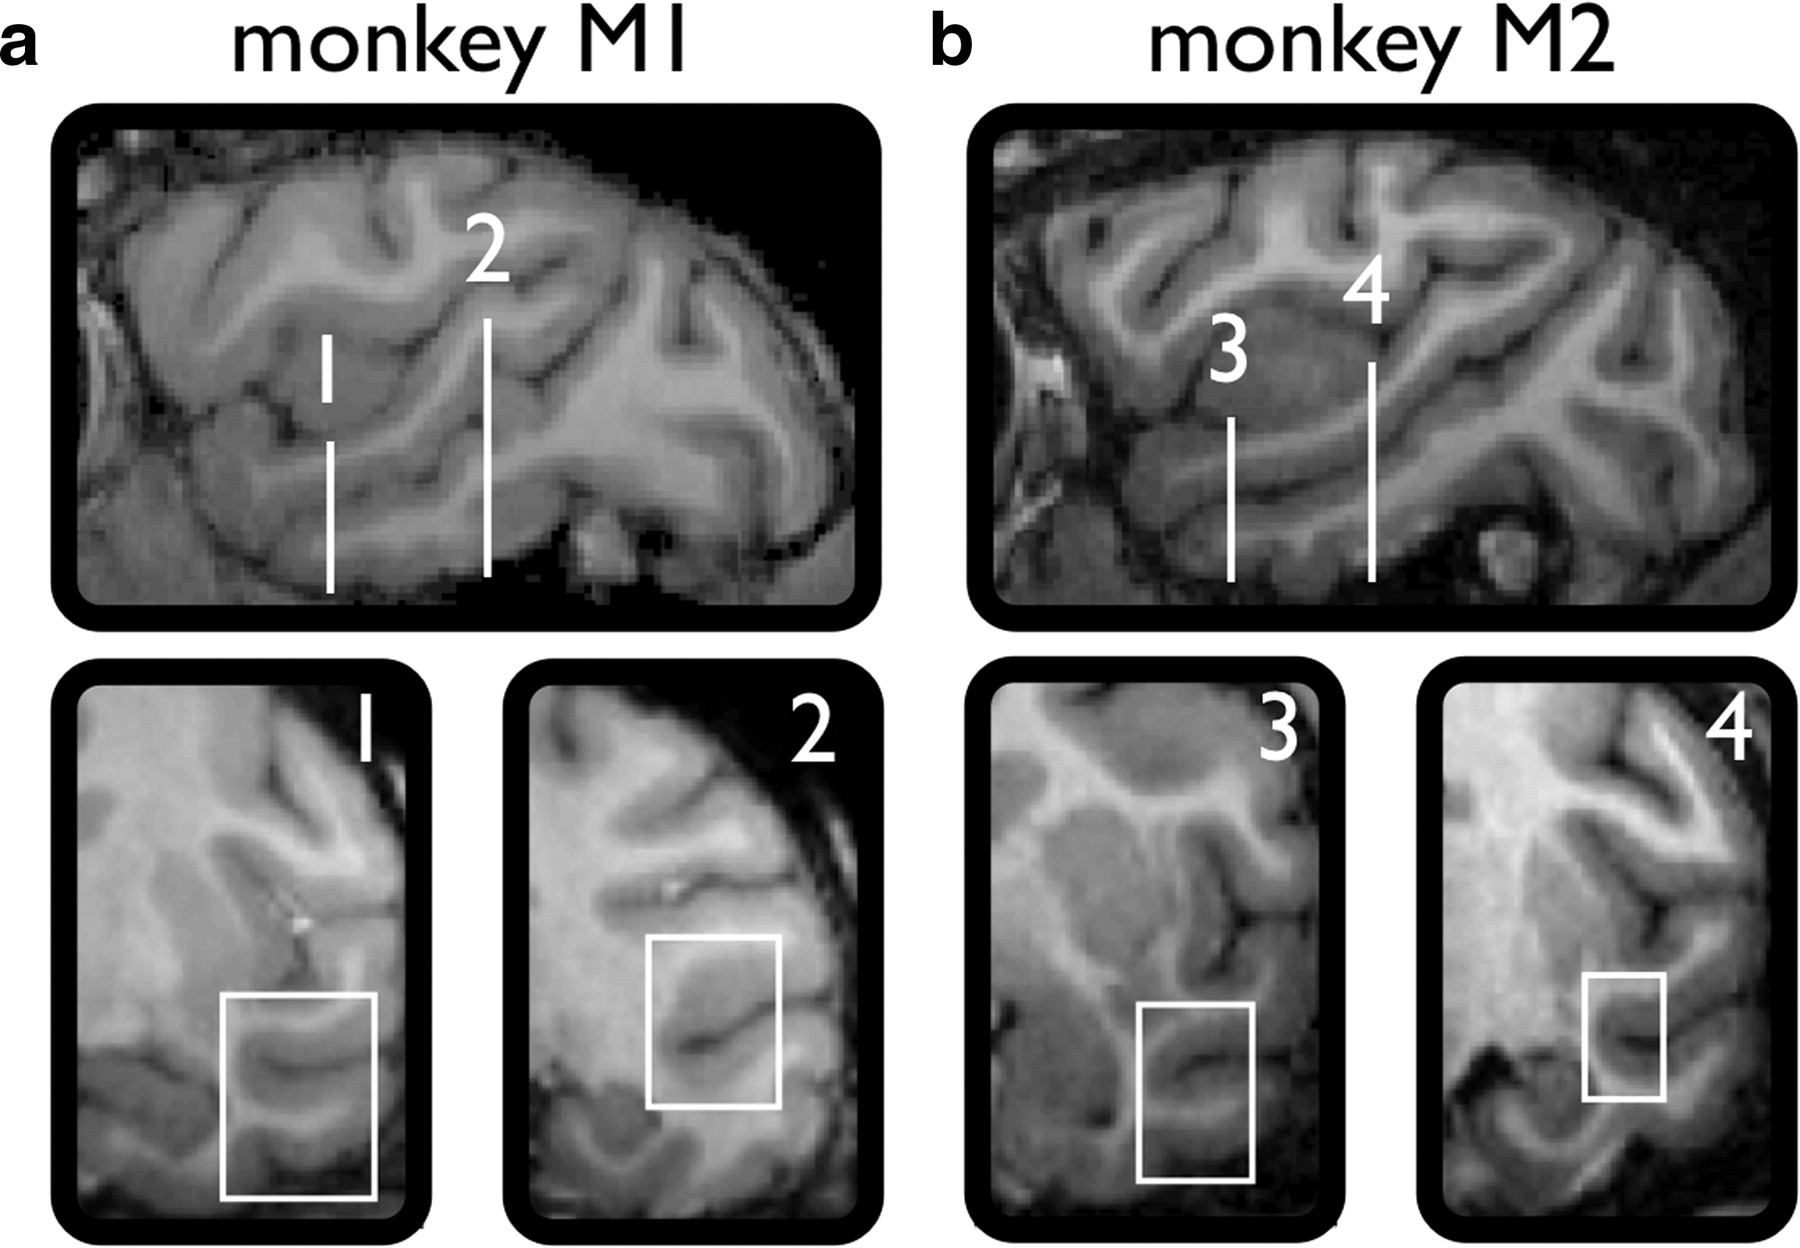
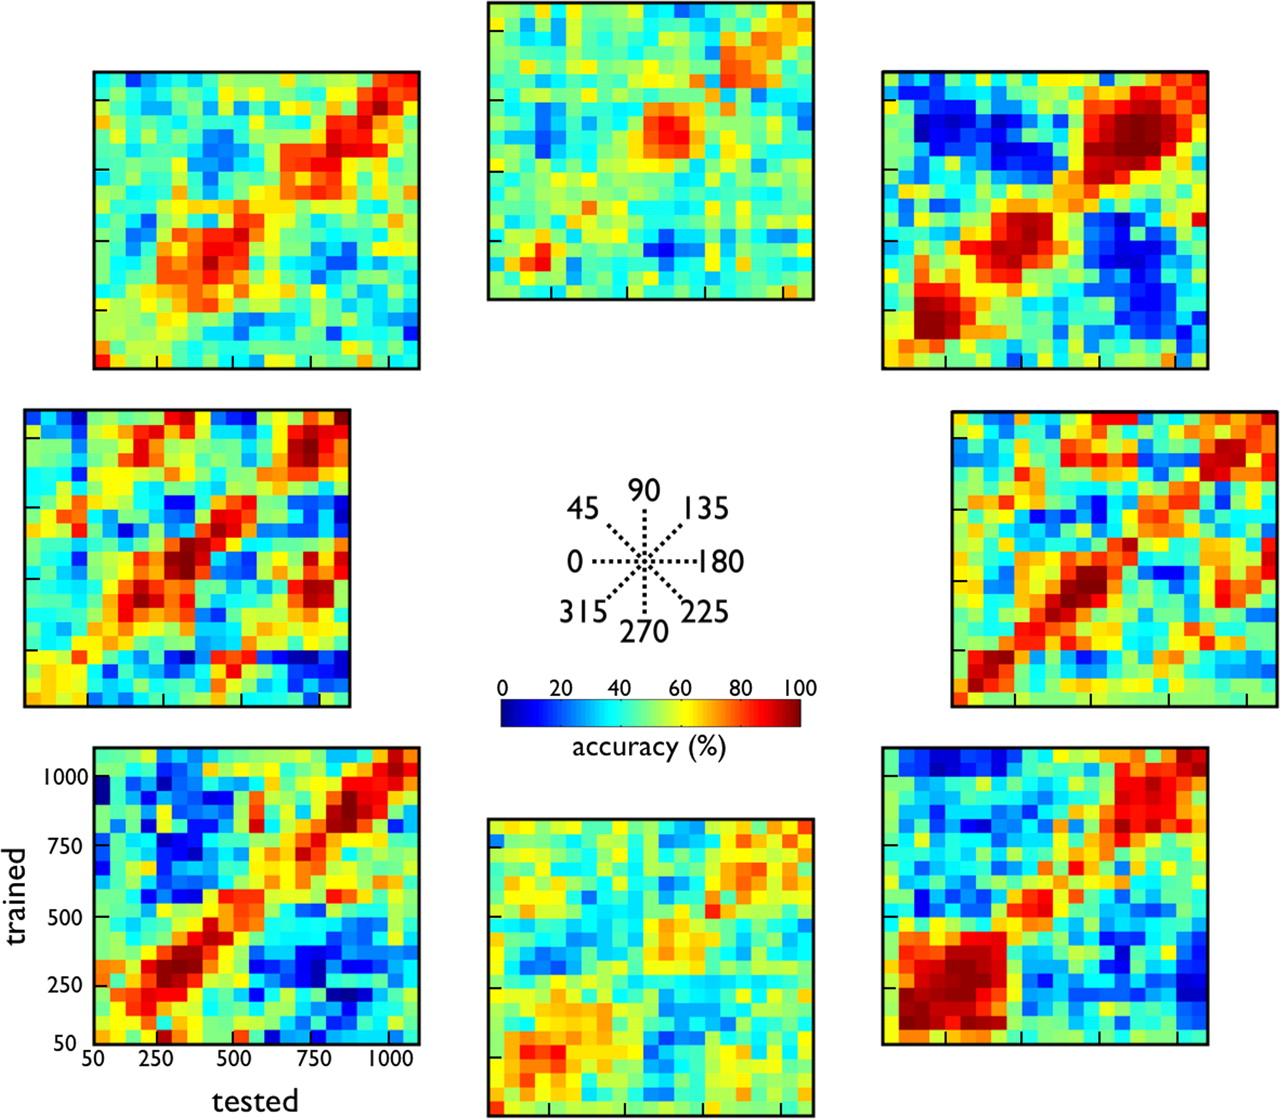