Distributions of Dissolved Toxic Elements During Seasonal Variation in Kuantan River, Pahang, Malaysia
Fikriah Faudzi1, Kamaruzzaman yunus1,2*, Mohdfuad Miskon1, Mokhlesur Rahman3 and Akbar John, B1.
1Kulliyyah of Science Indera Mahkota 2Institue of Oceanography 25200 Kuantan 3Kulliyyah of Pharmacy, International Islamic University Malaysia
DOI : http://dx.doi.org/10.13005/ojc/300210
Article Received on :
Article Accepted on :
Article Published : 12 Apr 2014
The concentrations of toxic metals were determined in estuary and freshwater zones from Kuantan River basin. Water samples were collected from the surface and bottom layers of nine sampling stations, from the downstream of the estuary towards the upstream along the mainstream drainage channel, traversing past the city center and industries of Kuantan city. The general physico-chemical parameters (salinity, temperature, pH and dissolved oxygen) and concentration of total dissolved metals, Cadmium (Cd), Chromium (Cr) and Lead (Pb)were measured during dry season (May and June 2012) and wet season (September and October 2012). Metal concentration was determined using Inductively Coupled Plasma Mass Spectrometry (ICP-MS).Metal concentrations ranged from 0.299 - 1.815µg/Lfor Cr, undetectable to 0.034µg/L for Cd and 4.697 – 16.017µg/L for Pb, respectively. The present measurements can be used as a baseline data for any future monitoring and comparison of trace metals distribution in the Kuantan River.
KEYWORDS:dissolved toxic elements,kuantan river malaysia
Download this article as:| Copy the following to cite this article: Faudzi F, Yunus K, Miskon M, Rahman M, John A, B. Distributions of Dissolved Toxic ElemAents During Seasonal Variation in Kuantan River, Pahang, Malaysia. Orient J Chem 2014;30(2). |
| Copy the following to cite this URL: Faudzi F, Yunus K, Miskon M, Rahman M, John A, B. Distributions of Dissolved Toxic ElemAents During Seasonal Variation in Kuantan River, Pahang, Malaysia. Orient J Chem 2014;30(2). Available from: http://www.orientjchem.org/?p=2922 |
INTRODUCTION
Heavy metals have five times greater mass thanthe water and therefore may produce positive ions in solution. Several metallic elements play an important role in living organisms in fulfilling physiological role and also provide nutritional requisite by activating physiological and biochemical pathways. However, excess of the essential trace elements such as iron and zinc can lead to toxicity symptoms and even death (Naja and Volesky, 2009).It is also noted that some physicochemical parameters such as pH, hardness, alkalinity and organic material load can contributed to the toxicity of heavy metals in aquatic habitat (Govindasamy and Azariah, 1999; Kamaruzzamanet al., 2007; Ong and Kamaruzzaman, 2009). The quality of adjacent water environment affected by virtually anthropogenic activities since nearly 80% of ocean pollution enters from the land through the river (Mahesh Kumar and Prabhahar, 2012; Anieset al., 2011). Gradually, surface water or ground water nearby will accumulate pesticides and fertilizers formerly used by farmers while lakes, rivers and seas were contaminated as the chimneys released the toxic chemicals and toxic substances to the atmosphere that turn into rain causing the water pollution.In Malaysia, the number of polluted river is increasing and the condition is worsening rapidly in recent years. In 2008, out of 186 rivers, about 17 riverswere labelled as toxic and unsafe for human (TengkuYahya, 2008). It is important to carries out an environmental pollution monitoring study tofocus on concentration, distribution and mobility of potentially toxic elements in a tropical environment where the health of flora and fauna may be at risk, at strategic point in natural water bodies, as well as in commercial and industrial locations. There is little or no attention has been paid to the potentially toxic elemental background concentrations of the tropical watersheds in Asia, especially Malaysia compared to the research in watersheds of temperate zones(Sultan et al., 2011).Since Kuantan River basin flows through the city centers, trace metal concentrations in the river waters account for potential concerns of pollution. Research on dissolved metals in river water is scarce due to their trace-level existence and the need for special precautions from sample collection to the analysis process (Hunter and Boyd, 1997). In addition, a better knowledge of trace-metal concentrations in Kuantan River is needed in order to determine the effects and deviations occur during the pre-monsoon and post-monsoon shift.The present study will be crucial for any future monitoring of the distribution of dissolved trace metals in Kuantan River.
MATERIALS AND METHODS
Sampling Sites
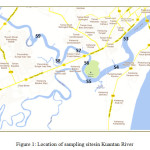 |
Figure 1: Location of sampling sitesin Kuantan River Click here to View Figure |
Kuantan River Basin is located adjacent to the Tanjung Lumpur mangrove in Kuantan District, Pahang, Malaysia. The basin covers an area of 1,586 km2 and is approximately 80 km long. Kuantan River flows through two mukims of Ulu Kuantan and Kuala Kuantan and flowing out to the South China Sea. Surface and bottom water samples were collected from 9 locations (Figure 1) in Kuantan River during the dry season (May 2012 and June 2012) andwet season (September 2012 and October 2012). Water samples were collected using Van-Dorn Water Sampler and were stored in acid-washed polyethylene bottles (1L). Samples were acidified using concentrated HNO3 to preserve the sample and stored in ice during the transportation to the laboratory (APHA, 1998). Concurrently, pysico-chemicalparemeters of the ambient water were measured using YSI Hydrolab multisensory probe.
Analytical Methods for Toxic Metals
All glassware and plastic materials such as plastic bags and polyethylene bottles that were used in the laboratory and during the sampling were thoroughly acid-cleaned with 10% nitric acid (HNO3) to avoid contaminations,following internationally recommended protocols (APHA, 1998).Water samples were filtered immediately through dry pre-weighted Nylon millipore filters (0.45 µm pore size) to separate between dissolved and suspended particulate matter (SPM) fractions using a low-pressure vacuum pump (Beltrameet al., 2008). The extraction of dissolved metals from filtered water samples were performed by chelation with Chelex-100 in a laminar flow hood. Then, with an aid of peristaltic pump, filtered water were passed through the teflon tubing with Chelex-100.The Chelex-100 column was washed with ammonium acetate in order to obtain an almost matrix-free solution.The recovery test was also conducted through the spiking method analysis and the percentage of recovery ranged from 95% to 105%. The toxic elements in the water samples were detected using Inductively Coupled Plasma Mass Spectrometry (ICP-MS).
Analysis of variance (ANOVA) test was performed to determine the significant variation between metal concentration during pre and post monsoon period. Pearson correlation analysis was used to determine the significant influence of water quality parameters on the metal concentration in water samples. Data were expressed in Mean±SD. All statistical tests were performed using SPSS 21v.
RESULTS AND DISCUSSION
Gradual decrease in salinity was observed from downstream of the estuary to the upstream with the range of 3.70 to 35.89 ppt. Higher salinity was recorded during the dry season.pH of the river water ranged from 6.81 to 8.97. Water temperature varied between 27.49and30.78 °C, with the lowest temperature measured during dry season. DO concentrations varied between 4.65 and 7.67 mg/L. It was also interesting to observe that the pH influenced other parameters such as electrical conductivity and salinity (excluding DO). The electrical conductivity and salinity increase with an increasing pH value, while the DO values decreased.
Summary statistic of concentrations of Cd, Cr and Pb during the dry season (May-June 2012) and wet season (September-October 2012) at the surface and bottom water samples of Kuantan River basin is depicted in Table 1. In general, the toxic metal concentrations in waters were found to be increased in the sequence of Pb>Cr>Cd. Throughout the period of study, the highest concentration of Cd were recorded in the wet season whereas the lowest concentration of Cd was found in dry season (Figure 2). Meanwhile, Cr and Pb showed an opposite pattern and were higher in the dry season and lower in the wet season.
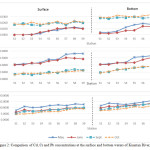 |
Figure 2: Comparison of Cd, Cr and Pb concentrations at the surface and bottom waters of Kuantan River, Pahang |
Overall, metals concentration was lower at the surface layer and higher at the bottom layer (Table 1). Highest mean concentration of Cd was recorded in September 2012 with 0.020 ± 0.002 µg/L and 0.031 ± 0.002 µg/L at the surface and bottom layers, respectively. Whereas the lowest mean concentration of Cd was found both in May and June 2012 at the surface layer with the value of 0.006 ± 0.005 µg/L and 0.009 ± 0.006 µg/L (in June 2012) bottom waters. No water sample measured Cd concentrations exceeding the INWQS Class II benchmark of 10 µg/L. Concentration Cdmeasured in this study is lowerthan the value observed in Yamuna River (4.2 µg/L – 17.3 µg/L ) in the wet season (Ali and Jain, 2001).
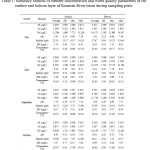 |
Table 1: Summary statistic of element concentration and water quality parameters at the surface and bottom layer of Kuantan River basin during sampling perio Click here to View table |
At the surface waters, the highest mean concentration of Cr was in May 2012 with value of 1.399 ± 0.321 µg/L, while the lowest mean concentration of Cr was in September 2012 with the value of 0.481 ± 0.140 µg/L. Similarly, at the bottom waters, the highest mean concentration was found in May 2012 with the value of1.405 ± 0.280 µg/L, while the lowest mean concentration of Cr was found in September 2012 with the value of 0.789 ± 0.214 µg/L.
Pb recorded the highest mean concentration in May 2012 with value of 11.294 ± 1.699 µg/L and 14.175 ± 1.582 µg/L at the surface and bottom layer, respectively. Whereas the lowest mean concentration of Pb was recorded in October 2012 with 6.808 ± 1.713µg/L at the surface and 10.139 ± 1.755 µg/L at bottom layer. The highest concentration of Pb was found at Station 9 with 13.224 µg/L and 16.003 µg/L at surface and bottom layer of May 2012, respectively. No water sample registered Pb concentrations exceeding the INWQS Class II (DOE, 2010) value of 50 µg/L. Rajan, et al. (2012) reported a higher average with 100 µg/L of Pb concentration in Tembeling River and also found the Pb concentrations was higher in the dry season. Jain (2001) suggested that higher contents of metal ions may be due to flushing out of the effluent discharge from various industrial units through surface runoff after the monsoon season. Meanwhile, dissolved Cr and Pb exhibited lower concentration in the wet season particularly in October 2012 may due to dilution after the precipitation events.The temporal patterns of Cr and Pb wassimilar with both concentration were consistently increased with the distance from downstream of the estuary to the upstream along the flow path. (Figure 1).
It was noted that with the increase in salinity, the concentrations of Cr and Pb decreased from upstream towards the downstream. The decrease in the metal concentrations with salinity shows contribution from fresh water sources and physical mixing is one of the important factor to regulate the dissolve concentrations (Rahman et al., 2012). Moreover, during the low water volume periods (i.e. less turbulence state of the water body), dissolved metals tend to bound to sediments. Sediments are re-suspended when water turbulence increases and metals will dissolved in the water again (Rajanet al., 2012). Dissolved Cd showed a multifold increasing and higher concentrations in the wet season. Meanwhile, in the dry season, Cd trends were gradually increased during the high tide whilst marginally increased during the low tide, parallel to the decreasing salinity. Cd concentrations did not show a systematic change with the flow path from the upstream to the downstream river mouth during the dry season, revealing heterogeneity in sources and/or hydro chemical behavior. Sultan et al (2011) explained this as a result of reducing alkaline conditions (i.e. low Eh-high pH) in the river favoring the dissolution of Cd, but mildly acidic river water under oxidizing conditions favoring precipitation / adsorption of Cd possibly onto secondary oxides of Fe, Al and Mn (Jain, 2011).
The concentration of metals in dissolved phase may increase due to the competition between chlorine ion and metals ion to bind on the suspended particulate surface. Hence, Cd bound to suspended matter is desorbed when river water mixes with the seawater due to the formation of Cd – chlorocomplexes and desorption higher in waters with high salinity (Sultan et al., 2011). Apart from natural weathering process, Cd probably may cause leaching from Ni-Cd based batteries (Hutton et al., 1987), leaching from landfill or soil, wash off process from roof surface and discharge from metal and fertilizer industries (WHO, 2006). ANOVA test showed significant variation in metal concentration in waters between pre and post monsoon (P<0.001) exceptPb (seasonally) and As (spatially). Result of Pearson correlation show more elements were strongly correlated during pre-monsoon months than post-monsoon months.
CONCLUSION
The concentrations of the evaluated heavy metals were within the guideline levels for freshwaters, and did not appear to have significant negative impact on the water quality. Regular monitoring programs must be conducted to obtain reliable water quality data in the hydrochemistry of rivers for spatial and temporal variations. Therefore, in order to keep river water safe from pollution, it takes ample of time to establish the records and knowledge of the pollution processes and predispositions. Further investigation is crucial for implementing effective rules to protect the Kuantan River which is noted to be one of the busiest water body in Malaysia.
ACKNOWLEDGEMENT
The author thanks the Malaysian Ministry of Science, Technology and Innovation for providing financial support under the e-Science fund Ref No. 04-01-08SF0103 and also appreciation to the lab assistant of the Oceanography laboratory teams of IIUM for their treasured assistance and hospitality throughout the sampling period.
REFERENCES
- Ali, I. and C. K. Jain; (2001), Pollution Potential of Toxic Metals in the Yamuna River at Delhi India. Journal of Environmental Hydrology, Volume 9. Pp12
- Anies, A. S., Kamaruzzaman, B. Y., Akbar John, B. (2011). Water sampling techniques. In Normawaty Mohammad Noor (Ed.). Basic knowledge in marine sciences. (pp 158-162). IIUM Press. ISBN 9789674181994.
- APHA- Awwa- Wef, 1998. In: Clesceri, L.S., Greenberg, A.E., Eaton A.D. (Eds.), Standard Methods for the Examination ofWaterandWastewater. 20th Edition, American Public Health Association, Washington. 1200 pp
- Beltrame, M.O., De Marco, S., Marcovecchio, J., 2008. Cadmium and zinc in Mar Chiquita coastal lagoon (Argentina): salinity effects on lethal toxicity in juveniles of the burrowing crab Chasmagnathusgranulatus. Archives of Environ- mental Contamination and Toxicology 55, 78–85
- Govindasamy, C. and Azariah, J. 1999. Seasonal variation of heavy metals in coastal water of the Coramandal coast. Bay of Bengal, India. J. Mar. Sci. 28: 249-256.
- Hunter, K. A. and Boyd, P. (1997). Has trace metal marine biogeochemistry come of age? In R.B Macaskill (Ed.), Proceedings of the trace element group of New Zealand. Waikato University.
- Hutton. M., Chaney. R.L., Krishna. C.R., Murti. M., Olade. A and Page. A.L. (1987) Group Report In: Hutchinson TC and Meema KM (eds.) Lead, Mercury, Cadmium and Arsenic in the Environment. John Wiley, New York. 35-41
- Kamaruzzaman, B. Y., Noor Azhar, M. S., Norhizam, H. A. G. and Willison, K. Y. S. (2007). The Temporal Variation of Organic Carbon during the Pre-monsoon and Post-monsoon Season in Pahang Coastal Water, Malaysia. Journal of Chemistry. Vol. 23(2), 409-414.
- Naja, G. M., & Volesky, B. (2009). Toxicity and Sources of Pb, Cd, Hg, Cr, As, and Radionuclides in the Environment, 13–62.
- Ong, M. C. and Kamaruzzaman, B. Y. (2009). An assessment of metals (Pb and Cu) contamination in bottom sediment from South China Sea Coastal waters, Malaysia. American Journal of Applied Science 6(7), 1418 – 1423.
- Rahman, M. M., Fikria, A. F., Kamaruzzaman, B. Y. and Wan Nik, W. B. (2012). Distribution of trace metals in pore water along Terengganu beach. Australian Journal of Basic and Applied Sciences, 6 (7), 213 – 217.
- Rajan, S., Nadiah, N., Firdaus, M., Appukutty, M., & Rama-, K. (2012). Effects of climate changes on dissolved heavy metal concentrations among recreational park tributaries in Pahang, Malaysia ., 23(1), 23–30.
- Sultan, K. Shazili, N.A. Peiffer, S. 2011. Distribution of Pb, As, Cd, Sn and Hg in soil, sediment and surface water of the tropical river watershed, Terengganu (Malaysia). Journal of Hydro-environment Research 5 (2011) 169-176.
- TengkuYahyaT. F. (2008).River Management System: Yes to Kg/Day, No to Mg/L WHO, 2006. Guidelines for Drinking-Water Quality. First Addendum to Third Edition, vol. 1. World Health Organization, Geneva.

This work is licensed under a Creative Commons Attribution 4.0 International License.
![]()
A New Edition of Web of Science
Journal Impact Factor
2022: 0.5
Five Year: 0.8
Journal is Indexed in

Cabells Whitelist
![]()


