Quantitative Determination of HIV-Antiviral Agent Using Complexing Reagent in Bulk Material and Formulations
Thuttagunta Manikya Sastry1*, Karripeddi Ramakrishna2 Kotturu Venkata Lavanya3 and Kallempudi Siva Iva Prasad4
1Department of Chemistry, G V P College of Engineering (Autonomous), Madhurwada, Visakhapatnam-530048, A.P, India 2Department of Chemistry, GITAM University, Rushikonda, Visakhapatnam-530045, A.P, India
3Department of Humanities and Basic Sciences, Chaitanya Engineering College, Kommadi Junction, Visakhapatnam -530048, A.P, India
4Department of Basic Sciences and Humanities, Vignan’s Institute of Information Technology, Duvvada, Visakhapatnam - 530 049, India.DOI : http://dx.doi.org/10.13005/ojc/300144
Article Received on :
Article Accepted on :
Article Published : 05 Mar 2014
A sensitive visible spectrophotometric method was developed for quantitative determination of Antiviral [Abacavir sulphate (AVS)] agent against HIV in bulk material and dosage forms. An extraction spectrophotometric method for the assay of abacavir sulphate is based on the formation of colored co-ordination complex with cobalt thiocyanate (CTC) which can be extractable in nitrobenzene (lmax=620 nm) is described. Beer's law limits and Molar absorptivity values were found to be 10 – 50 mg mL-1 and 9.58 x 10³ L mol-1cm-1 respectively. The limit of detection and limit of quantification values are found to be 3.07 x 10⁻¹ µg mL-1 and 9.3 x 10⁻¹ µg mL-1 respectively. Precision and accuracy of the developed method was evaluated. The results are validated statistically and compared with reported methods.
KEYWORDS:Spectrophotometry; Abacavir sulphate; Ziagen Nitrobenzene; Cobalt thiocyanate (CTC) and dosage forms
Download this article as:| Copy the following to cite this article: Sastry M. T, Ramakrishna K, Lavanya K. V, Prasad K.S.I . Quantitative Determination of HIV-Antiviral Agent Using Complexing Reagent in Bulk Material and Formulations. Orient J Chem 2014;30(1) |
| Copy the following to cite this URL: Sastry M. T, Ramakrishna K, Lavanya K. V, Prasad K.S.I . Quantitative Determination of HIV-Antiviral Agent Using Complexing Reagent in Bulk Material and Formulations. Orient J Chem 2014;30(1). Available from: http://www.orientjchem.org/?p=2324 |
Introduction
Abacavir is an antiviral agent which is carbocyclic synthetic nucleoside analogue with inhibitory activity against HIV. The chemical name of Abacavir sulphate is: [(1S, 4R) – 4 – [2 – Amino – 6 – (cyclopropylamino) – 9H – purin – 9 – yl] – 2 -cyclopentene-1-methanol sulphate (salt) (2:1)] (Fig. 1). In literature, a number of analytical methods have been described for estimation of AVS including Electrochemical determination1, HPLC 2,3, LC4,5 and LC-MS6,7, and UV 8,9 methods. But, relatively little attention has been paid in developing visible spectrophotometric methods10-13.The analytically important functional groups in AVS have not been exploited properly so far and hence there is a need to develop sensitive and flexible visible spectrophotometric methods. So authors have made some attempts in this direction and succeeded in developing more accurate, reliable and economical analytical method using cobalt thocyanate (CTC) for quantitative determination of AVS in bulk material and formulations.
EXPERIMENTAL PROCEDURE
Instrumentation
The measurements were made on a SL-177 model (Elico, India) visible spectrophotometer with 1 cm glass cells and on a UNICAM UV 500 spectrophotometer (Thermo Electron Corporation, UK). All pH measurements were made using a LI 120 digital pH meter (Elico, India).
Reagents and materials
All the reagents were of analytical grade and all solutions were prepared in double distilled water. Aqueous solutions of CTC (BDH; 2.5 x 10⁻¹M), buffer solution (PH=2.0). and Nitrobenzene (Qualigens) solvent are used. The bulk drug Abacavir sulphate (Ranbaxy laboratories Ltd., India) was selected for the study. Formulation, Ziagen (Glaxo- welcome Inc., India) containing Abacavir sulphate was purchased from local commercial sources. Tablets equivalent to 300 mg of different batches were selected for this study.
Standard drug solution
The free base solution (mg mL-1) was prepared by mixing 100 mg of bulk drug with 10.0 ml of 10% Na2CO3 solution. The resulting solution was taken into a 150 ml separating funnel and extracted with 3 x 25 mL portions of chloroform and combined chloroform layer was brought up to 100 mL with the same solvent. A portion of the above free base stock (mg mL-1) solution was further diluted stepwise with the same solvent to obtain working standard solution of 100 mg mL-1
Analytical procedure
Aliquots of standard drug (free base form) solution (1.0 – 5.0 mL; 100 mg mL-1), were delivered into series of calibrated tubes and solvent was completely removed by gentle heating on a boiling water bath. To the residue in each tube, 2.0 ml of buffer (pH 2.0) and 5.0 mL of 2.5 x 10⁻¹M CTC solutions were added. The total volume of aqueous phase in each separating funnel was adjusted to 15.0 mL with distilled water. These solutions in the test tubes were transferred to 125 mL separating funnels. To each separating funnel 10.0 mL of nitrobenzene was added and the contents were shaken for 2 min. The two phases were allowed to separate and the absorbances of the separated nitrobenzene layer were measured at 620nm against a similar reagent blank after 10 min. The amount of drug (AVS) was deduced from its calibration curve. (Figure 2)
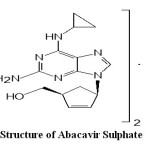 |
Fig.1: Structure of Abacavir Sulphate Click here to View Figure |
Pharmaceutical formulations
Since only one formulation is available (Tablets), four different batches of this formulation were collected and analyzed as 4 sets to verify the validity of proposed methods. Accurately weighed quantity of tablet powder equivalent to 100 mg of AVS was extracted with methanol (3 x 25.0 mL portions) and filtered. The volume of combined extract was evaporated to dryness. The residue was used to prepare free base stock solution (mg mL-1) and working standard solution of concentration 100 mg mL-1 as described in the standard drug solution. UV spectrophotometric method which was suggested for the identification of drug has been moulded for its assay and chosen as the reference method for ascertaining the accuracy of the proposed method.
RESULTS AND DISCUSSION
Optimization of reaction conditions
Optimum conditions for the proposed method were established by varying one parameter at a time and keeping the others fixed and observing the effect produced on the absorbance of the colored species. The effects of various parameters such as buffer solution, concentration of the CTC, organic solvent used for extraction, ratio of organic phase to aqueous phase during extraction, stability period and intensity of colored species were studied.The optimum conditions were as follows: 4.5-6.5 mL (1.1 – 1.6 × 10 -1 mol L-1) of CTC solution, 1.5-2.5 mL (1.5 -2.5 × 10 -2 mol L-1) of buffer solution (PH2.0), 1-4 min. of shaking time ,the ratio of aqueous to organic phase on extraction is 3:2 were found to be optimal. In the procedure, 5.0 mL of (1.3 × 10 -3 mol L-1) CTC, 2.0 mL (2.0 × 10 -2 mol L-1) buffer solution and 2 min. shaking period required for maximum color development were found to be optimum conditions. Nitrobenzene was preferred for its selective extraction of the complex from the aqueous phase. The ratio of aqueous to organic phase on extraction was taken as 3:2. The colored species were stable for 40 min. The λmax (nm) and εmax(Lmol-1cm-1) values were found to be 620 and 9.589 ´ 103 .
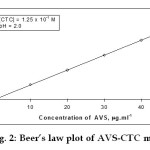 |
Fig. 2: Beer’s law plot of AVS-CTC method Click here to View Figure |
Absorption spectrum
For the selection of analytical wavelength, 100 mg.ml-1 solution of abacavir sulphate was prepared by appropriate dilution of standard stock solution and scanned in the spectrum mode from 800nm – 400 nm. The spectrum of the colored species produced by the suggested procedure is shown to possess maximum absorbance at 620nm which was selected for the analysis (Fig.2). The calibration curve was prepared in the concentration range of 10-50 mg mL-1 at 620nm. By using the calibration curve (Fig.3), the concentration of the sample solution can be determined. The linearity was found in the concentration range of 10-50 mg mL-1 as shown in the Figure 2
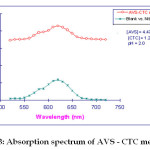 |
Fig. 3: Absorption spectrum of AVS – CTC method Click here to View Figure |
Mechanism of Reaction
The coloured species formed can be regarded as a co-ordinate complex of the drug (electron donor) and the central metal atom of cobalt thiocyanate (electron acceptor) which is extractable into nitrobenzene from aqueous solution Formation of the blue coloured complex when AVS is treated with CTC due to the presence of aliphatic secondary group is the basis in the present investigation. It was observed that the drug (AVS), Cobalt and thiocyanate were in the ratio of 2:1:4 in the complex. The probable sequence of reactions based on analogy in previous work14, 15 is presented in Scheme.
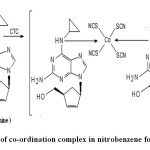 |
Scheme- Extraction of co-ordination complex in nitrobenzene for abacavir sulphate Click here to View Scheme |
Method of validation
The developed method was validated as per ICH guidelines16 for its linearity, precision, and accuracy, limit of detection and limit of quantification. Regression analysis using the method of least square was made to evaluate the slope (b), intercept (a), and correlation coefficient(R) obtained from different concentrations of drug. The result of slope (1.43 x 10⁻²) and intercept (1.2 x 10⁻³) of drug by the proposed method was given in Table 2.
Table-2 Regression parameters of proposed method
| Regression parameter |
CTC Method
|
| Regression equation (Y = a + bC)* |
Y = 0.00143 C+ 0.0012 |
| Slope (b) |
1.43 x 10² |
| Standard Deviation on slope (Sb) |
4.0 x 10⁵ |
| Intercept (a) |
-1.2 x 10⁻³ |
| Standard Deviation on intercept (Sa) |
1.33 x 10³ |
| Correlation coefficient (r) |
0.9999 |
Linearity
Linearity was found in the concentration range 10–50 µg mL–1. Beer’s law plots (n = 6) were linear with a correlation coefficient of 0.9999 (Table 2)
Limit of detection (LOD) and limit of quantification (LOQ)
Limit of detection (LOD) and limit of quantification (LOQ) were established according to ICH guidelines and determined by using the formula LOD = K.SDa / b where K= 3.3 for LOD and and 10 for LOQ. SDa is the standard deviation of the intercept and b is the slope of the calibration line.LOD and LOQ were found to be as low as 3.07 x 10⁻¹ µg mL-1 and 9.3 x 10⁻¹ µg mL-1 respectively. The results are presented in
Table-1 Optical characteristics of the proposed method
|
Name of the parameter |
CTC Method
|
| lmax (nm) |
620 |
| Beer’s Law limits) (mg /ml) |
10 – 50 |
| Molar absorptivity (L mol-1cm-1) |
9.58 x 10³ |
| Sandell’s sensitivity (mg /cm2/0.001Absorbance unit) |
6.99 x 10² |
| Limit of detection(mg/ml ) |
3.07 x 10⁻¹ |
| Limit of quantification (mg /ml ) |
9.3 x 10⁻¹ |
Precision
The repeatability of the proposed method was studied by repeating the method six times (n = 6).To study intra-day precision, the method was repeated six times a day. Similarly, the method was repeated on six consecutive days to determine inter-day precision. The results are summarized in Table 3.
Table-3 Evaluation of precision and accuracy of proposed method
| Precession and accuracy parameter |
CTC Method |
| Precision (RSD)a | |
| Intra-day reproducibility (RSD, %) |
0.55 |
| Inter-day reproducibility (RSD, %) |
0.44 |
| % range of error b | |
| Confidence limit at 0.05 level (95 %) |
± 0.58 |
| Confidence limit at 0.01 level (99 %) |
± 0.91 |
Accuracy
The accuracy of the method was determined in terms of % recovery of AVS standard. Recovery studies were carried out by addition of standard drug solution at three different levels (8, 10, 12 µg mL-1) to previously analyzed sample (tablet) solution. Values of recovery ± SD were found to be in the range of 99. 7 + 0.7 -100.2 + 1.2 (n=3).The results are given in Table 4.
Table-4 Rrecovery studies by standard addition method
|
Proposed method |
Formulation Taken (A) ((mg ml-1) |
Pure drug added (B) (mg ml-1) |
Total drug con. (A+B) ((mg ml-1) |
% Recoverya ± SD Ziagen
|
|
CTC |
10 |
8 |
18 |
100.2 + 1.2 |
| CTC |
10 |
10 |
20 |
99.9 + 0.7 |
| CTC |
10 |
12 |
22 |
100.1 + 1.5
|
Selectivity studies
The extents of interference by various excipients that often accompany pharmaceutical formulations are tabulated in Table-6. To study the interference, 100 mg mL-1 of AVS was taken and a known amount of the interfering substance was added and the reaction was carried out as described under general procedure. The interference studies were carried out by repeating the method five times. The results showed the same absorbance as that of pure AVS. The high percentage of recovery showed that excipients did not interfere with the proposed method and the results are presented in Table 5.
Table-5 Assay of AVS in the presence of excipients a
| Excipient |
Concentration (mg mL–1) |
Recovery (%)a,b |
|
Colloidal silicon dioxide |
3.0 |
99.9 ± 0.6 |
|
Magnesium sterate |
4.0 |
99.8 ± 0.5 |
|
Microcrystalline cellulose |
3.0 |
99.8 ± 0.2 |
|
Sodium starch glycolate |
5.0 |
100.3 ± 0.4 |
Application of the proposed method
The application of the proposed method for the assay of pharmaceutical formulations was examined for tablets and the results were statistically compared with those obtained by UV reference method. The results obtained by the proposed and UV reference method for the
formulations were compared by means of Student’s t-test and F- test and it was found that the proposed method do not to differ significantly in precision and accuracy. The results are summarized in Table 6.
Table -6 Assay of AVS in pharmaceutical formulations
|
Formu- Lations
Tablet |
Labelled Amount (mg) |
Amount found by proposed methods (mg)a,b CTCMethod |
F-test value |
t-test value |
Reference Methodc |
% Recovery by proposed methodsd CTC Method
|
|
Ziagen (Batch-I) |
300 |
301.5+2.8
|
1.02 |
0.88 |
298.9 + 2.8 |
100.5+ 0.9 |
|
Ziagen (Batch-II) |
300 |
299.2+ 2.9
|
2.73 |
2.12 |
300.6+1.8 |
99.7+ 0.96 |
|
Ziagen (Batch-III) |
300 |
298.8+ 2.8
|
3.58 |
0.47 |
299.4+ 1.5 |
99.66 + 0.92 |
|
Ziagen (Batch-IV) |
300 |
300.7+ 4.9
|
4.71 |
0.25 |
299.7+ 2.2 |
100.2+ 1.6 |
The results obtained by the proposed method are compared with reported methods12 and found to be more sensitive in the range of 10-50 mg mL-1 with εmax value 9.58× 10³ L mol-1cm-1. .Other analytical parameters like limit of detection (LOD) and limit of quantification (LOQ) were also be evaluated for proposed method but not available in reported methods. The advantage of proposed method is that it requires less expensive equipment, low cost reagents and also free from stringent conditional procedures. The results are given in Table 7.
Table-7 Comparison of proposed method with reported methods for Abacavir sulphate
|
Reagents used |
lmax (nm) |
Beer’s Law Limits (mg ml-1 )
|
Correlation coefficient (r) |
Molar absorptivity (l mol-1cm-1) |
LOD µg mL-1 |
LOQ µg mL-1 |
Reference |
| F.C | 752 | 25-150 | 0.9977 | 1.47 x 10³ |
NA |
NA |
12 |
|
MBTH/Fe(III) |
665 | 50-300 | 0.9999 | .455 x 103 |
NA |
NA |
12 |
| PDAC | 463 | 25-150 | 0.9999 | 1.76 x 10³ |
NA |
NA |
12 |
| CTC | 620 | 10-50 | 0.9999 | 9.58 x 10³ | 3.07x 10⁻¹ |
9.3 x 10⁻¹ |
Present paper |
CONCLUTIONS
In the present study abacavir sulphate was determined successfully as pure compound as well as in formulations by exploiting specific functional group present. The proposed method is sensitive, accurate and precise enough to be successfully adopted as an alternative method of GLC or HPLC technique for routine analysis and also in quality control laboratories for quantitative determination of drugs both in bulk material and dosage forms without interference from excipients and additives.
ACKNOWLEDGEMENTS
One of the authors (TMS) is thankful to the Management of Gayatri Vidya Parishad College of Engineering (Autonomous), Visakhapatnam for providing facilities
REFERENCES
- Dogan B, Uslu B, Ozkan SA & Zuman P, Anal Chem, 80, 209(2008).
- Shanta Kumari A, Prakash K, Nagoji KEV & Rao MEB , Asian J Chem, 19, 3412(2007)
- Seshachalam U, Haribabu B& Chandrasekhar KB, J of Separation Sci, 30(1), 28 (2007).
- Mistri HN, Shrivastav P, Jangid AG & Sanyal M, Anal. Lett, 40(6), 1147(2007)
- Sudha T, Ravikumar VR & Hemalatha PV, Int. J of Pharm and Biomed Res., 1(4), 108 (2010).
- Raviolo MA, Breva IC & Esteve-Romero J, J o f Chromatography A, 1216(16) ,3546 (2009) .
- Rao RN, Vali RM, Ramachandra B & Raju SS, J of Pharm and Biomed Anal, 54(2), 279 (2011)
- Surya Rao S, Imran K, Srujana Divya G, Manikantha Kumar J, Thejonadh K & Kishore G, Archives of Applied Sci. Res, 2 (3),
23(2010) . - Sudha T, Saminathan J, Anusha K, Keerthi M, Bhargavi Y& Ganesan V, J Chem Pharm Res, 2(5), 45 (2010).
- Appala Raju N, Venkateswara Rao J, Vanitha Prakash K & Mukkanti K, E-J of Chemistry, 5(3) 511 (2008).
- Venkatamahesh R & Dhachinamoorthi D, Int J of Pharm Tech Res, l.3 (1), 356 (2011).
- Gowrisankar D, Prakash S & Raju S A, Int J of Chem Sci, 5(2), 2379 (2007) .
- Prasada Rao CH, Seshagiri Rao JVLN, Dhachinamoorthi D, Lakshmi Aswini G & Ashok K, Res J of Pharm and Tech,
4(2) ,234(2011). - Sastry C S P, Lingeswara Rao J S V M & Rama Rao K, Talanta, 42, 199 (1979).
- Adelusi S A & Oneyekweli A O, Pak. J. Sci. Ind. Res., 39 22 (1996).
- International Conference on Harmonization of Technical Requirements for Registration of Pharmaceuticals for Human Use, ICH Harmonized Tripartite Guideline, Text and Methodology on Validation of Analytical Procedures, Q2 (R1) 2005.

This work is licensed under a Creative Commons Attribution 4.0 International License.
![]()
A New Edition of Web of Science
Journal Impact Factor
2022: 0.5
Five Year: 0.8
Journal is Indexed in

Cabells Whitelist
![]()


