Keywords
Demand, willingness to pay, WTP, nutrition counseling services
This article is included in the Agriculture, Food and Nutrition gateway.
Demand, willingness to pay, WTP, nutrition counseling services
We have added another co-author for this paper. Dr. Quynh Le has been involved in the conceptualisation and design of the study, supervising data collection and commenting on the manuscript. After our previous submission, Dr. Quynh Le raised comments and conducted further statistical analyses that confirm the validity of the models we presented in the study. We had some discussions and reached consensus on the results. All authors acknowledged her contributions and would suggest that Dr. Quynh Le should be included as a co-author of the manuscript.
See the authors' detailed response to the review by Wongsa Laohasiriwong
In recent years, Vietnam has achieved a significant improvement in people’s health and nutritional status1. This is indicated by an improvement in people’s knowledge, attitude and practice on nutrition, and a significant decrease in malnutrition rates among children. According to the National Institute of Nutrition, the rate of marasmus and stunting has been reduced from 19.9% (2013) to 14.1% (2015) and 32.6% (2013) to 24.6% (2015), respectively1. However, in urban areas, significant increases in overweight and obesity rates may result in high burden of non-communicable diseases (NCDs)2. A survey among 17,213 people in Vietnam showed that the rate of overweight and obesity was 16.3%. This high rate was fueled by unhealthy diet habits, alcohol abuse and sedentary lifestyles3.
In developed countries, nutritional counselling has been recognized as an effective measure to improve awareness and encourage a healthy lifestyle, and has been shown to reduce the risk of obesity and NCDs4. Nutritional counseling clinics can be organized in co-location with other general health care services or as stand-alone sites. However, in resource-scarce settings, this model has not yet to be implemented widely, due to the low responsiveness of health systems, as well as the poor practice of prevention against nutrition-related problems among the population5. This condition can be seen in several countries around the world, such as Denmark or Western Australia5–7.
In Vietnam, nutritional counseling clinics have been recently introduced in metropolitan areas, including Hanoi and Ho Chi Minh City. However, little is known about the profile and preference of the clients that attend these clinics. To inform policy development and support the expansion of this service, the present study was conducted to assess the preference and willingness of clients to pay for nutritional counseling services in an urban site in Hanoi.
A cross-sectional study was conducted from March to April 2016 in an urban clinic in Hanoi Medical University, Hanoi, Vietnam. Eligibility criteria included 1) clients attending services in the Center of Preventive Medicine at Hanoi Medical University; and clients’ parents or guardians (for those who were under 18 years old); 2) aged 18 years and above; 3) agreed to participate in this study and gave written informed consent; 4) able to answer a questionnaire (Supplementary File 1 and Supplementary File 2) for 15–20 minutes.
All eligible respondents from March to April 2016 were invited to participate in the study, resulting in a sample size of 429.
Socio-demographic variables included age, gender, ethnicity, religion, educational attainment, marital status, current occupation, self-assessment of nutritional status and monthly household income (see Table 5 for detail).
Preference for nutritional counseling services included who would receive nutritional counseling, frequency of counseling services and communication methods for counseling.
Willingness to pay for nutritional counseling services were elicited using the bidding game technique, which consists of double-bounded dichotomous-choice questions combined with an open-ended question regarding two service packages: 1) fee-for-service; and 2) one-year nutritional management package.
We selected 200,000 VND (~ US$ 9; 2017 exchange rate) and 3,000,000 VND (~ US$ 135; 2017 exchange rate) to be the initial prices for fee-for-service and one-year nutritional management package, respectively, based on the actual price of nutritional counseling services in this clinic. Each patient was asked a series of questions about their WTP at specific prices (see Figure 1 and Figure 2 for the bidding process). Firstly, the clients were asked if they were willing to pay the initial prices. Depending on the choice of either Yes or No, interviewers presented two other bids: the higher bid for respondents answering “Yes”; and the lower bid for respondents saying “No”. The question was repeated until the last bid was equal to four times or one eighth of the initial prices. Finally, the respondents were asked an open-ended question “What is the maximum price you would be willing to pay for nutritional counseling services?”


Data was analyzed using STATA software version 12.0 (Stata Corp. LP, College Station, TX, USA). A p-value <0.05 was considered statistically significance. A stepwise logistic model with the threshold of p-value < 0.2 was used to identify associated factors with the WTP. Interval regression was used to measure the amount of WTP and identify associated factors.
Proposal of this study was approved by the Ethical Committee of Hanoi Medical University. Subjects were introduced to the purpose of this study, and asked to give written informed consent if they agreed to participate in the study. Respondents could withdraw anytime they want. Their information was ensured to be confidential.
Demographic and socio-economic statuses of respondents are summarized in Table 1. Most of the clients were Kinh (97.7%), having above high school education (63.2%), single with no children (50.6–60.0%), and were in white collar employment (43.3%).
| Characteristics | Respondents | p-value | |||||||
|---|---|---|---|---|---|---|---|---|---|
| Parents* | Male adult | Female adult | Total** | ||||||
| n | % | n | % | n | % | n | % | ||
| Ethnicity | |||||||||
| Kinh | 159 | 100.0 | 87 | 94.6 | 170 | 97.1 | 416 | 97.7 | 0.02 |
| Other | 0 | 0.0 | 5 | 5.4 | 5 | 2.9 | 10 | 2.4 | |
| Education | |||||||||
| ≤ High school | 24 | 15 | 56 | 60.9 | 77 | 44 | 157 | 36.8 | <0.01 |
| > High school | 136 | 85.0 | 36 | 39.1 | 98 | 56.0 | 270 | 63.2 | |
| Religion | |||||||||
| No | 156 | 98.7 | 86 | 93.5 | 172 | 98.3 | 414 | 97.4 | 0.03 |
| Other | 2 | 1.3 | 6 | 6.5 | 3 | 1.7 | 11 | 2.6 | |
| Marital status | |||||||||
| Single/Divorced/Widow | 15 | 9.4 | 76 | 82.6 | 125 | 71.4 | 216 | 50.6 | <0.01 |
| Live with spouse/partner | 145 | 90.6 | 16 | 17.4 | 50 | 28.6 | 211 | 49.4 | |
| Employment | |||||||||
| Freelance | 26 | 16.7 | 8 | 8.7 | 12 | 6.9 | 46 | 10.9 | <0.01 |
| White collar | 104 | 66.7 | 20 | 21.7 | 59 | 33.7 | 183 | 43.3 | |
| Student | 8 | 5.1 | 58 | 63.0 | 94 | 53.7 | 160 | 37.8 | |
| Others | 18 | 11.5 | 6 | 6.5 | 10 | 5.71 | 34 | 8.0 | |
| Have child under 6 years old | |||||||||
| Single | 20 | 12.5 | 80 | 87.0 | 156 | 89.1 | 256 | 60.0 | <0.01 |
| Yes | 132 | 82.5 | 7 | 7.6 | 13 | 7.4 | 152 | 35.6 | |
| No | 8 | 5.0 | 5 | 5.4 | 6 | 3.4 | 19 | 4.5 | |
Table 2 shows the willingness to use for nutritional counseling services of clients. Overall, 79.6% clients wanted to use counseling services. The major desire was that respondents’ children would receive nutritional counseling (74.8%) monthly or more frequently (39.8%) via meeting physicians face-to-face (64.9%).
| Characteristics | Respondents | p-value | |||||||
|---|---|---|---|---|---|---|---|---|---|
| Parents* | Male adult | Female adult | Total | ||||||
| n | % | n | % | n | % | n | % | ||
| Preference to use nutritional counseling services | 102 | 80.3 | 61 | 70.9 | 134 | 83.8 | 297 | 79.6 | 0.06 |
| Who should receive nutritional counseling services | |||||||||
| Children - adolescents (<18 years old) | 118 | 77.1 | 61 | 66.3 | 133 | 77.3 | 312 | 74.8 | 0.10 |
| Adults (18–59 years old) | 29 | 19.0 | 44 | 47.8 | 83 | 48.3 | 156 | 37.4 | <0.01 |
| Elderly (≥60 years old) | 30 | 19.6 | 37 | 40.2 | 77 | 44.8 | 144 | 34.5 | <0.01 |
| No | 31 | 20.3 | 12 | 13.0 | 15 | 8.7 | 58 | 13.9 | 0.01 |
| Frequency of receiving nutritional counseling | |||||||||
| ≤ Monthly | 58 | 46.8 | 31 | 36.5 | 57 | 36.1 | 146 | 39.8 | 0.25 |
| Every 3 months | 31 | 25.0 | 27 | 31.8 | 59 | 37.3 | 117 | 31.9 | |
| Every 6 months | 21 | 16.9 | 20 | 23.5 | 30 | 19.0 | 71 | 19.4 | |
| Every year | 14 | 11.3 | 7 | 8.2 | 12 | 7.6 | 33 | 9.0 | |
| Communication methods | |||||||||
| Face-to-face counseling | 84 | 68.3 | 52 | 60.5 | 102 | 64.6 | 238 | 64.9 | 0.50 |
| Telephone counseling | 37 | 30.3 | 24 | 27.9 | 42 | 26.6 | 103 | 28.1 | 0.79 |
| Mobile phone applications | 13 | 10.6 | 23 | 26.7 | 28 | 17.7 | 64 | 17.4 | 0.01 |
| Other | 2 | 1.6 | 0 | 0.0 | 3 | 1.9 | 5 | 1.4 | 0.45 |
|
Reason for not wanting to use nutritional counseling services | |||||||||
| Comprehensive information on the Internet | 9 | 10.0 | 9 | 17.0 | 17 | 21.5 | 35 | 15.8 | 0.12 |
| Use this service elsewhere | 0 | 0.0 | 4 | 7.8 | 3 | 3.9 | 7 | 3.2 | 0.04 |
| Do not have money | 2 | 2.2 | 5 | 9.4 | 8 | 10.3 | 15 | 6.8 | 0.08 |
| Unnecessary | 78 | 86.7 | 42 | 80.8 | 56 | 71.8 | 176 | 80.0 | 0.06 |
| Other | 11 | 11.0 | 5 | 8.9 | 12 | 14.1 | 28 | 11.6 | 0.62 |
The WTP for one-time service is described in Table 3. Overall, a high amount of the respondents were willing to pay for nutritional counseling services (87.2%). The mean amount they were willing to pay was 96,100 VND per utilization (95% CI 81,000–111,000 VND), equivalent to US $4.3 in 2017, which varied across groups. There was a significant difference in the WTP of the three age groups (p<0.05).
| Characteristics | One-time package | Amount of WTP | ||||
|---|---|---|---|---|---|---|
| n | %a | p-value | Mean | 95% CI | ||
| Total | 259 | 87.2 | - | 96.1 | 81 | 111.2 |
| Gender | ||||||
| Male | 65 | 87.8 | 0.85 | 100.6 | 65.5 | 135.7 |
| Female | 194 | 87.0 | 94.9 | 78.5 | 111.3 | |
| Age | ||||||
| 18–24 years | 97 | 80.9 | 0.03 | 89.8 | 66.6 | 113.2 |
| 25–34 years | 135 | 91.2 | 86.9 | 68.7 | 105.1 | |
| ≥35 years | 27 | 93.1 | 154.7 | 84.2 | 225.2 | |
| Education | ||||||
| ≤ High school | 97 | 86.6 | 0.81 | 106.8 | 77.8 | 135.7 |
| > High school | 162 | 87.6 | 89.4 | 72.4 | 106.4 | |
| Marital status | ||||||
| Single/Divorced/widow | 136 | 85.5 | 0.36 | 100.2 | 78.7 | 121.8 |
| Live with spouse/partner | 123 | 89.1 | 92.8 | 71.3 | 114.2 | |
| Employmentb | ||||||
| Freelance | 32 | 86.5 | 0.23 | 112.4 | 57.2 | 167.5 |
| White collar | 105 | 88.2 | 84.1 | 64.1 | 104.1 | |
| Students | 99 | 83.9 | 100.7 | 74.9 | 126.5 | |
| Other | 21 | 100.0 | 128.3 | 61.9 | 194.8 | |
Table 4 describes the WTP for the one-year nutrition management package. On average, respondents were willing to pay 946,400VND (95% CI 860,200 – 1,032,700 VND) (~$41.9 – 2017) for this package, which varied among groups (p<0.05).
| Characteristics | One-year package | Amount of WTP | ||||
|---|---|---|---|---|---|---|
| n | %a | p-value | Mean | 95% CI | ||
| Total | 173 | 46.5 | - | 946.4 | 860.2 | 1032.7 |
| Gender | ||||||
| Male | 45 | 44.1 | 0.55 | 1027.7 | 823.5 | 1231.9 |
| Female | 128 | 47.6 | 918.7 | 827.0 | 1010.3 | |
| Age | ||||||
| 18–24 years | 81 | 53.6 | 0.07 | 1059.5 | 912.0 | 1206.9 |
| 25–34 years | 76 | 41.1 | 899.5 | 775.7 | 1023.4 | |
| ≥35 years | 16 | 44.4 | 756.7 | 609.5 | 904.0 | |
| Education | ||||||
| ≤ High school | 76 | 53.5 | 0.03 | 1066.4 | 906.8 | 1226.0 |
| > High school | 97 | 42.2 | 878.0 | 778.1 | 977.9 | |
| Marital status | ||||||
| Single/Divorced/widow | 104 | 52.8 | 0.01 | 1002.6 | 888.4 | 1116.9 |
| Live with spouse/ partner | 69 | 39.7 | 893.7 | 764.3 | 1023.1 | |
| Employmentb | ||||||
| Freelance | 20 | 48.8 | 0.01 | 818.3 | 668.3 | 968.3 |
| White collar | 59 | 38.1 | 908.7 | 765.3 | 1052.1 | |
| Students | 82 | 56.2 | 1067.3 | 919.4 | 1215.1 | |
| Other | 11 | 50.0 | 777.3 | 585.0 | 969.6 | |
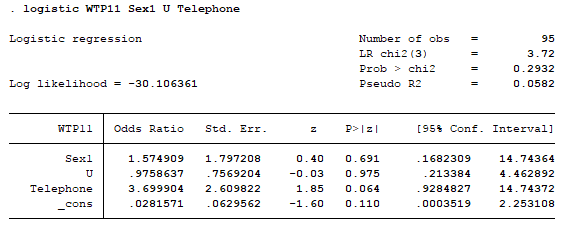
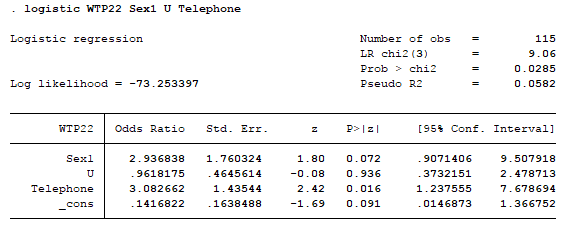
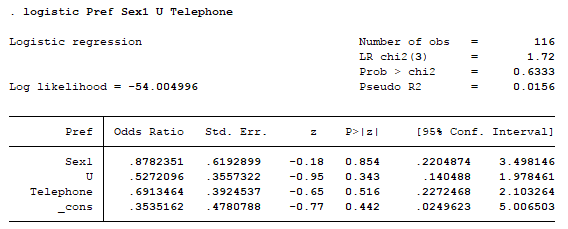
Associated factors of the willingness to use and WTP for nutritional counseling services are shown in Table 5. The likelihood of using nutritional counseling services was higher among females, those seeking counseling for elderly people and those that preferred face-to-face counseling services. WTP for one-time service was 95,000 VND higher among clients aged over 35. Meanwhile, WTP for one-year nutritional management services was higher among those seeking services for the elderly people, those with a poor nutritional status and those that have under-6 year old children.
| Characteristics | Willingness to use services | WTP for One-time package | WTP for One-year package | |||
|---|---|---|---|---|---|---|
| OR | 95% CI | Coef. | 95% CI | Coef. | 95% CI | |
| Sociodemographic | ||||||
| Female (ref) | ||||||
| Male | 0.52** | 0.28; 0.95 | ||||
| Age | ||||||
| 18–24 years (ref) | ||||||
| >35 years | 95.78*** | 33.93; 157.61 | ||||
| Education | ||||||
| ≤ High school (ref) | ||||||
| > High school | -303.29** | -546.80; -59.79 | ||||
| Household incomea | ||||||
| Poorest (ref) | ||||||
| Rich | 36.04 | -13.58; 85.65 | ||||
| Richest | 197.18 | -95.26; 489.63 | ||||
|
Have children under 6 years old | ||||||
| Single (ref) | ||||||
| Yes | 266.30** | 5.75; 526.84 | ||||
| No | 74.24 | -17.82; 166.30 | ||||
| Nutritional statusb | ||||||
| Very good (ref) | ||||||
| Average | 26.63 | -8.23; 61.48 | ||||
| Poor | 635.65*** | 182.19; 1,089.11 | ||||
|
Target groups of counseling service | ||||||
| Children (ref) | ||||||
| Elderly (≥60 years old) | 1.82** | 1.01; 3.27 | 261.72** | 38.75; 484.69 | ||
|
Communication methods | ||||||
| Face-to-face (ref) | ||||||
| Telephone counseling | 0.47** | 0.26; 0.83 | ||||
| Constant | 4.12*** | 2.58; 6.60 | 38.10** | 2.89; 73.32 | 823.58*** | 573.21; 1,073.96 |
*** p<0.01, ** p<0.05, * p<0.1
aHousehold income: Poorest, ≤7,000,000VND/month (~$307.4); Poor, 7,000,000 – 10,000,000VND/month (~$307.4 – $439.2); Average, 10,000,000 – 15,000,000VND/month (~$439.2 – $658.8); Rich, 15,000,000 – 20,000,000VND/month (~$658.8 – $878.3); Richest, >20,000,000VND/month (~$878.3).
bNutritional status (self-assessment of respondents), including: Very good; Good; Average; Poor; Very poor.
Nutrition has been a pressing topic of many researchers8. There are several studies about nutritional counseling services for patients9–11 or concerning a particular nutritional component12,13, but studies about general and preventive nutritional counseling are still limited14. Evidence provided by this study not only imparts information for future research, but also gives nutritional counseling providers a better perception to enhance their services.
In this urban setting, we found a high preference for nutritional counseling services for various target client groups, including elderly people and children. Clients also reported a high WTP for this service, which could be very helpful for expansion of the services. However, a combination of communication methods is needed; we found a higher preference for face-to-face counseling among respondents, knowing that many of them may also seek other health care services.
Overall, the preference for nutritional counseling in this study was quite high (79.6%). Most of the clients who did not have the need for this service were single with no children and self-evaluated their nutritional status as ‘average’. The mean amount of WTP for one-time and one-years services was $4.3 and $41.9, accounting for 0.20% and 1.98% GDP per capita in Vietnam in 2015 ($2,111, enumerated by World Bank)15, which is an acceptable amount for clients to pay.
Associated factors of the preference and WTP for nutritional counseling services in our study were not in line with some predictions provided by a study in South Korea16. Our study showed that older clients are more willing to pay for nutritional counseling than younger ones. Another noteworthy finding of this study is that clients with a higher educational level were not as willing to pay for the one-year management package as clients who only finished high school. This can be explained by the two occupations of respondents: those whose educational level were above high school were mainly white-collar workers, while almost everyone with lower educational levels were still high-school students or college students (83.8%). This may suggest that the recent nutritional education programs in Vietnam have caused a positive effect on students’ attitude toward nutritionally related programs (http://dinhduonghocduong.net/)17.
Those who have under-6 year old children and assess their children’s nutrition status poorly had a higher WTP for nutritional counseling services. These findings are well expected, thus enhance our study data’s validity. We suspected that clients’ income was associated with their WTP, as richer clients are more likely to pay a higher amount for nutritional counseling services. However, there was no significant relationship between clients’ household income and the WTP for nutrition counseling services.
To elicit a clients’ preference and WTP, we used the bidding game technique, as it was proved to be more reliable than open-ended questions or dichotomous-choice questions only18,19. However, one of the biggest drawbacks of this technique is that the risk of starting-point bias - the initial bid can have influence on clients’ WTP20. The initial bids in this study were based on the actual prices for nutritional counseling services in this setting in order to minimize the occurrence of this bias. Additionally, our study may possibly be affected by other biases, such as observation bias, which occurs when the roles of respondents in their families can affect the amount of their WTP21. For example, we assumed that those who were the bread-winners in their families tended to have higher WTP for health-related services. Another example is that if information about nutritional counseling may not be sufficiently provided, this may result in lower preference and WTP for nutritional counseling services. To mitigate this bias, we selected highly-experience interviewers and trained them carefully with a standardized protocol for data collection.
The preference and willingness to pay for nutritional counseling services in urban Hanoi is relatively high. These findings may partly contribute to the implementation of maintaining nutritional counseling services Vietnam, thus actively preventing and controlling the spread of non-communicable diseases.
Dataset 1: Raw data for Table 1–Table 5. doi, 10.5256/f1000research.10974.d15326022
| Views | Downloads | |
|---|---|---|
| F1000Research | - | - |
|
PubMed Central
Data from PMC are received and updated monthly.
|
- | - |
Click here to access the data.
Spreadsheet data files may not format correctly if your computer is using different default delimiters (symbols used to separate values into separate cells) - a spreadsheet created in one region is sometimes misinterpreted by computers in other regions. You can change the regional settings on your computer so that the spreadsheet can be interpreted correctly.
Provide sufficient details of any financial or non-financial competing interests to enable users to assess whether your comments might lead a reasonable person to question your impartiality. Consider the following examples, but note that this is not an exhaustive list:
Sign up for content alerts and receive a weekly or monthly email with all newly published articles
Already registered? Sign in
The email address should be the one you originally registered with F1000.
You registered with F1000 via Google, so we cannot reset your password.
To sign in, please click here.
If you still need help with your Google account password, please click here.
You registered with F1000 via Facebook, so we cannot reset your password.
To sign in, please click here.
If you still need help with your Facebook account password, please click here.
If your email address is registered with us, we will email you instructions to reset your password.
If you think you should have received this email but it has not arrived, please check your spam filters and/or contact for further assistance.
Comments on this article Comments (0)