


Abstract
Sleep plays an important role in energy homeostasis. The present study tests the hypothesis that circulating levels of leptin, a hormone that signals energy balance to the brain, are influenced by sleep duration. We also analyzed associations between leptin and sympathovagal balance, cortisol, TSH, glucose, and insulin under different bedtime conditions. Twenty-four-hour hormonal and glucose profiles were sampled at frequent intervals, and sympathovagal balance was estimated from heart rate variability in 11 subjects studied after 6 d of 4-h bedtimes (mean ± sem of sleep duration during last 2 d: 3 h and 49 ± 2 min) and after 6 d of 12-h bedtimes (sleep: 9 h and 03 ± 15 min). A study with 8-h bedtimes was performed 1 yr later (sleep: 6 h and 52 ± 10 min). Caloric intake and activity levels were carefully controlled in all studies. Mean levels, maximal levels, and rhythm amplitude of leptin were decreased (−19%, −26%, and −20%, respectively) during sleep restriction compared with sleep extension. The decrease in leptin levels was concomitant with an elevation of sympathovagal balance. The effects of sleep duration on leptin were quantitatively associated with alterations of the cortisol and TSH profiles and were accompanied by an elevation of postbreakfast homeostasis model assessment values. Measures of perceived stress were not increased during sleep restriction. During the study with 8-h bedtimes, hormonal and metabolic parameters were intermediate between those observed with 4-h and 12-h bedtimes. In conclusion, sleep modulates a major component of the neuroendocrine control of appetite.
LEPTIN, A HORMONE released by the adipocytes, provides information about energy status to regulatory centers in the brain (1). In humans, circulating leptin concentrations are responsive to acute changes in energy balance resulting from increased or decreased caloric intake (2–5). Leptin levels are elevated during sleep (6–8). The nocturnal rise of leptin is partly a response to daytime meal ingestion (7). However, an elevation during sleep persists in subjects receiving continuous enteral nutrition, even when sleep occurs during the daytime (8), indicating that sleep per se affects leptin regulation. Sleep plays an important role in energy balance. In rodents, food shortage or starvation results in decreased sleep (9), and conversely, total sleep deprivation leads to marked hyperphagia (10, 11). The identification of hypothalamic excitatory neuropeptides, referred to as hypocretins or orexins, which have potent wake-promoting effects and stimulate food intake under certain conditions, has provided a molecular basis for the interactions between the regulation of feeding and sleeping (12, 13). Recent rodent studies have indicated that hypocretin neuronal activity and hypocretin-1 release are stimulated by sleep deprivation (14, 15). Because of this growing evidence for a link between sleeping and eating behavior, we measured the 24-h profile of leptin levels under conditions of sleep restriction and sleep extension in healthy young adults while controlling for caloric intake and energy expenditure. Limited preliminary data on the impact of sleep duration on leptin levels from this study have been previously reported (16).
An impact of sleep duration on leptin levels could involve several mechanisms. Increased sympathetic nervous system outflow could be one of the pathways mediating effects of sleep on peripheral function. Some, but not all (17), studies of acute total or partial sleep deprivation have indeed demonstrated an increase in urinary and plasma catecholamine levels in animals (18) and in humans (19–22). Because leptin release is inhibited by sympathetic nervous system activity (23), it is possible that sleep restriction may result in decreased leptin levels because of an inhibitory effect of increased sympathetic outflow.
An impact of sleep duration on leptin could also reflect the impact of hormones that interact with leptin and that are also modulated by sleep. Conversely, sleep-dependent alterations of leptin may result in alterations of leptin-sensitive hormonal axes. Most prominent among the hormonal systems that interact with leptin as well as with sleep regulation are the hypothalamo-pituitary-adrenal axis and glucose regulation by insulin. Glucocorticoids stimulate food intake in humans (24, 25), and leptin and cortisol levels follow 24-h patterns that are in a mirror image (26). In addition to their inverse temporal relationship, strong interrelations have been reported between leptin and the hypothalamo-pituitary-adrenal axis (27, 28). Evening cortisol levels are elevated in subjects submitted to experimental sleep loss (29, 30) as well as in insomniacs (31). A parallelism between the diurnal and pulsatile variations in TSH and leptin levels has been reported in healthy young adults (32). The 24-h profile of plasma TSH is markedly influenced by acute total sleep deprivation (33, 34) as well as by recurrent partial sleep curtailment (30). Insulin acts in synergy with cortisol to regulate leptin production (35) and has hypnotic effects when administered centrally in rodents (36). We have demonstrated that a state of sleep debt results in an approximate 30% decrease in glucose tolerance and in acute insulin response to iv glucose (30).
The present study assesses the impact of sleep duration on the 24-h profiles of leptin levels, sympathovagal balance, cortisol, TSH, glucose, and insulin concentrations in subjects studied after 6 d of sleep restriction (4-h bedtimes) and after 6 d of sleep extension (12-h bedtimes) and, on a separate occasion, under standard 8-h bedtime conditions. The findings demonstrate unequivocally that sleep duration has a major impact on leptin levels as well as on cardiac sympathovagal balance, cortisol, TSH, and carbohydrate metabolism.
Subjects and Methods
Subjects
The subjects were 11 healthy men [age, 22 ± 1 yr; body mass index (BMI), 23.4 ± 0.5 kg/m2] who took no medication and did not smoke. They had regular bedtimes of approximately 8 h (±30 min). Shift workers or subjects having traveled across time zones less than 4 wk before the study were excluded.
Experimental protocol
The protocol was approved by the Institutional Review Board of the University of Chicago, and written informed consent was obtained. During the week preceding the sleep restriction/sleep extension study, the subjects were asked to conform to fixed bedtimes (2300–0700 h) and mealtimes (0900, 1400, and 1900 h). Naps were not allowed. They were asked not to deviate from this schedule by more than 30 min. Wrist activity was monitored continuously to verify compliance. The subjects then spent 16 consecutive nights in the Clinical Research Center, including three nights with 8-h bedtime (2300–0700 h; baseline), six nights with 4-h bedtime (0100–0500 h; sleep restriction), and seven nights with 12-h bedtime (2100–0900 h; sleep extension). Sleep was recorded during each night. During the last 60 h of each condition, the subjects remained at bed rest. They wore a polar chest belt including conductive pads that pick up electrocardiographic activity and transmit it to a recording device via a wireless radio signal (Mini-Logger, Mini-Mitter Company, Sunriver, OR). This device allowed for the continuous monitoring of cardiac interbeat intervals. Caloric intake was identical in the two bedtime conditions and included an iv glucose tolerance test (0.3 g glucose/kg body weight) on the first morning and identical carbohydrate-rich meals (30 kcal/kg body weight; 62% carbohydrates) at 1400 h and 1900 h on the first day and 0900 h, 1400 h, and 1900 h on the second day. There was no other source of calories. During the last 24 h of the 4-h and 12-h bedtime conditions, blood was sampled at 10- to 30-min intervals. Twenty-four-hour sampling for the 4-h bedtime condition ended after the sixth night of sleep restriction, whereas 24-h sampling for the 12-h bedtime condition spanned the 7th night of sleep extension. During bedtime hours, the catheter was connected to plastic tubing extending to an adjacent room to sample without disturbing the subject. Measures of subjectively perceived stress were obtained at hourly intervals during the last 24 h of both bedtime conditions, using the tense and calm visual analog subscales of the Visual Analog Scales for Global Vigor and Affect developed by Monk (37) and the five-point nervous subscale of the Positive Affect and Negative Affect Scale (38).
Limitations on amount of blood withdrawal did not allow for 24-h blood sampling at baseline (8-h bedtimes) during the sleep restriction/sleep extension study. However, nine of the 11 subjects participated in a separate control study with 8-h bedtimes, 1 yr later (controlling for possible seasonality effects), using the same experimental procedures.
Sleep recording and analysis
Sleep was polygraphically recorded during the last two baseline nights, the last two nights of sleep restriction, and the last two nights of sleep extension. Sleep was also recorded during the subsequent control study with 8-h bedtimes. The recordings were scored at 20-sec intervals in stages wake, I, II, III, IV, and REM (rapid eye movement) according to standard criteria (39). Sleep onset and final awakening were defined as the time corresponding to the first and last 20-sec interval scored II, III, IV, or REM. The following parameters were determined: sleep period (i.e. time interval separating sleep onset from morning awakening), total sleep time (i.e. sleep period − duration of intrasleep wake periods), sleep efficiency (i.e. total sleep time/time allocated to sleep), duration of light non-REM sleep (i.e. stages 1 + 2), duration of slow wave sleep (SWS) (i.e. sleep stages III and IV), duration of REM sleep, and duration of intrasleep wake.
Assays
Levels of blood glucose were measured on a 0.2-ml aliquot, at the bedside, using a Yellow Springs Instrument Co. (Yellow Springs, OH) Model 23A with a coefficient of variation of less than 2%. The remainder of each blood sample was immediately centrifuged at 4 C. Plasma samples were frozen at −20 C until assay. Serum leptin levels were measured using a human leptin RIA kit (Linco Research, St. Charles, MO) with a sensitivity of 0.5 ng/ml and an intraassay coefficient of variation of 8.3%. Total plasma cortisol levels were measured by RIA (Orion Diagnostica, Espoo, Finland) with a sensitivity of 0.75 μg/dl (20.7 nmol/liter) and an average intraassay coefficient of variation of 4%. TSH levels were assayed by chemiluminescent enzyme immunoassay (Immulite, Diagnostics Products Corporation, Los Angeles, CA) with a limit of sensitivity of 0.002 mIU/liter and an intraassay coefficient of variation of 5%. Serum insulin was measured by RIA with a limit of sensitivity of 2.8 mIU/liter (20 pm) and an intraassay coefficient of variation averaging 5%. All samples collected in the same subject during sleep restriction and extension were analyzed in the same assay. The 24-h mean cortisol and TSH profiles during sleep restriction/extension have been previously reported (30).
After sleep restriction, leptin levels at the end of 24-h sampling were higher than at the same time of day at the beginning of sampling. Similar upward trends were present after sleep extension but were of lesser magnitude. Careful verifications indicated that these trends were not an artifact of the assay procedures. Because such a trend was not observed for cortisol, it is unlikely to reflect some stress related to the experimental procedure. The examination of 24-h leptin profiles published by other groups (26) reveals that such trends are commonly observed but have never been discussed. We calculated mean leptin levels using raw data, but chronobiological characteristics were conservatively estimated using linearly detrended profiles.
Estimations of profiles of sympathovagal balance
Valid recordings of heart rate variability were obtained under both the 4-h and 12-h bedtime conditions for nine of the 11 subjects. Interbeat intervals shorter than 400 msec or longer than 1700 msec were considered as technical artifacts and removed from the data. The autocorrelation coefficient of consecutive interbeat intervals (rRR) was then calculated over each 5 min of recording. The individual 24-h profiles of rRR were smoothed using a moving average with a 4-h window (48 data at 5-min intervals) before calculating mean profiles across individuals for each bedtime condition.
Chronobiological analysis of leptin, cortisol, and TSH profiles
For each hormone, frequent blood sampling across the 24-h cycle, and the calculation of a regression curve fitting the data allowed for the reduction of pulsatile and day-to-day variability. The waveshape of each profile was quantified by a regression curve using a robust locally weighted procedure with a 4-h window (40). The acrophase and the nadir were defined, respectively, as the maximum and minimum of the regression curve; and the amplitude, as half of the difference between the acrophase and the nadir. To quantify the overall degree of concordance between 24-h variations of leptin and cortisol or TSH, respectively, we calculated cross-correlations between the two hormonal profiles at lags 0, ±30 min, … , ±360 min (41). For each pair of series, the maximal coefficient of cross-correlation was identified along with the lag at which it occurred.
Postmeal glucose and insulin responses
The area under the curve of glucose and insulin concentrations for the 90-min period after meal ingestion was calculated to quantify meal responses. The homeostasis model assessment (HOMA) value [glucose concentration (mmol/liter) × insulin concentration (mIU/liter) divided by 22.5], an index of pancreatic β-cell function and tissue insulin sensitivity (42), was calculated for each time point of the 24-h glucose and insulin profiles. In the present study, the HOMA was used as an integrated measure of the glucose and insulin responses to meals, rather than as an index of insulin sensitivity. Indeed, in homogenous small groups of healthy individuals with normal glucose tolerance, the HOMA index is not a well-validated measure of insulin sensitivity. The HOMA response to meals was estimated as the area under the curve of the HOMA profile for the 90-min period after meal ingestion.
Statistical analysis
All group values are expressed as mean ± sem. Paired comparisons between sleep restriction and sleep extension were performed using the paired t test. The P levels were not adjusted for multiple comparisons across distinct endocrine axes. Comparisons of variables obtained during 8-h, 4-h, and 12-h bedtime conditions were performed using ANOVA for repeated measures. Correlations were calculated using the Pearson coefficient.
Results
Sleep quantity and quality
Table 1 summarizes the sleep parameters during the last two nights of baseline, sleep restriction, and sleep extension of the sleep restriction/sleep extension study. Sleep parameters during the control study with 8-h bedtimes performed 1 yr later were similar to those observed at baseline in the sleep restriction/sleep extension study (total sleep time, 6 h and 52 ± 10 min, P = 0.24 vs. baseline of sleep restriction/sleep extension study) except for a decrease in SWS (68 ± 10 min, P = 0.009 vs. baseline of sleep restriction/sleep extension study) most likely related to the presence of the sampling catheter. When faced with recurrent bedtime curtailment, the young healthy adults who participated in the sleep restriction/sleep extension study were able to spend nearly all the allocated bedtime asleep; and thus, sleep efficiency was more than 95%. In contrast, sleep efficiency was much lower during sleep extension (P = 0.0001), because the subjects spent nearly 3 of the 12 h in bed awake, indicating that they had recovered from sleep loss. Quantitatively, the major adaptation to sleep restriction and extension was achieved by proportional compression or extension of the lighter stages of non-REM sleep (stages I+II) and of REM sleep (P = 0.0001), such that the percentage of the sleep period spent in these stages remained constant across the three conditions. In contrast, the percentage of deep non-REM sleep (stages III+IV, SWS) was highest during sleep restriction (P = 0.0001), revealing an increased pressure for SWS.
Sleep parameters during the last two nights of 8 h in bed (baseline), 4 h in bed, and 12 h in bed in the sleep restriction/sleep extension study
| Time allocated to sleep (h) | P level | |||
|---|---|---|---|---|
| 4 | 8 | 12 | ||
| Sleep efficiency (%) | 96 ± 0 | 91 ± 1 | 76 ± 2 | 0.0001 |
| Total sleep time | 3 h 49 ± 2 min | 7 h 14 ± 5 min | 9 h 03 ± 15 min | 0.0001 |
| Amount of sleep stages | ||||
| Duration (min) | ||||
| Wake | 5 ± 1 | 29 ± 5 | 106 ± 14 | 0.0001 |
| Stages I + II | 109 ± 6 | 236 ± 6 | 336 ± 13 | 0.0001 |
| Stages III + IV (SWS) | 74 ± 6 | 103 ± 8 | 82 ± 7 | 0.0001 |
| REM sleep | 46 ± 6 | 95 ± 6 | 125 ± 10 | 0.0001 |
| Proportion of the sleep period (%) | ||||
| Wake | 2 ± 0 | 6 ± 1 | 16 ± 2 | 0.0001 |
| Stages I + II | 47 ± 3 | 51 ± 1 | 52 ± 2 | ns |
| Stages III + IV (SWS) | 32 ± 3 | 22 ± 2 | 13 ± 1 | 0.0001 |
| REM sleep | 20 ± 3 | 21 ± 1 | 19 ± 1 | ns |
All results are expressed as mean ± sem. ns, Not significant.
Hormonal, metabolic, and cardiovascular profiles
Figure 1 illustrates the 24-h profiles of leptin, cortisol, TSH, glucose, insulin, HOMA, and rRR levels observed in the 11 subjects who were studied after 6 d of sleep restriction (left) compared with fully rested after 6 d of sleep extension (right).
![Mean (+sem) 24-h profiles of leptin (A), cortisol (B), TSH (C), glucose, insulin, HOMA (D), and sympathovagal balance [estimated at 5-min intervals using rRR (E)] when time in bed is 4 h (left) or 12 h (right). Black bars, Sleep periods. Blood sampling frequency for hormonal levels was every 10 min for 60 min after meal presentation (at 0900 h, 1400 h, and 1900 h), every 15 min during the first 3 h of sleep, and every 30 min at other times. Arrows, Acrophase for leptin and the nadir for cortisol. The shaded areas on the cortisol profiles correspond to the period when elevated cortisol levels during sleep restriction were inversely related to the duration of the morning to evening leptin rise. The shaded areas on the TSH profiles illustrate the nocturnal rise of TSH levels. The shaded areas on the glucose, insulin, and HOMA profiles represent the responses to ingestion of a high-carbohydrate breakfast. The conversion factors from conventional and/or metric units to Systeme International (SI) units are as follows: cortisol, μmol/liter, multiply by 0.028; glucose, mmol/liter, multiply by 0.0556; insulin, pmol/liter, multiply by 7.175.](https://oup.silverchair-cdn.com/oup/backfile/Content_public/Journal/jcem/89/11/10.1210_jc.2004-1003/2/m_zeg0110409420001.jpeg?Expires=1716828512&Signature=I4CBPi-NSYPUGIKa5tR9BbTaZdu21ACK7kwBD7H8liOB1RfpGAOci4MxFN-5S-SQcve77Vc1iYKiKDchhMN2cyUtpcv1Pe3LJ5I0MATY2ZTyhd9AZMzwZuozX1kLrciiMS02KLiaTtFjSvpnM72eB6toGoDreXMv~r5n4Ffu54PRhAqcvIAfhIuBtQ87OgOcC~nZFZuU-i0-PpEbMNdv5zAClOJgco5d2SsrWtN7NCheTBdR2EhQPQIxX2mGduFZuol7l2XEMnmh~AwIatRhZ-uMEjNq7Z-RdhBEdy7FV-EROkQB5VmBVb0Trrfyk04uqlSgoN48r2Np3uZj0pSEOA__&Key-Pair-Id=APKAIE5G5CRDK6RD3PGA)
Mean (+sem) 24-h profiles of leptin (A), cortisol (B), TSH (C), glucose, insulin, HOMA (D), and sympathovagal balance [estimated at 5-min intervals using rRR (E)] when time in bed is 4 h (left) or 12 h (right). Black bars, Sleep periods. Blood sampling frequency for hormonal levels was every 10 min for 60 min after meal presentation (at 0900 h, 1400 h, and 1900 h), every 15 min during the first 3 h of sleep, and every 30 min at other times. Arrows, Acrophase for leptin and the nadir for cortisol. The shaded areas on the cortisol profiles correspond to the period when elevated cortisol levels during sleep restriction were inversely related to the duration of the morning to evening leptin rise. The shaded areas on the TSH profiles illustrate the nocturnal rise of TSH levels. The shaded areas on the glucose, insulin, and HOMA profiles represent the responses to ingestion of a high-carbohydrate breakfast. The conversion factors from conventional and/or metric units to Systeme International (SI) units are as follows: cortisol, μmol/liter, multiply by 0.028; glucose, mmol/liter, multiply by 0.0556; insulin, pmol/liter, multiply by 7.175.
Leptin.
Leptin profiles under both sleep restriction and sleep extension exhibited the expected diurnal variation that is largely dependent on meal intake (Fig. 1A). However, when sleep was restricted, mean leptin levels were 19% lower (3.6 ± 0.6 ng/ml during sleep restriction compared with 4.5 ± 0.8 ng/ml during sleep extension, P = 0.003), and the duration of the rise from morning nadir to nocturnal acrophase was decreased by nearly 1.5 h (716 ± 35 vs. 797 ± 35 min, P = 0.026). Thus, the acrophase occurred 2 h earlier [2100 h, 33 min (21:33) ± 43 min vs. 23:30 ± 21 min; P = 0.027] and was 26% lower in the state of sleep debt than when the subjects were fully rested (4.0 ± 0.7 vs. 5.6 ± 1.1 ng/ml, P = 0.002). The amplitude of the diurnal variation was 1.1 ± 0.2 ng/ml during sleep restriction, i.e., on average, 20% lower than during sleep extension (1.5 ± 0.3 ng/ml, P = 0.007). These marked differences in 24-h regulation of leptin levels between the two bedtime conditions occurred despite similar amounts of caloric intake and physical activity as well as stable BMI. In an exploratory analysis, we found that the difference in mean leptin concentrations between the two bedtime conditions was positively correlated with the individual 24-h mean (r = +0.73, P = 0.011). Thus, the impact of sleep duration appeared to be larger for subjects who had higher mean leptin levels.
Cortisol.
Although 24-h mean cortisol levels were similar under both bedtime conditions [6.5 ± 0.3 μg/dl vs. 6.6 ± 0.3 μg/dl (183 ± 10 nmol/liter vs. 186 ± 8 nmol/liter); P = 0.77], sleep duration affected the wave shape of the diurnal variation (Figs. 1B and 22). The amplitude of the rhythm tended to be decreased during sleep restriction, compared with sleep extension [5.2 ± 0.3 vs. 6.0 ± 0.3 μg/dl (145 ± 8 vs. 168 ± 7 nmol/liter); P = 0.12]. The decline from morning acrophase to nocturnal nadir was slower during sleep restriction than during sleep extension [0.59 ± 0.03 vs. 0.76 ± 0.04 μg/dl·h (16.4 ± 0.8 vs. 21.5 ± 1.1 nmol/liter·h); P = 0.009] (Fig. 2A). Consequently, despite a tendency for the value of the acrophase to be lower in the sleep restriction than in the sleep extension condition [11.6 ± 0.7 vs. 13.5 ± 0.6 μg/dl (324 ± 18 vs. 378 ± 15 nmol/liter); P = 0.086], cortisol levels in the late afternoon and evening (1600–2100 h) were higher after sleep restriction than after sleep extension [6.2 ± 0.3 vs. 4.6 ± 0.3 μg/dl (173 ± 9 vs. 129 ± 9 nmol/liter); P = 0.0001; Fig. 1B, shaded areas], and the nadir occurred approximately 1.5 h later (02:06 ± 10 min vs. 00:26 ± 22 min, P = 0.002; Fig. 1B, arrows). Contrasting with the slower rate of decline across the daytime period, the duration of the cortisol elevation from nocturnal nadir to morning acrophase was shorter when bedtimes were restricted than when they were extended (380 ± 18 vs. 495 ± 22 min, P = 0.002; Fig. 2B). The timing of the morning acrophase was similar under both conditions (4 h in bed: 08:26 ± 21 min; 12 h in bed: 08:41 ± 6 min, P = 0.46).
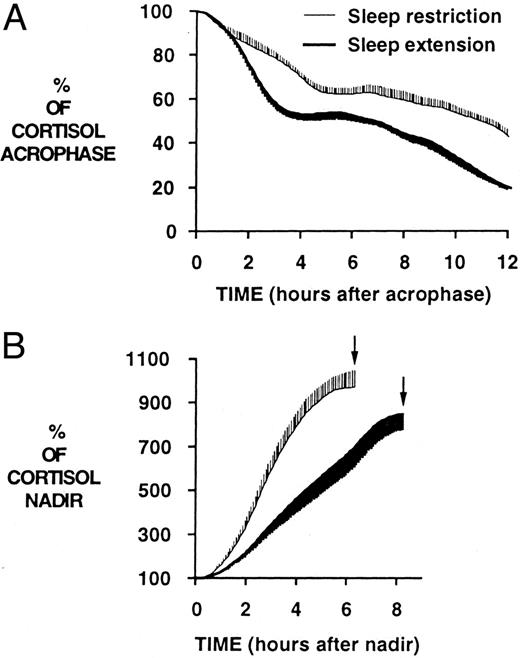
Mean curves for the declining (A) and ascending (B) portions of the 24-h cortisol profiles. Arrows, Acrophase. A, Decline from morning acrophase to nocturnal nadir was slower during sleep restriction than during sleep extension; B, in contrast, the increase of cortisol concentrations from nocturnal nadir to morning acrophase was shorter when bedtimes were restricted than when they were extended.
TSH.
When the subjects were fully rested, TSH concentrations exhibited a large elevation in the late evening, followed by a progressive nocturnal decline toward lower daytime values (Fig. 1C). This pattern of TSH secretion is typically observed under normal bedtime conditions. Sleep duration markedly affected both the mean TSH level and the amplitude of the evening elevation. After sleep restriction, mean 24-h TSH levels were 26% lower than after sleep extension (0.95 ± 0.10 vs. 1.43 ± 0.18 mIU/liter; P = 0.0075), and the amplitude of the diurnal variation was reduced by 27% (0.44 ± 0.05 vs. 0.73 ± 0.12 mIU/liter; P = 0.0395).
Glucose, insulin, and HOMA.
Glucose and insulin profiles showed the expected periprandial changes (Fig. 1D). As previously described (30), after ingestion of the breakfast meal, glucose levels during the first 90 min were higher during sleep restriction than sleep extension, despite insulin levels that were slightly, but not significantly, higher. Thus, the postbreakfast HOMA was significantly elevated (+56%) when the subjects were in a state of sleep debt, compared with fully rested (1954 ± 188 vs. 1399 ± 153 (mmol/liter)·(mU/liter)·min for the area under the curve of HOMA from 0900–1030 h, P = 0.026). The responses to the midday and evening meals were similar under both bedtime conditions.
Sympathovagal balance.
Sleep restriction, compared with sleep extension, tended to be associated with higher values of rRR over the 24-h period (0.708 ± 0.025 vs. 0.646 ± 0.039; P = 0.093; Fig. 1E). Higher rRR values reflect lower levels of heart rate variability due to an elevation of cardiac sympathetic activity and/or a decrease in parasympathetic activity (43, 44). The impact of sleep restriction on sympathovagal balance was particularly important in the morning and early afternoon (0900–1300 h: 0.769 ± 0.019 vs. 0.679 ± 0.034, P = 0.020; 1300–1700 h: 0.754 ± 0.018 vs. 0.659 ± 0.046, P = 0.050). Nadir values (i.e. maximum heart rate variability) occurred at similar times under both bedtime conditions and were not significantly different. The early morning increase in cardiac sympathovagal balance was markedly sharper when sleep was restricted than when the subjects had fully recovered (Fig. 1E).
Measures of perceived stress.
Figure 3 illustrates the profiles of hourly scores on three scales assessing self-perceived stress under both sleep conditions. Scores on all three scales were consistently low, irrespective of time in bed. There were no significant differences across bedtime conditions. Thus, when sleep was restricted, the subjects did not perceive the extra hours of enforced wakefulness under comfortable sedentary conditions in the laboratory as stressful.
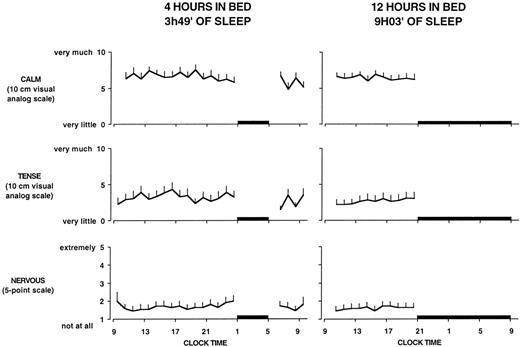
Mean (+sem) profiles of hourly scores on the visual analog scale for calm, the visual analog scale for tense, and the five-point scale for nervous on both bedtime conditions. Black bars, Sleep periods. There were no significant effects of bedtime duration on any of these three markers of self-perceived stress.
Correlations between sympathovagal balance and leptin.
We sought to determine whether the subjects who had the largest decrease in leptin levels during sleep restriction also experienced the largest increase in cardiac sympathovagal balance. No significant correlations were found. This negative result is not unexpected because alterations in sympathetic outflow at the level of the adipose tissue are not likely to be strictly commensurate with changes in cardiac sympathovagal balance.
Correlations between leptin and cortisol.
Leptin levels and cortisol levels varied in a mirror image throughout the 24-h cycle when the subjects were fully rested, whereas during sleep restriction, the inverse relationship between leptin and cortisol occurred primarily during the daytime (Fig. 1, A and B). In the state of sleep debt, the acrophase of the leptin profile preceded the nadir of cortisol concentrations by nearly 5 h (4 h and 22 min ± 50 min). In contrast, when the subjects were fully rested, the lag between maximum leptin concentrations and minimal cortisol levels was only 1 h and 6 ± 32 min (P = 0.007). Cross-correlation analysis confirmed that the inverse relationship between leptin and cortisol was stronger after sleep extension than after sleep restriction (maximum cross-correlation coefficient, −0.74 ± 0.03 vs. −0.66 ± 0.02, P = 0.028).
Because both an elevation of evening cortisol levels and a curtailment of the rising phase of leptin were observed in the sleep debt condition, we sought to determine whether there was a relationship between these two alterations. Indeed, during sleep restriction, the duration of the leptin elevation from the nadir to the acrophase was inversely related to mean plasma cortisol concentrations during the time interval 1600–2100 h (r = −0.672; P = 0.024; Fig. 4, left). During sleep extension, this correlation did not reach significance.
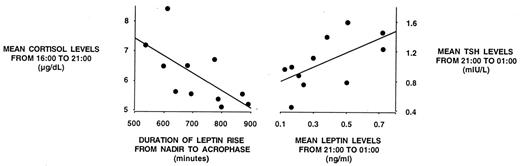
Alterations in leptin profiles during sleep restriction are associated with alterations of cortisol and TSH profiles. Left, Duration of the daytime leptin elevation is inversely correlated to the evening levels of cortisol; right, leptin and TSH levels from 2100–0100 h are quantitatively correlated. To convert cortisol values in metric units (μg/dl) to SI units (μmol/liter), multiply by 0.028.
Correlations between leptin and TSH.
As illustrated in Fig. 1, A–C, sleep restriction had qualitatively similar effects on the levels and diurnal variations of leptin and TSH, with a marked reduction in mean levels and amplitude of the diurnal variation for both hormones. Furthermore, during sleep restriction, mean leptin and TSH levels during the nocturnal rise of TSH (2100–0100 h) were quantitatively correlated (r = 0.623; P = 0.041; Fig. 4, right). After sleep extension, this association between nocturnal leptin and TSH levels did not reach statistical significance (r = 0.357; P = 0.2811). There were no correlations between leptin and TSH levels during the daytime period during either bedtime condition.
Cross-correlation analysis confirmed the positive association between 24-h variations in leptin and TSH after both sleep extension and sleep restriction (maximum cross-correlation coefficient, +0.71 ± 0.04 vs. +0.56 ± 0.04, P = 0.066).
Correlations between leptin and metabolic parameters.
No correlations between any of the parameters quantifying the leptin and glucose/insulin/HOMA profiles could be detected in this group of lean young subjects who maintained stable body weight across the study period.
Leptin, cortisol, and HOMA profiles under an 8-h bedtime condition.
Nine of the 11 subjects participated in a separate study with 8-h bedtime, 1 yr later, using the same experimental procedures. The weight of the subjects did not change significantly over this time interval (75.3 ± 2.0 kg vs. 76.1 ± 1.8 kg 1 yr later). Interestingly, as summarized in Table 2, leptin, cortisol, and HOMA data observed with 8-h bedtime were intermediate between those recorded under 4-h and 12-h bedtime conditions (Fig. 5).
Leptin, cortisol, and HOMA variables during baseline, sleep restriction, and sleep extension
| Time allocated to sleep (h) | P level | |||
|---|---|---|---|---|
| 4 | 8 | 12 | ||
| Leptin | ||||
| 24-h levels (ng/ml) | 3.3 ± 0.6 | 4.1 ± 1.1 | 4.3 ± 0.9 | 0.056 |
| Amplitude of the 24-h rhythm (ng/ml) | 1.0 ± 0.2 | 1.2 ± 0.3 | 1.4 ± 0.3 | 0.014 |
| Value of the nocturnal acrophase (ng/ml) | 3.8 ± 0.8 | 4.4 ± 1.2 | 5.5 ± 1.2 | 0.003 |
| Cortisol | ||||
| Mean 1600–2100 h levels (μg/dl) | 6.1 ± 0.4 | 5.3 ± 0.4 | 4.4 ± 0.3 | 0.003 |
| Timing of the nadir | 2 h 06 ± 12 min | 1 h 03 ± 20 min | 0 h 38 ± 25 min | 0.013 |
| Relationship between leptin and cortisol profiles | ||||
| Lag between leptin acrophase and cortisol nadir | 4 h 15 ± 57 min | 2 h 48 ± 69 min | 1 h 00 ± 41 min | 0.031 |
All results are expressed as mean ± sem. To convert cortisol values in metric units (μg/dl) to Sl units (μmol/liter), multiply by 0.028.
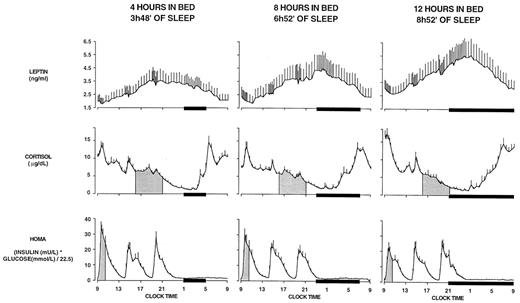
Mean (+sem) 24-h leptin, cortisol, and HOMA profiles with 4-h, 8-h, and 12-h bedtimes. Note that the relative synchronization of the leptin and cortisol profiles in the study with 8-h bedtimes was intermediate between that observed with 4-h bedtimes and that observed with 12-h bedtimes. Similarly, the HOMA response to breakfast gradually increased from the 12-h bedtime condition to the 4-h bedtime condition, with an intermediate response during the 8-h bedtime condition. Black bars, Sleep periods. To convert cortisol values in metric units (μg/dl) to SI units (μmol/liter), multiply by 0.028.
Variability in assay parameters did not allow for meaningful comparisons of TSH profiles. A technical update of the monitoring equipment for measurements of heart rate variability prevented a valid comparison of profiles of rRR between the study with 4-h and 12-h bedtimes and the study with 8-h bedtimes performed 1 yr later.
Discussion
The present study demonstrates unequivocally that sleep duration plays an important role in the regulation of human leptin levels and diurnal variation. The comparison of leptin profiles in the same subjects studied with 4-h, 8-h, and 12-h bedtimes revealed that daytime and nighttime leptin levels and the amplitude of the diurnal variation decrease when sleep duration is restricted in the absence of changes in body weight. Relative to a fully rested condition (12-h bedtimes), 6 d of 4-h bedtimes in healthy young subjects were associated with a 26% decrease in maximal leptin levels. By comparison, 3 d of dietary restriction at 70% of energy requirements (a caloric deficit of approximately 900 kcal/d) in healthy lean volunteers has been reported to result in a decrease of leptin levels averaging 22% (4).
Because our experimental protocol was designed to keep energy intake and activity levels as constant as possible across bedtime conditions, it appears that sleep restriction may alter the ability of leptin to accurately signal energy balance and to produce an internal misperception of insufficient caloric intake when caloric requirements are adequately met. Alternatively, it is possible that the decrease in leptin levels after sleep restriction reflects a normal adaptation to the increased caloric need associated with extended wakefulness. Studies involving accurate measures of energy balance in subjects submitted to chronic partial sleep loss under comfortable sedentary conditions will be necessary to exclude the possibility that a state of sleep debt involves a significant increase in energy expenditure. It is also conceivable that the leptin response to longer term changes in sleep duration may be different from that observed after approximately 1 wk of restricted or extended bedtimes, as in the present study. Preliminary findings from a population study involving 1024 subjects are, however, in complete agreement with our observations, because restricted sleep duration was found to be associated with reduced leptin levels independently of BMI (45).
It has been recently suggested that the central nervous system senses not only the absolute levels of circulating leptin but also the amplitude of the diurnal rhythm and that the amplitude of the rhythm contributes to increase the satiety signal (46, 47). Our observations that recurrent sleep restriction decreases not only the levels, but also the amplitude of the leptin rhythm, further suggest an adverse impact of sleep loss on appetite regulation. A reduction in amplitude of the leptin rhythm has also been recently reported in subjects submitted to acute total sleep deprivation. However, in contrast to chronic partial sleep restriction, acute total sleep deprivation did not result in a decrease of mean leptin concentrations (48). In a recent follow-up study (49), we have shown that 2 d of bedtime restriction (4 h) compared with 2 d of bedtime extension (10 h) in healthy young adults result in an 18% decrease of leptin levels, a 28% elevation in total ghrelin levels, and increased hunger (+24%) and appetite (+23%). The decrease in leptin levels was a significant predictor of the magnitude of the increase in hunger. These observations confirm and extend the findings of the present study and indicate that the modulation of leptin regulation by sleep is paralleled by alterations in appetite regulation.
The present study further reveals that alterations of the 24-h leptin profile resulting from sleep restriction in healthy individuals studied under conditions of stable caloric intake and activity levels are concomitant with an increase in cardiac sympathovagal balance and are quantitatively associated with specific alterations of the 24-h profiles of plasma cortisol and TSH. Alterations of morning glucose tolerance also occur concomitantly but do not appear quantitatively related to the changes in leptin profiles.
Inhibition of leptin release due to increased sympathetic nervous outflow is a possible mechanism underlying the decrease of leptin levels during chronic partial sleep loss. Our observation of decreased leptin levels and increased cardiac sympathovagal balance in the sleep debt condition is consistent with the approximately 20% reduction in leptin levels reported after stimulation of sympathetic nervous activity by isoproterenol in humans (50). Controversy, however, remains regarding the effect of sleep loss on the sympathetic nervous system. Although some studies have shown that sleep deprivation is not associated with sympathetic nervous system activation (51, 52), multiple other studies have shown increases in markers of sympathetic nervous activity in conditions of experimental or pathological sleep loss (18, 19–22, 53, 54). The data obtained in the present study are consistent with these latter observations. There are nevertheless limitations to this straightforward interpretation of the concomitant decreases in heart rate variability and in leptin levels observed in our sleep-deprived subjects. First, similar to other measures of cardiac sympathovagal balance derived from the analysis of beat-to-beat intervals, rRR is not a specific marker of sympathetic tone but rather reflects the balance between the sympathetic and parasympathetic control of the heart (44). Thus, the elevated rRR values observed in the state of sleep debt could represent increased sympathetic tone but could also partly reflect decreased vagal tone. Second, it is not known whether sleep loss induces commensurate increases in sympathetic activity at all peripheral sites, and therefore, the relationship between elevated sympathovagal balance at the level of the heart and the sympathetic outflow to adipose tissue is uncertain. Irrespective of these caveats, the demonstration of increased cardiac sympathovagal balance in healthy young individuals submitted to semichronic partial sleep restriction strongly suggests that sleep loss has an adverse impact on cardiovascular function.
Consistent with previous reports (26), leptin and cortisol levels varied in a mirror image throughout the 24-h cycle when the subjects were fully rested, and maximum leptin levels were essentially aligned with minimum cortisol concentrations. This inverse relationship was disrupted after sleep restriction as leptin levels stopped rising in the early evening, when cortisol concentrations were still declining, and the curtailment of the leptin elevation was quantitatively associated with an elevation of evening cortisol levels. These observations further support the existence of interactions between the physiologic regulation of leptin and cortisol (27). The negative association between changes in leptin and cortisol during sleep restriction could reflect the well-documented suppressive effect of leptin on hypothalamo-pituitary-adrenal activity (1, 27, 55). Glucocorticoids increase food intake (24, 25). In the present study, the evening period was associated with elevated cortisol levels in the face of decreased leptin concentrations, suggesting that appetite and food intake may be stimulated by sleep loss in the later part of the day.
Alterations of both cortisol regulation and sympathovagal balance, the two major neurobiological transmitters of the stress response, were evident when the subjects were studied after 6 d of sleep restriction. Taken together, these observations suggest that sleep restriction or prolonged wakefulness resulted in an activation of at least some of the biological mechanisms involved in the stress response. However, even though sleep loss appeared to be interpreted biologically as a stressor, subjectively, the subjects did not experience sleep restriction as stressful because they consistently rated their perceived stress as low, irrespective of the bedtime condition.
The effects of sleep restriction on the 24-h profiles of leptin and TSH were remarkably similar. We found that nighttime levels were reduced for both hormones in a commensurate fashion. Unlike the lack of clarity with the regulation of cortisol, the weight of current evidence regarding the interaction between leptin and the thyrotropic axis favors the interpretation that the alterations of TSH profiles result from the alterations of leptin profiles, rather than the opposite. Indeed, TRH neurons may be regulated by leptin (1), and a stimulatory effect of leptin on TSH release has been shown in rodents (56, 57) and suggested in humans (32). In contrast, most studies examining the possible role of physiological concentrations of thyroid hormones on leptin regulation have reported negative findings (58, 59). The observation in the present study of qualitatively similar and quantitatively correlated alterations of leptin and TSH levels during sleep restriction therefore provides compelling evidence for a role for leptin in the physiological regulation of the thyrotropic axis.
Sleep curtailment is becoming increasingly prevalent in modern society. By self-report, sleep duration in America has decreased by one to 2 h during the second half of the 20th century (60, 61). Over the same time period, the incidence of obesity has nearly doubled (62). Recent epidemiological studies have found an association between self-reported sleep duration and BMI (63–66). Our previous findings (30), taken together with the observations from the present study, indicate that chronic partial sleep loss is associated with decreased glucose tolerance, decreased leptin levels, increases in evening cortisol levels, and adverse cardiovascular effects. This constellation of negative consequences is consistent with epidemiologic evidence for a link between sleep duration and obesity and suggest that further studies of sleep loss as a possible factor for obesity and the metabolic syndrome are warranted.
Acknowledgments
We thank the volunteers for their participation in this demanding study and the nursing staff of the University of Chicago General Clinical Research Center for their expert assistance.
This work was partially supported by grants from the Mind-Body Network of the Mac Arthur Foundation (Chicago, IL), from the National Institutes of Health (NIH) (DK-41814 and AG-11412), and from the Belgian Fonds de la Recherche Scientifique Médicale. Leptin assays were performed by Paul Rue under the auspices of the University of Chicago Diabetes Research and Training Grant (NIH DK-20595). The University of Chicago General Clinical Research Center is supported by NIH Grant MO1-RR-00055.
Abbreviations:
- BMI,
Body mass index;
- HOMA,
homeostasis model assessment;
- REM,
rapid eye movement;
- rRR,
autocorrelation coefficient of consecutive interbeat intervals;
- SI,
Systeme International (units);
- SWS,
slow wave sleep.
References
Spiegel K, Tasali E, Penev P, Van Cauter E, Sleep curtailment in healthy young men is associated with decreased leptin levels, elevated ghrelin levels and increased hunger and appetite. Ann Intern Med, in press
National Sleep Foundation
