


Abstract
Thyroid hormones are essential for the regulation of developmental and physiological processes. The genetic factors underlying naturally occurring variability in mammalian thyroid function are, however, only partially understood. Genetic control of thyroid function can be studied with animal models such as the inbred Wistar-Kyoto (WKY) rat strain. Previous studies established that WKY rats have elevated TSH, slightly elevated total T3, and normal total T4 levels compared with Wistar controls. The present study confirmed a persistent 24-h elevation of TSH in WKY rats compared with the Fisher 344 (F344) rat, another inbred strain. Acute T3 challenge (25 μg/100 g body weight ip) suppressed serum TSH and T4 levels in both strains. Quantitative trait locus analysis of elevated TSH in a reciprocally bred WKY × F344 F2 population identified one highly significant locus on chromosome 6 (LOD = 11.7, TSH-1) and one suggestive locus on chromosome 5 (LOD = 2.3, TSH-2). The confidence interval of TSH-1 contains the TSH receptor and type 2 deiodinase genes, and TSH-2 contains the type 1 deiodinase gene. The WKY alleles of each gene contain sequence alterations, but additional studies are indicated to identify the specific gene or genes responsible for altered regulation of the thyroid axis. These findings suggest that one or more genetic alterations within the TSH-1 locus significantly contribute to the altered thyroid function tests of the WKY rat.
THYROID HORMONES REGULATE a variety of physiological processes, including nervous system development and adult metabolism, cardiac output, glucose balance, and immune and reproductive function. Most investigations of the genetics of hypothalamic-pituitary-thyroid (HPT) axis function focus on single-gene disorders, but recent studies examined the influence of quantitative genetic variation in normal populations. Genetic factors were found to account for one quarter to two thirds of the normal phenotypic variation in thyroid axis hormone measures (1), and genetic polymorphisms in several genes were associated with normal variation in HPT axis hormones (2). Quantitative traits such as these can be investigated with experimental crosses between inbred rodent strains that simulate an outbred population. Genetic techniques such as quantitative trait locus (QTL) analysis can be applied to such a cross to identify chromosomal regions contributing to the variance within a phenotype (3).
The inbred Wistar-Kyoto (WKY) rat strain was identified as hormonally and behaviorally responsive to stress (4). Investigations of their thyroid axis function revealed that WKY rats have abnormally high serum TSH but normal serum total T4 (tT4) in comparison with Wistars, their outbred progenitor strain (5). The TSH elevation is persistent throughout the 24-h cycle in WKY rats, with an exaggerated peak at 1200 h (6). Additionally, a smaller elevation in serum tT3 levels is often seen (5, 6). Despite the elevated tT3, mRNA levels of prepro-TRH (ppTRH) are normal in the WKY rat hypothalamus, as are mRNA levels of the prohormone convertases PC1 and PC2, which cleave ppTRH and are negatively regulated by T3 (7, 8). Induction of chronic hyper- and hypothyroid states in WKY rats elicit appropriate hormonal responses, although TSH levels rose higher in response to hypothyroidism in WKY rats than in Wistar controls (5), a finding that is consistent with the elevated TSH in euthyroid WKY rats.
Although an increase in basal TSH might be expected to elevate T3 levels, it is not obvious how it could be doing so without also increasing T4 levels. Thus, we further characterized the WKY phenotype in comparison with a phenotypically and genotypically distinct strain, the inbred Fisher-344 (F344) rat (9). We analyzed the circadian rhythm of serum TSH, tT3, and tT4 levels in WKY and F344 rats, and performed an acute T3 challenge to gauge the responsiveness and kinetics of the WKY rats’ TSH to T3 suppression. Importantly, the WKY thyroid phenotype does not mimic any known monogenic thyroid axis disorder. Therefore, we hypothesized that the WKY dysregulation of TSH secretion is either polygenic or the consequence of a previously unrecognized modifier of HPT function. We took a genetic approach and employed QTL analysis, a powerful method that identifies genetic loci affecting a continuous trait of interest (10). WKY and F344 animals were reciprocally bred to produce 486 F2 intercross progeny. QTL analysis was performed on the F2 generation to identify genetic loci that significantly contribute to elevated TSH levels in WKY rats.
Materials and Methods
Animal husbandry
All animal experimentation was approved by the Northwestern University Animal Care and Use Committee. Animals were obtained from Harlan Sprague Dawley (Indianapolis, IN) at 8–10 wk of age (males, 200–250 g; females, 150–200 g) and maintained in a 14:10-h light:dark cycle under constant ambient temperature (21 ± 1 C) with food and water available ad libitum. Animals newly obtained for use in experiments were allowed to rest for 2 wk after shipping and were handled during that period to reduce handling stress for the experiment.
Blood collection and RIA
In each experiment, the indicated amount of whole blood was collected into EDTA-coated tubes (2 mg/1.5-ml tube) and spun at 4 C, and serum was collected and stored at −80 C for later RIA. RIA for TSH was carried out as described in Rittenhouse and Redei (11). Standards and specific antiserum were obtained from Dr. Parlow at the National Hormone and Peptide Program (National Institute of Diabetes and Digestive and Kidney Diseases, Baltimore, MD). Rat TSH RP-3 (lot no. AFP5512B) was used for the iodination and standards. Assay sensitivity was 1.0 pg/tube with an intraassay coefficient of variation of 10.5%. RIAs for tT3, free T3 (fT3), tT4, and fT4 were performed with ImmuChem coated tubes from ICN Pharmaceuticals/MP Biomedicals (Costa Mesa, CA), using the protocols provided. Sensitivity limits and intraassay coefficients of variation were 6.7 ng/dl, 4.5% for tT3; 0.76 μg/dl, 8.1% for tT4; 0.06 pg/ml, 3.6% for fT3; and 0.045ng/dl, 3.8% for fT4.
The 24-h secretion of HPT hormones
Adult male F344 and WKY rats (n = 8 and 6) were weighed and implanted with a jugular cannula as previously described (6). The 24-h bleed took place 2 d after the surgery. Blood samples were collected at 0800, 1100, 1400, 1700, 2000, 2200, 0030, 0300, 0600, and 0800 h. At each time point, 0.6 ml of blood was collected, and the same amount of donor blood was given back to each animal. A repeated-measures one-way ANOVA was used to determine the statistical significance in hormone levels across the 24-h period between WKY and F344 rats. A Bonferonni post hoc test was used to determine specific time points where statistical differences were seen.
Acute T3 challenge
Adult male WKY and F344 rats (n = 25 and 26) were weighed and injected with T3 (25 μg/100 g body weight) or saline ip between 1100 and 1500 h, and 4–8 ml of trunk blood was collected 3 or 24 h after injection. Data were analyzed for significance by two-way ANOVA with Tukey honestly significantly different post hoc tests performed for each pair of groups.
QTL analysis: comparison strain selection, animal breeding, and phenotyping
Hormonal studies of the adrenal system in WKY indicated that the F344 strain could be an appropriately phenotypically different strain (9). The Rat Genome Database (http://rgd.mcw.edu) reported a global polymorphism rate of 68% and a useful polymorphism rate (>2 bp) of 54% between WKY and F344. Preliminary studies (unpublished; Table 1 is representative) of the thyroid axis found that the F344 strain had TSH values low enough to be a good comparison strain with WKY animals.
Summary of TSH values for parent, F1, and F2 generations
| Strain/cross | Male | Female | ||||
|---|---|---|---|---|---|---|
| Mean TSH (ng/ml ± sd) | n | Mean TSH (ng/ml ± sd) | n | |||
| F344 | 2.23 ± 0.62a,b | 16 | 1.13 ± 0.07a | 15 | ||
| WKY | 5.28 ± 1.16c | 16 | 3.00 ± 0.21 | 15 | ||
| F1 | 2.88 ± 0.81c | 44 | 1.36 ± 0.09 | 36 | ||
| F mother | 2.78 ± 0.23 | 18 | 1.07 ± 0.13 | 11 | ||
| W mother | 2.95 ± 0.14 | 26 | 1.49 ± 0.10 | 25 | ||
| F2 | 2.11 ± 1.05c | 237 | 1.22 ± 0.04 | 208 | ||
| F grandmother | 2.10 ± 1.16 | 120 | 1.11 ± 0.06 | 103 | ||
| W grandmother | 2.12 ± 0.94 | 117 | 1.33 ± 0.06 | 105 | ||
P < 0.001 between WKY and F344 strain.
P< 0.05,
P < 0.001 between males and females of that strain or generation.
Parental WKY and F344 animals were bred reciprocally (WKY females mated with F344 males and vice versa), pairing one male with two females, to generate 121 F1 animals. Dominance was calculated (Possidente, B., personal communication) using t tests: a two-tailed significant difference between the F1 value and the midpoint between the parental values indicates that one of the alleles is dominant; another t test comparing F1 and the dominant parent means determines whether the dominance is partial or complete. Sister-brother breeding of both lineages (WKY mother and F344 mother) of F1s generated 486 F2 generation animals. Pups were weaned at 24 d of age, separated by sex and housed three to five animals per cage. At weaning, 5-mm tail samples were collected for isolation of genomic DNA.
Serum was collected from F2 generation animals at 14 wk of age using the tail-cut method (12, 13). Samples were collected between 1300 and 1500 h, when TSH levels are highest (Fig. 1A). Within 2 min of removal from the cage, animals were placed into a restraining bag, tails were nicked, and blood samples were collected on ice.
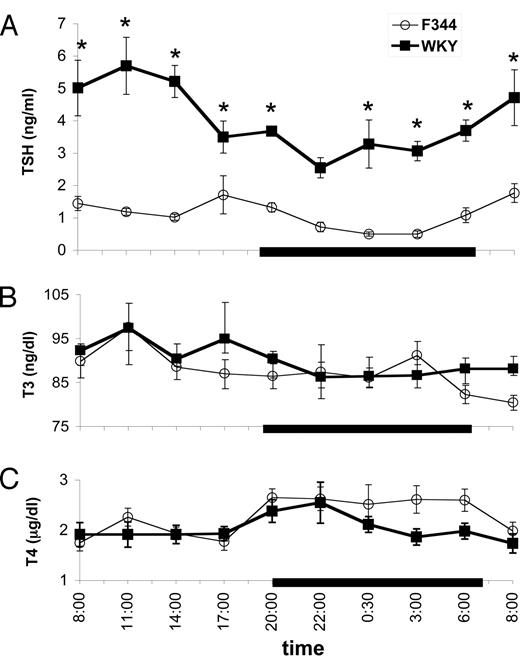
Twenty-four-hour profiles of serum TSH (ng/ml; A), tT3 levels (ng/dl; B), and tT4 levels (μg/dl; C) in male WKY and F344 rats. All values are means ± sem of five to eight animals per strain at each time point. The dark bar along the x-axis represents the dark phase (2000–0600 h CDT). *, P < 0.05 by Bonferroni post hoc test, WKY vs. F344.
QTL analysis: genotyping
Genomic DNA was extracted from tail samples of F2 animals by phenol-chloroform extraction. For the initial genome scan, 108 simple-sequence-length polymorphism markers polymorphic by at least 2 bp between WKY and F344 strains were chosen with the Genome Scanner tool at the Rat Genetic Database, Medical College of Wisconsin (Milwaukee, WI) (http://rgd.mcw.edu), and purchased from Research Genetics (Huntsville, AL). Markers were spaced an average of 16 centimorgans (cM) (range, 2–27 cM) apart. For the later fine-mapping genome scans, additional markers were chosen to closely flank the region identified by the first genome scan. Markers with interstrain differences under 12 bp were amplified in PCR of 5 μl and visualized by overnight autoradiography on 6% polyacrylamide gels, as previously described (14). Markers with interstrain differences larger than 12 bp were amplified in PCR of 20 μl (2 μl DNA, 50 ng/μl; 2 μl 10× PCR buffer; 1.6 μl dNTP, 1.25 mm; 1.2 μl MgCl2, 25 mm; 2 μl BSA, 10 mg/ml; 10.7 μl ddH2O; 0.2 μl forward primer, 100 μm; 0.2 μl reverse primer, 100 μm; and 0.5 U Taq polymerase, as used in the acrylamide procedure) and visualized on agarose gels (NuSieve or GenePure, ISC Bioexpress, Kaysville, UT) using ethidium bromide staining (12–17 bp difference, 4%; 18 bp or greater, 3%).
QTL analysis: genome scans
Standard genome scans controlling for sex and lineage differences were performed using the pseudomarker 0.91 software package (15). TSH values were log-transformed [log(x + 1)] to minimize skew. Significance thresholds were established using permutation analysis (16). QTLs considered significant exceeded the 0.05 genome-wide adjusted threshold (LOD = 4.0), and suggestive QTLs exceeded or approached the 0.10 genome-wide adjusted threshold (LOD = 2.8) (17). Because the covariates of sex and lineage had a large effect on other traits studied in this cross (18), scans were also performed using sex and lineage as additive or interacting covariates. Complete data files and analysis scripts for the analyses carried out here are available at http://www.jax.org/research/churchill.
A pairwise search strategy was employed to search for epistatic interactions between QTL (19, 20). Significant interaction was determined by requiring a joint LOD greater than 11 and significance level of the interaction component alone at P < 0.001.
Sequencing and analysis of candidate genes
Markers were designed with the Primer3 program (http://frodo.wi.mit.edu/cgi-bin/primer3/primer3_www.cgi) to cover the target region with approximately 100-bp overlap between amplicons and at either end and were ordered from Integrated DNA Technologies (Coralville, IA). PCRs were performed with Platinum PCR Supermix from Invitrogen (Carlsbad, CA), and products were purified with the QIAquick PCR purification kit from QIAGEN (Valencia, CA) and sequenced in both directions by ACGT Inc. (Wheeling, IL). Sequences were aligned using the Sequencher program from GeneCodes (Ann Arbor, MI) and compared with published sequences (accession nos.: TSHR, M34842; DIO2, U53505; DIO3, NM_017210) obtained from GenBank (http://www.ncbi.nlm.nih.gov/) or genomic sequences (Rat Gerome Sequenchs Consortium version 3.1, July 2003) obtained from University of California, Santa Cruz (http://genome.ucsc.edu).
Results
Diurnal secretion of TSH, tT4, and tT3 in WKY and F344 rats
The diurnal secretion of serum TSH, tT3, and tT4 were measured in freely moving WKY and F344 males 2 d after jugular cannulation. Blood was taken every 2–3 h for a 24-h period, and repeated-measures ANOVAs were performed on TSH, tT3, and tT4 levels. TSH levels (Fig. 1A) were higher in WKY than F344 rats (strain, F9,108 = 104.8; P < 0.001) and had a circadian rhythm (time, F9,108 = 5.7; P < 0.001) that differed between the strains (strain × time, F9,108 = 2.9; P = 0.005). Levels of TSH were significantly higher in WKY relative to F344 rats at each time point sampled except at 2200 h (Bonferroni multiple comparisons), similar to a previous study comparing the WKY to the Wistar strain (6).
WKY rats showed a trend toward higher levels of tT3 relative to F344 rats (Fig. 1B), consistent with some earlier findings (5). Total T3 was subject to a circadian rhythm (time, F9,70 = 3.8; P = 0.001); the difference between the strains’ rhythms approached significance (strain × time, F9,70 = 2.0; P = 0.06). There was a detectable circadian rhythm in tT4 secretion (time, F9,104 = 3.4; P = 0.001), but there were no significant differences in serum tT4 levels between WKY and F344 rats (Fig. 1C).
T3-induced suppression of TSH and tT4 in WKY and F344 rats
Male WKY and F344 animals were acutely challenged with supraphysiological doses of T3 and responses of TSH, tT3, tT4, fT3, and fT4 were assayed at 3 h (1500–1700) and 24 h (1200–1500) after challenge. Results (Fig. 2) were analyzed by three-way ANOVA.
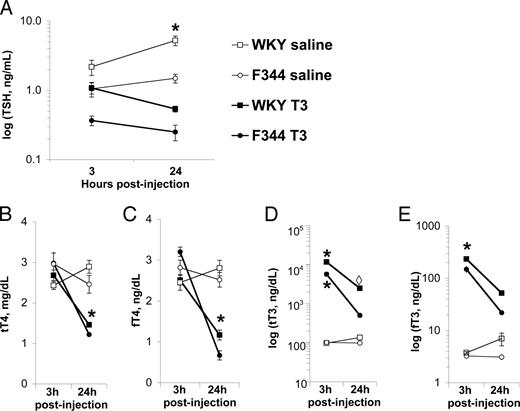
Hormonal responses to acute T3 challenge in male WKY and F344 rats. Values are means ± sem of five to seven animals per data point, and group comparisons were done with the Tukey post hoc test, A, Serum TSH (ng/ml); *, P < 0.001, WKY controls at 24 h post injection have TSH significantly higher than all other groups. B, Serum total T4 (tT4; μg/dl); and C, Free T4 (fT4; ng/dl). 24 h post-T3 treatment, WKY and F344 tT4 and fT4 levels are not different, but do significantly differ from all other groups (*, P < 0.001). D, Serum total T3 (ng/dl) and E) free T3 (fT3, ng/dL). At 3 h post-treatment, T3-treated WKY and F344 significantly differ from each other and from all other groups (*, P < 0.01); at 24 h, T3-injected WKY total T3 levels significantly differ from all except the corresponding treatment group (224 P < 0.05, P = 0.061 between F344 and WKY tT3 24 h), but free T3 levels in both strains are not significantly different after 24 h.
At both time points, TSH (Fig. 2A) was higher in WKY than in F344 rats (strain, F7,34 = 30.0; P < 0.001) and lower in T3-treated animals compared with controls (treatment, F7,34 = 51.7; P < 0.001). There was an effect of time, likely because of circadian rhythmicity, on TSH levels (time, F7,34 = 7.0; P = 0.012) that was stronger in WKY animals (strain × time, F7,34 = 4.172; P = 0.049). The midday TSH peak seen in the circadian rhythm study was also seen in control WKY animals as illustrated in Fig. 1A (strain × time × treatment, F7,34 = 8.1; P = 0.008).
There were no strain differences in tT4 levels (Fig. 2B; F7,34 = 0.4; P = 0.544) or fT4 levels (Fig. 2C; F7,39 = 0.7; P = 0.417). T3 suppressed tT4 and fT4 levels equally in both strains (treatment × strain: total, F7,34 = 0.6, P = 0.432; free, F7,39 = 0.02, P = 0.896). This effect was not evident at 3 h but was clearly demonstrable at 24 h after injection (treatment × time: total, F7,34 = 39.6, P < 0.001; free, F7,39 = 68.8, P < 0.001).
Post-injection T3 levels in WKY rats
Predictably, injection of T3 raised total (Fig. 2D) and free (Fig. 2E) T3 levels in both strains immediately (treatment: total, F7,34 = 292.9, P < 0.001; free, F7,39 = 102.9, P < 0.001), but the increase in T3 in the WKY rat was much higher. After 24 h, and despite the injection of identical doses of T3 per gram body weight, tT3 and fT3 levels were higher in WKY compared with F344 rats (time: total, F7,34 = 153.2, P < 0.001; free, F7,39 = 49.7, P < 0.001) (strain × treatment: total, F7,34 = 41.5, P < 0.001; free, F7,39 = 6.5, P = 0.015). The rate of change in tT3 between 3 and 24 h after injection differed between strains, with F344 rats showing a 10-fold decrease and WKY rats showing only a 5-fold decrease.
TSH levels in a WKY × F344 F2 intercross
Although TSH and tT3 were significantly different between the strains in both sexes, TSH was chosen as the phenotype to be analyzed by QTL because the differences are larger than those in tT3 levels. Male and female WKY and F344 animals were purchased from Harlan (Indianapolis, IN) to serve as the QTL parent generation, and TSH was measured by RIA in each generation. Reciprocal breeding (F344 mother × WKY father and WKY mother × F344 father) was used to create strain-specific lineages.
As in previous studies (5, 6), parental generation WKY rats had higher TSH levels than F344 animals, both as a group and when analyzed by sex. Three-way ANOVA (sex, lineage, and generation) was performed upon all animals: WKY and F344 parents, F1 males and females with WKY or F344 mothers, and F2 males and females with WKY or F344 grandmothers. Table 1 gives, for each generation, the number of male and female animals, their TSH levels, and differences between groups as calculated by Tukey post hoc test. There were significant main effects of all three factors and of all interactions except sex × lineage (generation × lineage × sex, F11,575 = 4.8; P = 0.009). As expected, and in all generations including the parental strains, males had higher TSH levels than females of their group (sex, F11,575 = 190.3; P < 0.001).
WKY and F344 animals were reciprocally bred to produce 121 F1 animals. F1 males and females still showed the sex difference and had low TSH levels; dominance calculations (see Materials and Methods) revealed that the F344 phenotype was partially dominant (F1 vs. midpoint: t = 3.19, P = 0.003; F1 vs. F344: t = –2.09, P = 0.041). F1 animals were brother-sister mated to produce 486 F2 generation animals. The sex difference and dominance of the F344 phenotype persisted in the F2 generation.
Genome scan of the F2 generation
Basal serum TSH values of adult F2 progeny were log-transformed to reduce skew, and all analyses are reported on the transformed trait. Genome scans were run with sex and lineage as additive covariates as described previously (21) to account for the observed differences in these groups of rats. We found no evidence for QTL × covariate interaction for either sex or lineage (18, 21). Initial whole genome scans identified one highly significant locus (P < 0.0001) with LOD score of 11.125, located at 55 cM on chromosome 6 (chr6) (Fig. 3). One suggestive locus (peak LOD 2.25) was identified on chr5 at 65 cM. Additional markers flanking the chr6 region were genotyped (Fig. 4), which revealed that the locus is centered near D6Rat103 with a peak LOD of 13.5 and a 95% confidence interval of approximately 10 cM. Pairwise genome scans identified no epistatic interactions.
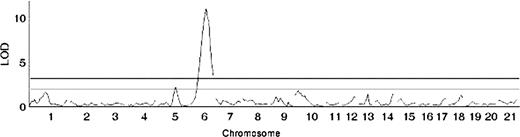
Whole genome scan of all F2 generation animals for log(TSH) with chromosomal location on the x-axis and LOD score on the y-axis. The upper line indicates the significant (LOD = 4.0) and the lower line indicates the suggestive (LOD = 2.8) threshold.
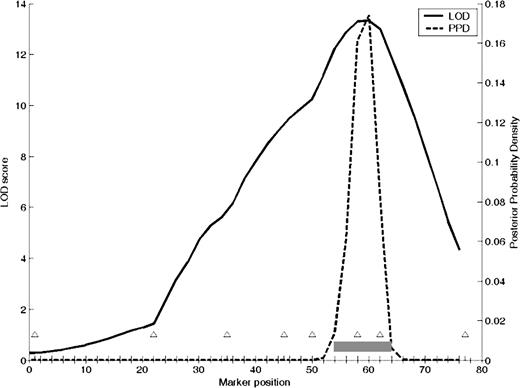
Fine-map scan of additional markers on chr6 for log(TSH). Centimorgans are on the x-axis, and triangles represent markers. LOD y-axis is on the left, and the solid line plots results of interval mapping of chr6. Posterior probability density is plotted along the right y-axis and is represented with a dotted line. The gray bar represents the confidence interval of the locus. PPD, Posterior probility density.
The F2 population was divided by sex, lineage, and genotype at the chr6 locus (homozygous F344, FF; homozygous WKY, WW, or FW, heterozygous) to create allele effect plots (Fig. 5). The WKY allele had an additive, dose-dependent effect on TSH levels of F2 females from a F344 grandmaternal lineage, with each WKY allele increasing TSH levels (P = 0.003). However, in F2 females from a WKY lineage, there was no significant effect of genotype; all had TSH levels comparable to those of a F344-lineage F2 female with two WKY alleles (P = 0.45). In both lineages, TSH levels were higher in WW homozygote males than in either the FF homozygotes or FW heterozygotes.
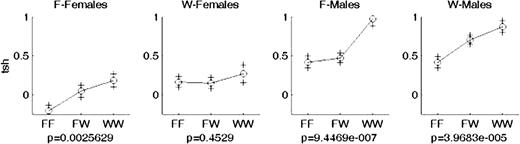
Allele effect plots for the chr6 locus affecting log(TSH), with F2 population separated by lineage and sex. F and W stand for F344 or WKY lineage or allele depending on context. Genotypes are along the x-axis (FF, F344 homozygote; WW, WKY homozygote; FW, heterozygote), and log(TSH) values are along the y-axis with P values reported below each graph.
To assess the contribution of these covariate-QTL interactions, the interaction terms (chr6 × sex and chr6 × lineage) were included in a multiple regression with both loci and both covariates. The individual terms for the chr6 × sex and chr6 × lineage interactions were not significant in the regression model (both at P = 0.07). When only significant components are included, the multiple regression model (Table 2) accounts for 37% of the total variance. (Table values are based on adjusted, type III, sums of squares, and the total variance explained will differ slightly from the sums of individual contributions.)
Multiple regression model of the TSH trait
| Source | F | p (F) | % Variance | LOD | Locus name |
|---|---|---|---|---|---|
| Sex | 148.67 | 00 | 22.06 | ||
| Lineage | 9.03 | 0.003 | 1.34 | ||
| Chr5 (65 cM) | 5.21 | 0.006 | 1.55 | 2.27 | TSH-2 |
| Chr6 (55 cM) | 28.28 | 2.8 × 10⁻¹² | 8.39 | 11.74 | TSH-1 |
| Full model: components | 00 | 37 | 41.63 |
Locus analysis
Marker positions in cM units were obtained from the Rat Genome Database (http://rgd.mcw.edu; SHRSP × BN cross) and were used in interval mapping and locus analysis. Using these distances, the confidence interval of the chr6 locus was 54–64 cM. The Rat Genome Database was used to identify flanking markers for this region to use in locus analysis with genomic databases; D6Rat18 (53.4 cM) and D6Rat119 (64.6 cM) were chosen. The region between these two markers is 18.1 Mb in length (http://genome.ucsc.edu, July 2003 freeze of rat genome) and contains 45 known genes. It represents most of a 25-Mb cluster of 61 known genes that ranges from 53–69 cM and is flanked by gene-free gaps on either side (11 Mb proximal and 8 Mb distal). Allowing that there may be some uncertainty in the confidence interval, we took this larger cluster with more natural boundaries as our locus, which we named TSH-1.
The suggestive chr5 QTL has a peak near marker D5Rat157 (64 cM) and a confidence interval that spans a region from 54–82 cM, corresponding to 53 Mb between flanking markers D5Rat149 and D5Rat93. The broad confidence region is typical of suggestive QTLs and contains 88 known genes. We named this QTL TSH-2.
Sequence alterations in prima facie candidate genes
The TSH receptor (TSHR) and the enzyme type II iodothyronine deiodinase (DIO2) are located in the TSH-1 locus. Type I deiodinase (DIO1) is located in the TSH-2 locus. These three genes are directly involved in TSH regulation and T3 availability, making them obvious candidate genes for a syndrome of inappropriate TSH secretion. The type III deiodinase enzyme (DIO3) is unmapped in the rat but is located 15–20 Mb downstream of the homologous location of TSH-1 in the human and mouse genomes. Because DIO3 could have a direct role in metabolism of T3, which may influence the elevated TSH levels, DIO3 was also considered as a candidate gene.
TSHR
The coding region of the TSHR cDNA was directly sequenced in three WKY and three F344 animals. No insertions or deletions were found, but 7 bp substitutions were identified in the WKY sequence compared with the F344 and the published sequence derived from the Fisher rat (Table 3). Three of these substitutions are nonsynonymous, resulting in amino acid substitutions in the coding region of the TSHR. One of these, a G→A transition at nucleotide 1637 resulting in a change from arginine to histidine at amino acid 528, is located within the second intracellular loop and has been found in a human family with TSH abnormalities (22). Two patients heterozygous for R528H had histories of adult-onset hyperthyroidism, and although functional expression of the mutant receptor did not result in increased constitutive activity, stimulated cAMP formation and [125I]TSH binding were reduced.
WKY and F344 sequence variations in the TSHR coding region
| Altered nucleotide | Amino acid position or change | Strains with alterationa |
|---|---|---|
| 111C→G | 19 | F344, WKY |
| 191A→G | Q46R | WKYb |
| 1095A→G | 347 | F344, WKY |
| 1331C→T | P426L | F344, WKY |
| 1617T→C | 521 | WKY |
| 1637G→A | R528H | WKY |
| 1809T→C | 585 | WKY |
| 1830T→C | 592 | WKY |
| 2019T→C | 655 | WKY |
| 2032G→A | ||
| 2033G→A | G660V | F344, WKY |
| 2034G→A | ||
| 2035G→A | K661I | F344, WKY |
| 2236A→G | T728A | WKY |
In comparison with the published FRTL-5/Fisher rat strain sequence.
SNP rs8164121, identified in SD × BN cross.
A second transition, A→G at nucleotide 191 that leads to a glutamine to arginine substitution at amino acid 46, is a recently identified nonsynonymous, single-nucleotide polymorphism (SNP) in the rat (http://www.ncbi.nlm.nih.gov/SNP/, ID no. 8164121). The altered amino acid is located in the extracellular region in an area thought to be a target for stimulating antibodies and directly adjacent to an eight-amino-acid sequence crucial for high-affinity TSH binding (23). The remaining variation, A→G at nucleotide 2236 resulting in threonine to alanine at amino acid 728, has not been reported in the human, rat, or mouse TSHR sequences. This amino acid is located within the intracellular C terminus, in which no activating or inactivating mutations have been found in human thyroid disorders (24); however, a nonsynonymous SNP in this region (Asp727Glu) was found to lower serum TSH in humans (2).
DIO1 and DIO2
In the rat, DIO1 is the primary deiodinase in peripheral tissues, and it converts T4 into T3 and rT3 at equal rates. DIO2, the primary brain deiodinase, produces predominantly T3 and is responsible for 25% of plasma T3 and 75% of brain tissue T3 (25). The coding regions and intron/exon junctions of the WKY DIO1 and DIO2 genes were sequenced from genomic DNA and found to be identical to published sequences.
DIO1 and DIO2 3′ untranslated region (UTR) and preoptic regulatory factor 1 (PORF-1)
All three deiodinase enzymes have a selenocysteine (SeC) residue in or near their functional site, without which they show no deiodinase activity (25). The SeC residue is coded for by UGA, the opal (OPA) stop codon. A stem-loop structure named the SeC insertion sequence (SECIS) element must be present in the mRNA at least 60 bp downstream from the target codon, and the appropriate trans-activating cofactors must also be present, for the OPA to code SeC. For this reason, and because mutations in noncoding mRNA can have functional effects (26), we sequenced the noncoding regions of the DIO1 and DIO2 mRNAs from genomic WKY DNA to look for alterations that might affect gene expression or function.
Although no rat mRNA containing the DIO2 coding region and a SECIS element has been described, complete mRNAs have been found in other species, and analysis of the genomic region downstream of the DIO2 gene found a SECIS element approximately 4.6 kb from the end of the coding region (http://genome.unl.edu/SECISearch.html) (27). No base pair substitutions were found in 1 kb of the promoter, the 5′ UTR, or the coding region of DIO2, but nine were found in the 4.9 kb of the 3′ UTR (Fig. 6). Three are known SNPs in the rat (dbSNP ID nos. 8164518, 8156256, and 8157932; http://www.ensembl.org/Rattus_norvegicus), four are identical to the mouse sequence at that nucleotide, and the remaining two are novel in the WKY rat. One of those alters an amino acid in the coding region of the PORF-1 gene, a putative transcription factor located between the coding region and SECIS element of the predicted 3′ UTR of DIO2 (28, 29). PORF-1 has been hypothesized to regulate DIO2 itself, and it contains two OPA codons that could be translated as SeC by the SECIS element 1.1 kb downstream (29). This nonsynonymous SNP is adjacent to a leucine zipper motif in PORF-1 and may alter its DNA binding. The second novel substitution is noncoding and is located between PORF-1 and the SECIS element.
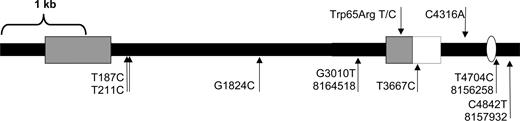
Sequence variation map of DIO2 cDNA. The nucleotide change and the distance relative to the TAG stop codon of DIO2 are indicated. Arrows above the map represent variations that are novel in the WKY strain compared with published rat and mouse sequences. The arrows below the map represent known sequence variations. Those labeled with only the position and nucleotide change are identical to the mouse sequence, and those known as SNPs in the rat are labeled with their SNP identifiers. The leftmost gray box represents the DIO2 coding region, the rightmost gray box the PORF-1 coding region, and the white box the PORF-1 3′ UTR. Black lines correspond to intronic sequences of DIO2 or the 3′ UTR. The white oval represents the SECIS element.
Three novel point alterations (in comparison with both published genomic sequence and mouse homologous sequence) were found in the 0.85-kb DIO1 3′ UTR: two between the stop codon and the SECIS element and one 10 bp downstream of the SECIS element (data not shown). Structural prediction of the secondary mRNA structure of the SECIS element (27) showed that the alteration nearest to it, a C→T transition, would create a non-Watson-Crick base pair (U-U) that could increase the stability of the nearest mRNA stem structure.
DIO3
DIO3 is found in brain and skin and is the most prevalent deiodinase in the placenta. It catalyzes the deiodination of T4 to rT3 and of rT3 to T2, thereby deactivating the active hormone (25). Because WKY rats have slightly elevated T3 and show persistently elevated T3 after T3 injection relative to F344 animals (Fig. 2), DIO3 function may be impaired in this strain. However, sequencing of the entire DIO3 (which consists of one exon) from genomic DNA revealed no alterations in coding or noncoding regions in comparison with the published sequence.
Discussion
Using QTL analysis of a segregating F2 generation of a reciprocal WKY × F344 cross, one locus, TSH-1, was identified on chr6. This single locus accounts for over 8% of the variance in F2 TSH levels and is highly significant with a LOD score of 11.7. QTL analysis usually identifies multiple genetic loci of smaller effect across a number of chromosomes; hence, the strength and singularity of the TSH-1 locus is remarkable. In comparison, the other locus influencing the trait, TSH-2, accounts for only 1.5% of the variance and is of suggestive significance (LOD = 2.3). Lineage, or parental origin, accounts for a similar low proportion of the variance. Sex accounts for over 20% of the variance but does so in a directly additive fashion, likely attributable to well-characterized general effects of gonadal steroid milieu on the HPT axis. Within the confidence interval of TSH-1, over 50 genes are mapped and over 100 cDNA SNPs identified. We focused our initial investigation on three obvious thyroid-related candidates within the region: the TSHR, DIO2, and DIO3 genes. The remaining deiodinase, DIO1, maps to the TSH-2 locus and was also considered a candidate gene.
A well-known cause of increased TSH with normal T4 is TSH resistance (30), such as that caused by partially inactivating human TSHR mutations. Compared with the published rat sequence, the TSHR contains three sequence alterations in its coding region, two of which are specific to the WKY strain (Table 3). Related amino acid changes reported in humans (2, 22) indicate that these TSHR alterations may partially inactivate the WKY TSHR and therefore could account for the elevated TSH component of the phenotype. Functional studies thoroughly characterizing the individual and composite effects of the three WKY polymorphisms are underway.
The three selenodeiodinases are of central importance in thyroid hormone metabolism. Two of them are mapped in the rat, DIO2 to TSH-1 and DIO1 to TSH-2. Although no coding region variants that alter deiodinase function have yet been described (2, 31, 32), mutagenesis of nonessential residues near the SECIS element strongly affects SeC incorporation (33). No alterations were found in the coding or noncoding regions of DIO3, but DIO2 contains alterations within its 3′ UTR. Any of these could potentially affect enzyme translation or activity, either through proximity to the SECIS element (33) or by altering mRNA structure, stability, or folding (2, 34). Furthermore, one of the alterations in the WKY DIO2 3′ UTR lies within the coding region of the putative transcription factor PORF-1, a gene embedded within the DIO2 mRNA between the DIO2 coding region and the SECIS element (29). The three 3′ UTR alterations found in the DIO1 gene of the WKY rat may also be of significance, because 3′ UTR SNPs in the human DIO1 gene are associated with altered plasma hormone ratios (2). We are currently investigating whether these DIO1 and DIO2 alterations contribute to the WKY phenotype. Although they may play a role in the unusual T4/T3 level pattern, it is not clear whether they could also be affecting TSH levels.
Based on the result of this study, genes outside the TSH-1 and TSH-2 loci are unlikely to play a major role in the pathogenesis of the elevated TSH level found in the WKY rat. This, and the comparison with other genetic disorders in the HPT axis (Table 4) illustrate that it has a distinct etiology. For example, resistance to thyroid hormone (RTH) (reviewed in Ref.35) is caused, in most instances, by dominant negative mutations in the TRβ gene on rat chromosome 15, which is located within neither locus. The hormonal profile of RTH is distinct and characterized by elevated TSH, T4, and T3 levels. In contrast, the WKY rat has an elevated TSH, but the T4 levels are normal. It is conceivable that the discrepant TSH andT4 levels could result from reduced TSH bioactivity (36), such as that caused by absence of TRH (37) or TSHβ subunit mutations (38). However, similar to the exclusion of RTH, the genetic linkage of the elevated TSH to chr6 and -5 rules out a monogenic cause linked to other chromosomes (TSHβ on chr2, ppTRH on chr4, and TRH receptors on chr7 and -19). However, idiopathic and/or multigenic cases of TSH resistance exist, and 28 families with TSH resistance in the absence of TSHR mutations have been identified to date (30). The unidentified genetic causes in those families may, at least in part, reside within our loci.
Genetic disorders of the HPT axis compared with the WKY rat
| Alteration | tT3 | tT4 | TSH | Ref. | |
|---|---|---|---|---|---|
| Human | |||||
| T3 resistance | ↑ | ↑ | ↑ to ↑↑↑ | 35 | |
| Reduced TSH bioactivity | Normal or ↓ | Normal or ↓ | ↑ | 36 | |
| TSH resistance (caused by partially inactive TSHR) | Normal to ↓ | Normal to ↓ | ↑ | 30 | |
| TSHR coding SNPs | Normal | Normal | Normal or ↓ | 2, 22 | |
| DIO1 3′ UTR SNPs | Altered ratios | Normal | 2 | ||
| Mouse | |||||
| TRH knockout (reduced TSH bioactivity) | ND | ↓ | ↑ | 37 | |
| DIO2 knockout | Normal | ↑ | ↑ | 39 | |
| Rat, WKY | Normal or ↑ | Normal | ↑ | 5, 6 | |
ND, Not determined.
In conclusion, using QTL analysis, we have successfully identified two genetic loci linked to the elevated TSH in the inbred WKY rat strain. The presence of the TSHR, DIO2, DIO1, and possibly DIO3 genes within the loci, together with the fact that three of these genes harbor alterations unique to the WKY rat, suggest that they are valid candidates involved in the pathogenesis of the abnormal phenotype. Alterations similar to those found in this study have been shown to affect function of these genes in other studies (2, 22, 33). It is important to recognize that none of the single gene alterations in the TSHR or the deiodinases could plausibly explain both components of the WKY phenotype, i.e. the TSH elevation that is not associated with an increase in T4 or the mild and transient T3 elevation that is independent of T4. It is possible that alterations in an unidentified gene within these loci may be contributing to the phenotype. Alternatively, the alterations identified here may act as a haplotype with each other or in combination with unknown alterations.
This work was supported by MH060789 to E.R. and MH066658 to A.E.B.
J.S.T. is an investigator in the Howard Hughes Medical Institute.
Abbreviations
- Chr6,
Chromosome 6;
- cM,
centimorgans;
- DIO1,
type I deiodinase;
- fT3, free T3; HPT,
hypothalamic-pituitary-thyroid;
- OPA,
opal;
- PORF-1,
preoptic regulatory factor 1;
- ppTRH,
prepro-TRH;
- QTL,
quantitative trait locus;
- RTH,
resistance to thyroid hormone;
- SeC,
selenocysteine;
- SECIS,
SeC insertion sequence;
- SNP,
single-nucleotide polymorphism;
- TSHR,
TSH receptor;
- tT4, total T4; UTR,
untranslated region;
- WKY,
Wistar-Kyoto.
