


Abstract
To compare the impact on thrombin generation of the new combined oral contraceptive containing 15 mg estetrol and 3 mg drospirenone with ethinylestradiol (30 or 20 mcg) associated either with 150 mcg levonorgestrel or with 3 mg drospirenone.
Data were collected from the “E4/DRSP Endocrine Function, Metabolic Control and Hemostasis Study” (NCT02957630). Overall, the per-protocol set population included 24 subjects in the ethinylestradiol/levonorgestrel arm, 28 subjects in the ethinylestradiol/drospirenone arm, and 34 subjects in the estetrol/drospirenone arm. Thrombograms and thrombin generation parameters (lag time, peak, time to peak, endogenous thrombin potential, and mean velocity rate index) were extracted for each subject at baseline and after 6 cycles of treatment.
After 6 cycles of treatment, ethinylestradiol-containing products arms show a mean thrombogram outside the upper limit of the reference range, that is the 97.5th percentile of all baseline thrombograms. On the other hand, the mean thrombogram of estetrol/drospirenone is within this reference interval. After 6 cycles of treatment, all thrombin generation parameters are statistically less affected by estetrol/drospirenone than ethinylestradiol-containing products.
In conclusion, an association of 15 mg estetrol with 3 mg drospirenone does not have an impact on thrombin generation compared with ethinylestradiol-containing products that, either associated with levonorgestrel or drospirenone, are able to increase the production of procoagulant factors and decrease the production of anticoagulant ones, shifting the patient to a prothrombotic state. Ethinylestradiol-containing products thus generate prothrombotic environments contrary to estetrol which demonstrates a neutral profile on hemostasis.
Pregnancy and postpartum, as well as exogenous hormones exposure, such as combined hormonal contraceptives (CHCs), create hormonal changes associated with an increased risk of venous thromboembolism (VTE) (1). Indeed, a 5-fold increased risk of VTE is reported during pregnancy, and up to a 20- to 60-fold increased risk in the postpartum period (ie, during the first 6 weeks after delivery) (2-4). For women using CHCs, the relative risk varies between 1.3 and 5.6, depending on the estroprogestative association and the dose of the estrogenic component (5-11).
Pregnancy and the use of CHCs cause changes in plasma levels of almost all proteins involved in the coagulation and fibrinolysis (12). These changes might be considered relatively modest when measured separately, but they could have a supra-additive effect leading to a procoagulable state responsible for this increased risk of VTE (13). Overall, rises in coagulation factors II, V, VII, VIII, IX, X, XI, and XII and von Willebrand factor, as well as fibrinogen levels, are observed (12). On the other hand, antithrombin, protein S, and tissue factor pathway inhibitor (TFPI) levels, 3 proteins contributing to the anticoagulant system, are decreased (14-17). As for the fibrinolysis, there is an increase in plasminogen levels but a decrease in tissue plasminogen activator antigens and plasminogen activator inhibitor-1 levels (12). These hormonal changes, both during pregnancy and after the use of hormonal therapy, are also associated with activated protein C (APC) resistance, which can result from increases in FII, FVIII, or FX levels and/or decreases in protein S and TFPI (12, 13, 18, 19).
Among assays measuring APC resistance, the endogenous thrombin potential (ETP)-based APC resistance assay is the most sensitive toward acquired APC resistance and has been linked to an increased risk of VTE in women on hormonal therapy (13-19). This technique relies on the thrombin generation assay (TGA), which permits to obtain a thrombogram (ie, a visual and quantitative representation of the amount of thrombin generated over time in a cupule). Although the normalized activated protein C sensitivity ratio (nAPCsr) reflects the capacity of the ETP parameter (representing the area under the thrombogram) to be reduced in the presence of exogenous APC, other parameters of the thrombogram can be exploited (20). Indeed, they can provide information on the prothrombotic tendency (21, 22), independently of the resistance toward exogenous APC. Besides, the use of ethinylestradiol (EE) based-CHCs, and other known hypercoagulable states, have been shown to enhance in vitro thrombin generation (23-25).
A combination of 15 mg estetrol (E4) and 3 mg drospirenone (DRSP) (Nextstellis in the United States, Drovelis and Lydisilka in Europe) has recently been approved (26). Estetrol is a natural and native fetal estrogen synthesized exclusively in the human fetal liver (27). It has a unique mode of action, different from those of other estrogens, by activating the nuclear estrogen receptor α but antagonizing the membrane estrogen receptor α (28). The use of E4 demonstrated a low impact on the liver with minimal effects on lipids, lipoproteins, sex hormone binding globulin (SHBG), and several coagulation and fibrinolytic proteins (29). The association of E4 with DRSP also showed a much lower impact on APC resistance compared with EE with levonorgestrel (LNG) or EE with DRSP as well as on the level of prothrombin fragment 1+2, a marker of the ongoing coagulation (29). Nevertheless, although some coagulation factors such as prothrombin, FVII, TFPI, or protein S were individually affected by each of these therapies (ie, E4/DRSP, EE/LNG, and EE/DRSP), the synergistic effect of these changes on hemostasis could not be captured by these singular measurements. Therefore, a global test capable of capturing all pro- and anticoagulants factors levels changes would allow a more accurate evaluation of the impact of a CHC on hemostasis and the associated risk of VTE. The thrombin generation test permits assessment of the coagulation process in its entirety and it has been shown to be sensitive to the synergistic hemostatic alterations induced by CHCs (30). This study aims therefore at comparing the impact of E4/DRSP with EE/LNG and EE/DRSP on thrombin generation.
Materials and Methods
Study Design
This single-center, randomized, open-label, controlled, 3-arm, parallel study in healthy females was conducted from September 2016 to October 2017 at Dinox BV, Groningen, the Netherlands (Eudra CT 2916-001316-37, Clinicaltrials.gov NCT02957630). The study, performed in accordance with the Declaration of Helsinki and the International Council for Harmonization E6 (R2) Good Clinical Practice guidelines, was approved by an independent local ethics committee and written informed consent was obtained from all participants before study entry. The study consisted of a pretreatment cycle (baseline), followed by six 28-day treatment cycles. A total of 100 healthy women (40 in the investigational group and 30 per comparator group) was planned to be included in the study. Visits were planned to be at screening, at randomization/baseline, at cycle 3, at cycle 6, and/or at the end of the study. Because hemostatic results at cycle 3 were similar to those of cycle 6, only data obtained at cycle 6 will be reported.
Study Population
Healthy females aged 18 to 50 years with a body mass index between 18 and 30 kg/m2 and a natural menstrual cycle of maximum 35 days were eligible for inclusion. Main exclusion criteria were contraindications for the use of hormonal contraceptives, known coagulopathy or thrombogenic mutation, the use of anticoagulants or other drugs affecting coagulation and platelet aggregation, and an abnormal Papanicolaou smear test. The use of an injectable contraceptive was not allowed within 3 to 10 months before the screening, depending on the type of injection. Women with CHC use before the study had a washout period of 4 weeks before pretreatment cycle. The pretreatment cycle started on the first day of the menstrual cycle (following the washout cycle for former CHC users). All subjects started the intake of the active study medication on the first day of their menstrual cycle following the pretreatment cycle.
Study Treatment
Eligible subjects were stratified by previous hormonal contraceptive use (8 weeks or >8 weeks without use before study treatment start) and by age (≤35 years or >35 years). Subjects were then assigned, using a computerized random allocation sequence, to 1 of the following treatments in a 4:3:3 ratio: 15 mg E4 (as monohydrate, equivalent to 14.2 mg anhydrate) combined with 3 mg DRSP (E4/DRSP; 24-day active/4-day placebo regimen); 30 mcg EE combined with 150 mcg LNG (EE/LNG; 21-day active/7-day placebo regimen), or 20 mcg EE combined with 3 mg DRSP (EE/DRSP; 24-day active/4-day placebo regimen). The E4/DRSP-containing product was manufactured by Haupt Pharma, Münster, Germany, and provided by Estetra SRL, an affiliate's company of Mithra Pharmaceuticals, Liège, Belgium. The other 2 products (ie, EE/LNG [Melleva 150/30, Leon Farma] and EE/DRSP [Yaz, Bayer Healthcare]) were obtained from a local pharmacy. Study treatment started on the first day of menstrual cycle following the pretreatment cycle. Treatment compliance was verified using a diary and check of returned packages.
Study Assessment and Outcome Parameters
Hemostasis parameters (fibrinogen, prothrombin, factor VII, FVIII, von Willebrand factor, antithrombin, protein S activity, free protein S, protein C, free TFPI, plasminogen, plasminogen activator inhibitor type-1, tissue plasminogen activator, ETP-based APC resistance [expressed as nAPCsr], D-dimers, and prothrombin fragment 1+2) as well as SHBG have previously been reported (29).
Thrombin generation assay has been performed on a Calibrated Automated Thrombogram (Diagnostica Stago, Asnières-sur-Seine, France) using the STG-ThromboScreen (Diagnostica Stago) as a triggering reagent. A complete description of the method is reported in detail elsewhere (20). Thrombogram parameters were integrated using the Thrombinoscope software (Thrombinoscope bv, version 5.0) and the following TGA parameters were extracted from the thrombin generation curve: (1) the lag time, corresponding to the start of thrombin generation (expressed in minutes); (2) the peak height, corresponding to the maximal concentration of thrombin generated (expressed in nM); (3) the time-to-peak, corresponding to the time to reach the peak (expressed in minutes), (4) the ETP, corresponding to the area under the curve (expressed in nM*min); and (5) the mean velocity rate index, corresponding to the maximal rate of thrombin generation (expressed in nM/min). Figure 1 provides a representation of a thrombogram with the corresponding TGA parameters.
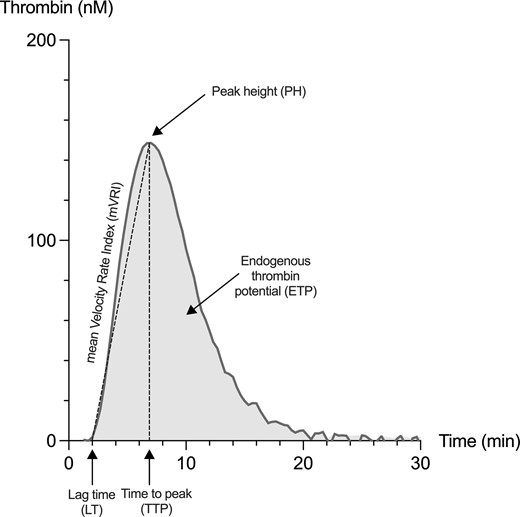
Representation of a thrombin generation curve and associated parameters that are provided by the software analyzing the thrombogram.
Statistical Analysis
Statistical analysis was performed using GraphPad version 9.3.1 (GraphPad Prism 9.3.1 for macOs, GraphPad Software, San Diego, CA, USA; www.graphpad.com). All randomized subjects who received at least 1 dose of the study medication and had at least 1 hemostasis assessment on treatment, without any major protocol deviation affecting the endpoints, were included in the analysis (per protocol dataset). Descriptive statistics were used to analyze the data (n, mean, standard deviation, median, minimum-maximum range, 10th to 90th percentile, and 95% confidence interval [CI]). Changes of the different TGA parameters from baseline to cycle 6 have been computed using paired t test and differences between treatment groups for a particular timepoint were assessed using an ordinary 1-way ANOVA followed by a Tukey multiple comparison test. Reference ranges for thrombin generation and associated parameters are reported as the 2.5th to 97.5th percentile of the entire baseline cohort (n = 86), in accordance with the definition of the reference intervals as reported in the Clinical & Laboratory Standards Institute EP-28-A3C (31). All statistical tests were evaluated with a level of significance of 0.05.
Results
Study Population
A total of 143 subjects were screened for eligibility, of which 101 were randomized, 98 received study treatment and 88 among these participants completed the study (per protocol set population) (Fig. 2). A summary of the demographic data at study entry is presented in Table 1 and shows no difference between groups at baseline. There was no important protocol deviation, including noncompliance issues. For 1 patient in the EE/DRSP group, there was no sufficient plasma sample and thrombin generation could not be performed. One patient in the EE/LNG group with a thrombin generation curve at baseline defined as outlier was not included in TGA analyses. The final per protocol set population for this study was therefore 86, among which 24 subjects received EE/LNG, 28 received EE/DRSP, and 34 received E4/DRSP. Previous use of CHC concerned 38% of women in the EE/LNG group, 43% in the EE/DRSP group, and 47% in the E4/DRSP group.
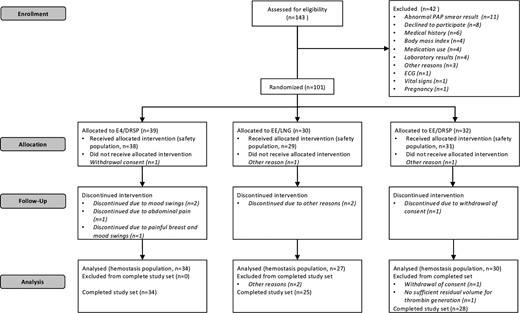
Trial flow diagram. Abbreviations: DRSP, drospirenone; E4, estetrol; EE, ethinylestradiol; LNG, levonorgestrel.
Mean demographic data at study entry
| 15 mg E4 - 3 mg DRSP N = 38 | 30 mcg EE - 150 mcg LNG N = 29 | 20 mcg EE - 3 mg DRSP N = 31 | All N = 98 | |
|---|---|---|---|---|
| Age, y (range) | 26.7 (19-47) | 26.2 (18-44) | 25.6 (18-40) | 26.2 (18-47) |
| Weight, kg (range) | 68.1 (53.1-97.8) | 65.6 (50.4-79.2) | 63.2 (50.3-80.7) | 65.8 (50.3-97.8) |
| Height, cm (range) | 170.8 (159-188) | 169.6 (160-181) | 168.4 (155-183) | 169.7 (155-188) |
| BMI, kg/m2 (range) | 23.33 (19.2-30.0) | 22.83 (18.3-29.8) | 22.27 (18.6-26.7) | 22.85 (18.3-30.0) |
Abbreviations: BMI, body mass index; DRSP, drospirenone; E4, estetrol; EE, ethinylestradiol; LNG, levonorgestrel.
Thrombograms and TGA Parameters
Absolute values at baseline and after 6 cycles of treatment
Analyses of thrombograms and resulting TGA parameters were performed on data from the 86 subjects in the final per protocol set population.
Thrombograms at baseline (n = 86, entire baseline cohort) and after 6 cycles of treatment of women either treated with EE/LNG (n = 24), EE/DRSP (n = 28), or E4/DRSP (n = 34) are shown in Fig. 3. The mean thrombogram along with the 2.5th to 97.5th percentile, is shown for the entire baseline cohort (n = 86) and represents the reference interval. Mean (±95% CI of the mean) thrombograms after 6 cycles of treatment are also presented. EE/LNG and EE/DRSP groups show a mean thrombogram (±95% CI of the mean) outside the upper limit of the reference range (ie, the 97.5th percentile of all baseline thrombograms). On the other hand, the mean thrombogram (±95% CI of the mean) of E4/DRSP is within this reference interval.
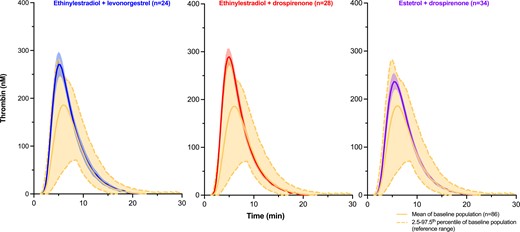
The mean (2.5th-97.5th percentiles) thrombogram of the entire baseline cohort (N = 86) and mean thrombograms (95% CI of the mean) after 6 cycles of treatment are presented.
Mean values of each TGA parameter at baseline and at cycle 6 of the different treatment arms are reported in Table 2. Differences at baseline are observed depending on treatment arm: E4/DRSP arm has statistically higher peak (mean difference vs EE/LNG: 26.0 nM [95% CI, 2.1 to 49.9(5) nM] and vs EE/DRSP: 28.8(5) nM [95% CI, 5.9(5) to 51.7(5) nM]), higher mean velocity rate index (mVRI; mean difference vs EE/LNG: 16.5 nM/min [95% CI, 3.9-29.1 nM/min] and vs EE/DRSP: 19.4 nM/min [95% CI, 7.3-31.4 nM]) and shorter time to peak (mean difference vs EE/LNG: 0.70 minutes [95% CI, 0.07-1.33 minutes] and vs EE/DRSP: 0.70 minutes [95% CI, 0.1-1.30 minutes]). After 6 cycles of treatment, no statistically significant difference is observed between EE/LNG and EE/DRSP groups (P values >0.05; Fig. 4). On the other hand, the ETP, the peak, and the mVRI are significantly lower in the E4/DRSP group compared with EE/LNG and EE/DRSP, whereas the lag time and the time to peak are significantly higher in the E4/DRSP group compared with EE/DRSP, but not compared with EE/LNG. In addition, mean values of all TGA parameters are within the reference intervals (2.5th-97.5th percentile of entire baseline cohort) for E4/DRSP, whereas mean ETP and peak height are out of range for both EE-containing products and the mean mVRI is also outside the reference range for EE/DRSP. As shown in Table 3, depending on the TGA parameter, up to 32% of values are outside the reference ranges for E4/DRSP, whereas they reach 79% for EE/DRSP and 58% for EE/LNG.
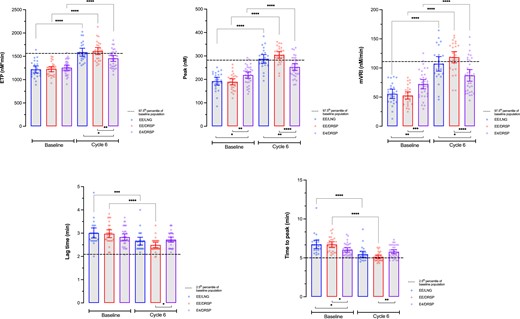
Graphical representation of all thrombin generation parameters at baseline and after 6 cycles of treatment for the different combined oral contraceptives associations. Differences between baseline, and cycle 6 for each treatment arm have been computed using paired t test and differences between arms for a particular timepoint have been computed using ordinary ANOVA with Tukey's multiple comparison tests. *, **, ***, and **** represent P value ≤0.05, ≤0.01, ≤0.001, and <0.0001, respectively. Only differences that are statistically significant are reported. Abbreviations: DRSP, drospirenone; E4, estetrol; EE, ethinylestradiol; ETP, endogenous thrombin potential, LNG, levonorgestrel, mVRI, mean velocity rate index.
Thrombin generation parameters with the different combined oral contraceptive associations at baseline and cycle 6
| ETP (nM.min) | Peak height (nM) | Lag time (min) | Time to peak (min) | mVRI (nM/min) | ||||||||||||||||
|---|---|---|---|---|---|---|---|---|---|---|---|---|---|---|---|---|---|---|---|---|
| Baseline | Cycle 6 | Relative diff. (%) | P value | Baseline | Cycle 6 | Relative diff. (%) | P value | Baseline | Cycle 6 | Relative diff. (%) | P value | Baseline | Cycle 6 | Relative diff. (%) | P value | Baseline | Cycle 6 | Relative diff. (%) | P value | |
| EE/LNG | 1219 ± 180 | 1588 ± 204 | 32.0 ± 20.5 | <0.0001 | 192.5 ± 39.6 | 287.3 ± 43.7 | 53.6 ±29.4 | <0.0001 | 3.01 ± 0.51 | 2.65(5) ± 0.40 | −10.5 ± 12.9(5) | 0.0005 | 6.72 ± 1.28 | 5.47 ± 0.91 | −18.0 ± 8.5 | <0.0001 | 55.6 ± 19.0 | 107.1 ± 29.6 | 105.0 ± 56.4 | <0.0001 |
| EE/DRSP | 1226 ± 146 | 1613 ± 197 | 32.8 ± 19.0 | <0.0001 | 189.7 ± 33.8 | 304.3 ± 35.6 | 65.5 ± 38.4 | <0.0001 | 2.97 ± 0.43 | 2.49 ± 0.29 | −15.2(5) ± 10.4 | <0.0001 | 6.72 ± 0.91 | 5.13 ± 0.58 | −23.0 ± 8.1 | <0.0001 | 52.8 ± 15.8 | 118.5 ± 24.9 | 143.6 ± 98.8 | <0.0001 |
| E4/DRSP | 1257 ±150 | 1456 ± 186 | 16.8 ± 15.9 | <0.0001 | 218.5 ± 39.0 | 253.2 ± 42.6 | 17.3 ± 16.5 | <0.0001 | 2.83 ± 0.39 | 2.72 ± 0.32 | −2.4(5) ± 15.8 | 0.1632 | 6.02 ± 0.80 | 5.79 ± 0.78 | −3.2 ± 12.2 | 0.0747 | 72.2 ± 23.0 | 87.2 ± 28.5 | 24.3 ±27.9 | <0.0001 |
| P-valuea | 0.6167 | 0.0042 | 0.0010 | / | 0.0054 | <0.0001 | <0.0001 | / | 0.2636 | 0.0275 | 0.0013 | / | 0.0078 | 0.0046 | <0.0001 | 0.0004 | 0.0001 | <0.0001 | / | |
Abbreviations: DRSP, drospirenone; E4, estetrol; EE, ethinylestradiol; ETP, endogenous thrombin potential; LNG, levonorgestrel; mVRI, mean velocity rate index.
P value had been estimated by using an ordinary 1-way ANOVA. A Tukey multiple comparisons test, with a single pooled variance, has been run to assess the difference between the groups. P values < 0.05 are considered statistically significant and appear in bold.
Reference intervals ([2.5th-97.5th percentile] of entire baseline cohort) of thrombin generation parameters and out of ranges results after 6 cycles of treatment
| ETP (nM.min) | Peak height (nM) | Lag time (min) | Time to peak (min) | mVRI (nM/min) | |
|---|---|---|---|---|---|
| Reference ranges | 906-1562 | 119.6 −282.0 | 2.09-3.80 | 5.00-8.64 | 24.8-111.0 |
| EE/LNG (N = 25) | 10(42%) | 14 (58%) | 0 (0%) | 6 (25%) | 10 (42%) |
| EE/DRSP (N = 28) | 18 (64%) | 22 (79%) | 2 (7%) | 12 (43%) | 19 (68%) |
| E4/DRSP (N = 34) | 11 (32%) | 9 (26%) | 0 (0%) | 5 (15%) | 9 (26%) |
Abbreviations: DRSP, drospirenone; E4, estetrol; EE, ethinylestradiol; ETP, endogenous thrombin potential; LNG, levonorgestrel; mVRI, mean velocity rate index.
Changes from baseline
Compared with baseline, the ETP, peak, and mVRI are statistically different in all study arms after 6 cycles of treatment. The lag time and the time to peak are only statistically reduced in the EE/LNG and EE/DRSP arms (Fig. 4). These temporal parameters are not influenced by the intake of E4/DRSP. These data and the relative changes from baseline (%) for each TGA parameters are summarized in Table 2 and Fig. 5. All TGA parameters are statistically less affected by E4/DRSP than EE/LNG or EE/DRSP. There is no statistical difference between EE/LNG and EE/DRSP.
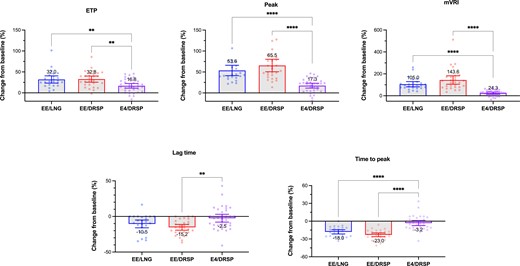
Change from baseline (%) of all thrombin generation parameters after 6 cycles of treatment for the different combined oral contraceptives associations. Differences between arms have been computed using 1-way ANOVA with Tukey multiple comparison tests. *, **, ***, and **** represent P value ≤0.05, ≤0.01, ≤0.001, and <0.0001, respectively. Only differences that are statistically significant are reported. Abbreviations: DRSP, drospirenone; E4, estetrol; EE, ethinylestradiol; ETP, endogenous thrombin potential, LNG, levonorgestrel, mVRI, mean velocity rate index.
Discussion
Hemostasis is a finely balanced physiological process and even if CHC-induced changes of coagulation factors often remain within the normal range of the population, the supra-additive effect tends to increase the total thrombogenicity. Hemostatic changes induced by CHCs involve levels of fibrinogen, prothrombin, FVII, FVIII, FIX, FX, FXII, antithrombin, protein C, protein S, and TFPI (12). Over the past 30 years, many studies have been conducted to assess the impact of the different CHCs on the coagulation system (12) and, overall, these have revealed that the effect on hemostasis depends on the type of estrogens, their dose, and their association with progestins (5, 7, 13, 32-34).
In this study, thrombin generation was assessed in a cohort of women treated during 6 cycles with either E4 in association with DRSP or EE in association with LNG or with DRSP. The global representation of the impact of these therapies on thrombin generation is illustrated by mean thrombograms on Fig. 3. This simple visual analysis demonstrates the distinct effects of these therapies on the global coagulation process.
Namely, the mean (±95% CI of the mean) thrombogram of women on E4/DRSP during 6 cycles does not exceed the reference baseline interval contrary to EE/LNG and EE/DRSP groups. This visual evaluation is confirmed by the quantitative analyses performed on the different TGA parameters (ie, lag time, time to peak, peak, ETP, and mVRI; Tables 2 and 3). After 6 cycles, all TGA parameters were statistically less affected in the E4/DRSP group compared with EE/LNG and EE/DRSP. Importantly, the changes from baseline were also always statistically smaller in the E4/DRSP group whatever the TGA parameter considered. On the other hand, no statistical difference was observed between EE/LNG and EE/DRSP although some parameters like the lag time, the mVRI, and to a lesser extend the time to peak could be less affected in the EE/LNG group compared with the EE/DRSP group but without reaching the significance level.
Thrombograms, however, revealed differences at baseline depending on treatment arm. Indeed, the mean thrombogram at baseline in the E4/DRSP group was shown to be higher for the peak, the time to peak, and the mVRI parameters (Table 2 and Fig. 4). This observation is nevertheless mere coincidence because participants were first stratified by previous hormonal contraceptive use and by age, and then the assignment to 1 of the 3 treatment arms (ie, E4/DRSP, EE/LNG, or EE/DRSP) was performed using a computerized random allocation sequence. We searched for possible disproportion in the repartition of previous CHC users among the 3 treatment arms. No significant difference was observed between former users and nonusers among each treatment arm, for all TGA parameters (P > 0.05, unpaired t tests) except for mVRI in the EE/DRSP group (P = 0.046). On the other hand, compared with EE/LNG and EE/DRSP, the mild observed hypercoagulable state at baseline, along with the smaller impact on thrombin generation after 6 months of treatment, reinforce the conclusion that E4 in association with DRSP induces less procoagulant changes than EE/LNG or EE/DRSP. This should be perceived as an additional advantage of E4/DRSP over EE/LNG and EE/DRSP because the absolute thrombogram after 6 cycles is lower than those of EE/LNG and EE/DRSP, even in a population showing a more procoagulant state at baseline.
Added to the results on the APC resistance (these results demonstrated that the E4/DRSP combination has statistically less impact on the nAPCsr than EE/LNG and EE/DRSP after 3 or 6 months of treatment), these data mean that the global effect of an association of 15 mg E4 with 3 mg DRSP has less impact on the entire coagulation than EE 30 mcg with LNG 150 mcg and EE 20 mcg with DRSP 3 mg. The mean thrombogram of the E4/DRSP group, along with all TGA parameters, standing within the reference ranges clearly delineates the neutral profile of this association on thrombin generation. Mean changes in ETP, peak height, lag time, and time to peak were below 20%, whereas mVRI (a very sensitive TGA parameter) was only impacted by 24% but affected by 105% and 144% in the EE/LNG and the EE/DRSP groups (Table 2). Moreover, the different thrombograms along with TGA parameters between E4/DRSP and EE/DRSP strongly indicates that the lower impact of the new approved CHC (ie, 15 mg E4/3 mg DRSP) is attributable to the difference in its estrogenic content and is not related to DRSP. Besides, the use of 4 mg DRSP alone revealed to be associated with a low impact on hemostasis parameters (35, 36).
That TGA parameters were not significantly influenced by the intake of E4/DRSP over the 6-month course of this study is very reassuring. The Leiden Thrombophilia (LETS) Study revealed that patients with ETP above the 90th percentile in the control population were more prone to have a recurrent thrombotic event, suggesting a correlation between the risk of recurrent VTE and high ETP (21). In the combined Longitudinal Investigation of Thromboembolism Etiology (LITE) data, participants with peak height values above the median were at 74% greater risk of VTE compared with those in the lowest quartile (22), suggesting that compounds with highest impact on thrombin generation are also those who are more prone to be associated with thromboembolic events. This is also supported by recent prediction models using the nAPCsr as a surrogate marker for the risk of VTE (37). There is much other evidence that higher thrombin generation profiles, reflected by higher ETP, peak height, or mVRI and reduced lag time or time to peak, are associated with an increased risk of occurrence or recurrence of thrombosis (38-42).
Although a comparative phase IV study (ie, postapproval study) will be necessary to definitively prove the lower VTE risk profile of 15 mg E4/3 mg DRSP, that no VTE event was observed in the US phase III study evaluating E4/DRSP in 1864 women is already reassuring. Also 23% of the study participants had a BMI higher than 30.0 kg/m2 (43), a well-known risk factor for VTE (44), suggesting a low incidence rate using this formulation. Previous studies of the same magnitude in similar populations using low-risk CHCs (eg, EE 10 mcg/norethindrone acetate 1 mg, a vaginal ring delivering EE 13 mcg and segesterone acetate 150 mcg per day or EE 30 mcg/levonorgestrel 120 mcg) have reported higher absolute numbers of VTE events. Three thrombotic events were reported among 1683 (0.2%) US women using EE 10 mcg/norethindrone acetate 1 mg, of whom 18% were obese (45). Four VTE occurred among 1188 (0.3%) US women using a vaginal ring delivering EE 13 mcg and segesterone acetate 150 mcg per day (46) and 4 VTEs occurred among 2031 (0.2%) US women, of whom 35% were obese, using a new contraceptive patch with dosing equivalent to an EE 30 mcg/levonorgestrel 120 mcg oral contraceptive pill (47). Thus, even with low-dose EE-containing CHCs, the thrombotic risk is still elevated substantially and higher than the one observed during the clinical development of E4/DRSP. This may be in part explained by the unique mode of action of E4 that acts differently on the liver, potentially reducing the risk of VTE.
However, in the real world (ie, outside the setting of the clinical study in which exclusion criteria permit to select a low-risk population), the inclusion of women with an unknown coagulopathy at the time of contraception initiation is unavoidable because of the current screening strategies. As previously described (13), the presence of a genetic mutation (ie, FV Leiden, G20210A prothrombin mutations, protein C, protein S, and antithrombin deficiencies) with CHCs leads to a synergistic and amplificative (rather than an additive) prothrombotic effect. Although contraindicated, cases of exposure in such population will occur and may inform on the amplificative effect of these prothrombotic conditions in presence of E4/DRSP. In perspective, this could allow the computation of a synergy index for E4/DRSP, similar to what was done by Hugon-Rodin et al (48) and Khialani et al (49) with other CHC preparations. Finally, this permits us to appreciate the contribution of E4/DRSP on the global prothrombotic profile of a woman.
Conclusion
In conclusion, an association of 15 mg E4 with 3 mg DRSP does not have an impact on thrombin generation compared with EE-containing products that, either associated with LNG or DRSP, are able to increase the production of procoagulant factors and decrease the production of anticoagulant ones, shifting the patient to a prothrombotic state. Ethinylestradiol-containing products thus generate prothrombotic environments contrary to E4, which demonstrates a neutral profile on hemostasis. Although this must be confirmed by data obtained from a postapproval study, a previous experience with estradiol in association with nomegestrol acetate has permitted to validate the concept that these surrogate biomarkers may reflect the VTE profile of a specific CHC compared with a reference association (50, 51). This further suggests that E4/DRSP is less likely to be associated with VTE risk compared with EE-containing products.
Acknowledgments
The authors thank Estetra SRL, Liège, Belgium, for giving access to the samples and the data collected during the study NCT02957630.
Funding
This investigation was financed by QUALIblood s.a, Namur, Belgium, and by the Walloon Region in Belgium (government source) – convention 8031.
Disclosures
L.M. is an employee of QUALIblood s.a.; M.J. is an employee of Mithra Pharmaceuticals; J.M.F. is a member of the board of Mithra Pharmaceuticals; J.D. is chief executive officer and founder of QUALIblood s.a. and reports personal fees from Daiichi-Sankyo, Diagnostica Stago, DOASense, Gedeon Richer, Mithra Pharmaceuticals, Norgine, Portola, Roche, Roche Diagnostics, Technoclone, and Werfen outside the submitted work. The other authors have no conflicts of interest to disclose.
Data Availability
Original data generated and analyzed during this study are included in this published article or in the data repositories listed in References.
References
Abbreviations
- APC
activated protein C
- CHC
combined hormonal contraceptive
- CI
confidence interval
- DRSP
drospirenone
- E4
estetrol
- EE
ethinylestradiol
- ETP
endogenous thrombin potential
- LNG
levonorgestrel
- mVRI
mean velocity rate index
- nAPCsr
normalized activated protein C sensitivity ratio
- SD
standard deviation
- SHBG
sex hormone binding globulin
- TFPI
tissue factor pathway inhibitor
- TGA
thrombin generation assay
- VTE
venous thromboembolism
