


Abstract
Previous studies indicate that leptin secretion is regulated by insulin-mediated glucose metabolism. Because fructose, unlike glucose, does not stimulate insulin secretion, we hypothesized that meals high in fructose would result in lower leptin concentrations than meals containing the same amount of glucose. Blood samples were collected every 30–60 min for 24 h from 12 normal-weight women on 2 randomized days during which the subjects consumed three meals containing 55, 30, and 15% of total kilocalories as carbohydrate, fat, and protein, respectively, with 30% of kilocalories as either a fructose-sweetened [high fructose (HFr)] or glucose-sweetened [high glucose (HGl)] beverage. Meals were isocaloric in the two treatments. Postprandial glycemic excursions were reduced by 66 ± 12%, and insulin responses were 65 ± 5% lower (both P < 0.001) during HFr consumption. The area under the curve for leptin during the first 12 h (−33 ± 7%; P < 0.005), the entire 24 h (−21 ± 8%; P < 0.02), and the diurnal amplitude (peak − nadir) (24 ± 6%; P < 0.0025) were reduced on the HFr day compared with the HGl day. In addition, circulating levels of the orexigenic gastroenteric hormone, ghrelin, were suppressed by approximately 30% 1–2 h after ingestion of each HGl meal (P < 0.01), but postprandial suppression of ghrelin was significantly less pronounced after HFr meals (P < 0.05 vs. HGl). Consumption of HFr meals produced a rapid and prolonged elevation of plasma triglycerides compared with the HGl day (P < 0.005). Because insulin and leptin, and possibly ghrelin, function as key signals to the central nervous system in the long-term regulation of energy balance, decreases of circulating insulin and leptin and increased ghrelin concentrations, as demonstrated in this study, could lead to increased caloric intake and ultimately contribute to weight gain and obesity during chronic consumption of diets high in fructose.
WE HAVE PREVIOUSLY reported that consumption of high-fat meals, which produce smaller postprandial glucose and insulin responses than equicaloric high-carbohydrate meals, reduces 24-h circulating leptin concentrations in humans (1). This reduction of leptin concentrations is likely the result of decreased insulin-mediated glucose metabolism in adipose tissue (2). Because insulin and leptin function as key signals conveying information on energy intake and body fat stores to the central nervous system (CNS) for the long-term regulation of food intake and energy homeostasis (3, 4), it is possible that reduced insulin and leptin production contributes to increased energy intake, weight gain, and obesity in animals and humans consuming high-fat diets. In contrast, high-carbohydrate, low-fat diets are known to induce weight loss, even when consumed ad libitum (5, 6).
However, not all types of dietary carbohydrate are likely to have the same effect on these signals of peripheral energy status. Fructose, unlike glucose, does not stimulate insulin secretion from pancreatic β-cells (7). In rhesus monkeys, an 8-h iv fructose infusion resulted in markedly reduced insulin secretion and did not increase circulating leptin concentrations compared with infusion of the same amount of glucose, which increased plasma leptin levels by more than 50% above baseline fasting levels (8). Thus, similar to fat, fructose does not increase insulin-mediated glucose metabolism or circulating leptin levels. Even a relative deficit in leptin production has been shown to be associated with increased body adiposity in humans (9). In addition, it has recently been reported that an augmentation of the proportional amplitude (nadir to peak) of the 24-h diurnal pattern of circulating leptin concentrations was predictive of the extent of weight and body fat loss during a 12-wk ad libitum low-fat diet (15% of energy) (10). Therefore, it is important to determine the effects of dietary fructose on meal-associated insulin secretion and the diurnal pattern of leptin production in humans. This is particularly relevant in light of the fact that per capita fructose consumption has increased during the past three decades (11) within the same time frame as a marked increase in the prevalence of obesity (12, 13).
Other factors, including a number of gastrointestinal hormones that are known to influence food intake and glucose homeostasis, could potentially contribute to a metabolic profile promoting increased body adiposity after fructose ingestion. Ghrelin, a recently discovered enteric hormone, is a potent orexigen (14, 15) and may play a role in the regulation of food intake and nutrient selection (16, 17). Circulating ghrelin concentrations have not been examined in response to changes of dietary carbohydrate composition in human subjects, and the influence of fructose on ghrelin secretion is not known. In contrast, the acute effects of fructose on the two primary incretin hormones (insulinotropic peptides), glucose-dependent insulinotropic polypeptide (GIP) and glucagon-like peptide-1 (GLP-1), have been investigated. Typically, these hormones are released when glucose is ingested, but although acute fructose consumption has also been reported to stimulate GLP-1 release (18), GIP secretion is unaffected by fructose (19). However, circulating levels of these hormones have not been examined over the course of a day in which glucose and fructose are consumed in the context of mixed nutrient meals.
Thus, in the present study, we examined circulating glucose, insulin, and leptin concentrations as well as ghrelin, GLP-1(7-36) (the active form of GLP-1), and GIP over a 24-h period on 2 separate days during which the subjects consumed three isocaloric (between treatments) mixed nutrient meals accompanied by either glucose-sweetened [high glucose (HGl)] or fructose-sweetened [high fructose (HFr)] beverages. Furthermore, because the hepatic metabolism of fructose is considered to favor lipogenesis and triglyceride (TG) synthesis (20), plasma TG and free fatty acid (FFA) levels were also measured.
Subjects and Methods
Subjects
Twelve normal-weight women with an age range of 19–33 yr (mean, 25 ± 2 yr) and with a body mass index within the range of 19.8–26.7 kg/m2 (mean, 23.2 ± 0.6) participated in the study. Each subject underwent a telephone interview to assess eligibility. Subjects who reported any food allergies or special dietary restrictions or ingested more than two carbonated beverages per day were excluded from the study. Subjects taking any medication were also excluded. Subjects provided informed consent to participate in the study and were given a physical examination that included an electrocardiogram and a medical history to ensure that they had no chronic illnesses. A blood sample was drawn after an overnight fast. Subjects with fasting blood glucose levels greater than 5 mmol/liter (90 mg/dl), blood pressure higher than 140/90 mm Hg, or hemoglobin levels less than 6.8 mmol/liter (11 g/dl) were excluded from the study. Percentage of body fat was determined in each subject by bioelectrical impedance (model no. BIA-101A, RJL Systems, Mt. Clemens, MI) and ranged from 20–40% (mean, 30 ± 2%). Mean fasting plasma insulin and glucose values were 45 ± 3 pmol/liter and 4.0 ± 0.1 mmol/liter, respectively. Subjects were also administered the three-factor eating questionnaire (21). This questionnaire evaluates an individual’s attitude toward food by measuring three factors: dietary restraint (cognitive control of eating behavior), degree of disinhibition (disinhibition of control), and susceptibility to hunger. The questionnaire has been validated and can distinguish between dieters and nondieters. Subjects scoring no more than 10 on the restraint scale were classified as nonrestrained eaters, whereas those scoring above 10 were classified as restrained (21). The magnitude of restraint has been shown to be highly correlated with body mass index. Seven of the subjects were classified as unrestrained eaters, and five were classified as restrained eaters. The experimental protocols were approved by the Committees on Studies Involving Human Subjects at the University of Pennsylvania (Philadelphia, PA) and the University of California, Davis (Davis, CA).
Experimental protocol
Each subject was studied under two experimental conditions administered in random order. The experimental conditions were spaced 1 month apart, and each required a two-night stay in the General Clinical Research Center (GCRC). The two-night stay comprised a 24-h period during which dietary intake was controlled (d 1) and a 12-h period during which subjects consumed food ad libitum (d 2). The two experimental conditions involved dietary manipulations in which subjects were administered either 1) glucose-sweetened beverages with a controlled diet (HGl condition), or 2) fructose-sweetened beverages with a controlled diet (HFr condition). All studies were conducted during the first 7 d of the subjects’ menstrual cycles.
The subjects were instructed to maintain their normal dietary intake and level of exercise during the interval between study sessions. On the evenings before the experimental sessions, the subjects entered the GCRC at the Hospital of the University of Pennsylvania at 1700 h. Subjects were given dinner at 1800 h, after which they remained fasted until the next morning. The subjects were permitted to select the type of food, with the quantity based on their caloric requirements and an energy factor of 1.3. The food offered was that typically provided by the GCRC metabolic kitchen and consisted of a variety of meal selections. Macronutrient composition of the dinner reflected the same ratios of protein, fat, and carbohydrate as the test diets. At 0730 h the next morning, an iv catheter was inserted and kept patent with a slow saline infusion. Blood sampling commenced at 0800 h (d 1) and continued until 0800 h the next morning (d 2). Blood samples for substrate and hormone measurements were collected while the subjects consumed three standardized meals. Each meal was accompanied by either HFr or HGl sweetened beverages. Subjects were required to ingest the meals within a 15-min time period. Hunger was rated throughout the day using visual analog scales.
On completion of the blood sampling period on the morning of the second day, subjects remained in the GCRC until 1900 h (d 2). Before each meal (breakfast, lunch, dinner), subjects were given a prepared menu and asked to select the foods they wished to eat. The selected foods were then offered in excess, and subjects were instructed to eat as little or as much as they wished. Subjects were not aware that their food intake was being monitored.
Diets
The meals consisted of whole foods and were designed by a registered dietitian. The nutrient composition of the diets was determined using the Nutrition Data System, University of Minnesota (Minneapolis, MN). Each subject ingested three meals per day. Breakfast consisted of a bagel, cream cheese, and scrambled eggs. Lunch consisted of a chef’s salad with turkey, cheese, and a dinner roll. Dinner consisted of a chicken breast, mashed potatoes, carrots, and a roll with butter. The energy content of the meals was based on an estimate of that subject’s daily energy requirement. Energy requirements were estimated by the Mifflin equation with an activity factor of 1.3 (22). The activity factor was low because the subjects remained relatively sedentary during the study sessions. The meals contained 30% energy from fat, 15% from protein, and 55% from carbohydrate. Of the 55% of total energy intake provided by carbohydrate, 25% was derived from complex carbohydrate, and 30% consisted of either free glucose or free fructose in the form of a beverage. The monosaccharides were prepared as 15% solutions, flavored with a popular unsweetened drink mix. Subjects were blinded in regard to the sweetener in the beverages. Mean energy intake was 1804 ± 129 kcal (range, 1282–2002). Breakfast was given at 0900 h, lunch at 1300 h, and dinner at 1800 h. Subjects were required to ingest all of the food provided within 15 min and were observed for compliance. Each subject ingested a minimum of 1 liter of water over the course of each study day. Both the HFr and HGl beverages were well tolerated by all subjects.
Hunger ratings and food intake measurements
Subjects were given a Palm Pilot programmed with a series of questions addressing hunger and satiety. The questions were: 1) How hungry do you feel right now? 2) How full is your stomach right now? 3) How strong is your desire to eat? 4) How much food could you eat right now? and 5) How nauseated do you feel right now? The answers to the questions were rated on a visual analog scale and were anchored with the words “none” to “extremely” or, in the case of question 4, “an extremely large amount.” An alarm on the Palm Pilot was set at preprogrammed time points relative to meal ingestion. There were 24 time points during d 1 of the study and 18 time points during d 2. Time points were generally every 30 min during the day and were more frequent around the times of the meals.
On completion of the blood sampling period (0730 h), subjects were given a breakfast menu offering eggs, bagels, turkey bacon, and butter. Subjects selected which items they wanted, and these foods were then offered in portions three times the size of a normal serving. Unknown to the subjects, foods were weighed beforehand, and the remaining foods were weighed after the food tray was taken away from the subject. The difference in the weight of each food was recorded as the amount of food ingested. The macronutrient content of the food ingested was determined using Nutritionist 3 (Esha Research, Salem, OR). Where applicable, the manufacturer’s reported macronutrient content of the prepared foods was used. For lunch and dinner, the food choices were chicken, mashed potatoes, rice, macaroni and cheese, green beans, grapes, apple slices, orange sections, Jell-O, and vanilla pudding. In addition, decaffeinated coffee, decaffeinated tea, fruit juice, milk (2%, nonfat, whole), and water were offered as beverages. The foods selected were specifically chosen to be simple and of minimal hedonic value (i.e. pleasant, but not especially palatable) to minimize subjects selecting food for taste as opposed to hunger.
Blood sampling
Blood samples were taken at 30-min intervals around periods of meal ingestion and during the predicted nocturnal rise of leptin secretion (i.e. 5 h after the evening meal) and at hourly intervals at other times. After the three baseline samples, which were collected at 0800, 0830, and 0900 h before ingestion of the first meal, a total of 33 additional samples were collected 30–60 min apart. Each sample collection involved the removal of 1 ml of blood to clear the catheter tubing, followed by a 5-ml collection into Vacutainer tubes (Becton, Dickinson and Co., Franklin Lakes, NJ) containing EDTA. Dipeptidyl peptidase IV (Linco Research, Inc., St. Charles, MO) and protease inhibitor cocktails containing Trasylol and leupeptin were added to inhibit proteolysis, and the samples were kept on ice for not longer than 1 h. Samples were then centrifuged, aliquoted, and stored at −70 C until assayed.
Assays and data analysis
Plasma glucose and lactate were measured with a YSI 2300 StatPlus Glucose Analyzer (Yellow Springs Instruments, Yellow Springs, OH). Plasma insulin was measured in duplicate by RIA using 125I human insulin (Amersham, Piscataway, NJ) and human insulin standards from Linco Research, Inc. as previously described (23). Plasma leptin was measured with a RIA for human leptin with reagents from Linco Research, Inc. Plasma TGs were measured with reagents from Sigma (St. Louis, MO), and FFAs were measured with reagents from Wako (Richmond, VA) using an automated clinical autoanalyzer. Total plasma ghrelin was measured without an extraction step using a commercial RIA (Phoenix Peptide, Phoenix, AZ) as described previously (24, 25). Biologically active GLP-1(7-36) was measured in unextracted plasma with a two-site noncompetitive immunoassay based on enzyme-labeled quantification of GLP-1 detected with a fluorogenic substrate (Linco Research, Inc.). GIP was measured using a RIA as described by Kuzio et al. (26) and modified by Morgan et al. (27). Rabbit anti-GIP was generously supplied by Dr. L. M. Morgan (University of Surrey, Surrey, UK). Inter- and intraassay variations for GIP were 10 ± 2% and 5 ± 1%, respectively.
The area under the curve (AUC) was calculated for glucose, insulin, GLP-1, GIP, and TGs with a data spreadsheet program (Microsoft Excel; Microsoft, Redmond, WA) using the trapezoidal method. AUCs for ghrelin and FFA are not presented because ghrelin and FFA levels decreased rather than increased in response to meal ingestion. The mean of the three baseline values was determined, and net AUC was calculated by subtracting the areas below baseline from AUC values above baseline. AUCs for glucose, insulin, GIP, GLP-1, and TGs are expressed as units per 23 h above each subject’s fasting baseline levels because the first hour of sampling determined the baseline levels. The nadirs and peaks for plasma leptin were determined as the two lowest consecutive morning values before 1200 h and the two highest consecutive nighttime values after 2000 h, respectively, as previously described (1). The AUCs for leptin are therefore expressed as units above each subject’s nadir over 12 or 24 h. Differences between overall responses to the two diets were determined with paired t tests.
Hunger ratings were analyzed using both AUCs and repeated measures ANOVA. Results from d 1 and 2 were analyzed independently. Differences in food intake and macronutrient selection were determined on d 2 only by multivariate ANOVA. In addition, hunger and food intake data were analyzed and compared by group, restrained vs. nonrestrained. Results are presented as mean ± se (sem). Significance for all measures was defined as P < 0.05.
Results
Plasma glucose and insulin
Baseline fasting glucose concentrations were similar on the 2 experimental days (4.7 ± 0.1 mmol/liter, HGl, vs. 4.6 ± 0.1 mmol/liter, HFr). As expected, plasma glucose excursions were lower after HFr meals than after HGl meals (Fig. 1). This effect was most pronounced after dinner. The AUC for glucose over the first 12 h and the entire 24-h sampling period was reduced by 55 ± 7% and 39 ± 9%, respectively (both P < 0.001), on the day HFr beverages were consumed compared with the day HGl beverages were consumed (Table 1).
Plasma glucose concentrations during a 24-h period (0800–0800 h) in 12 women consuming HGl or HFr beverages with each meal. To convert glucose concentrations to millimoles per liter, multiply by 0.556.
AUC above baseline (0800–0900 h) for the 23 h after the three morning baseline samples were collected, except for leptin, which is the 24-h AUC above morning trough concentrations
| HGl | HFr | t | P | |
|---|---|---|---|---|
| Glucose (mmol/liter·23 h) | 43.4 ± 5.2 | 23.9 ± 3.7 | 4.3 | <0.0025 |
| Lactate (mmol/liter·23 h) | 7.6 ± 2.0 | 18.5 ± 2.7 | 3.6 | <0.0025 |
| Insulin (pmol/liter·23 h) | 6658.2 ± 495.6 | 3261.6 ± 309.0 | 7.0 | <0.0001 |
| Leptin day (ng/ml·12 h) | 108.5 ± 9.8 | 69.1 ± 7.5 | 3.9 | <0.0025 |
| Leptin night (ng/ml·12 h) | 191.3 ± 28.5 | 149.4 ± 7.6 | 2.0 | <0.05 |
| Leptin total (ng/ml·24 h) | 300.8 ± 30.7 | 218.5 ± 22.8 | 2.8 | <0.01 |
| GIP (pg/ml·23 h) | 49.2 ± 16.8 | 51.5 ± 11.5 | 0.9 | ns |
| GLP-1(7-36) (pg/ml·23 h) | 46.0 ± 19.7 | 112.7 ± 32.8 | 3.4 | <0.01 |
| TG (g/liter·23 h) | −2.1 ± 1.6 | 13.8 ± 6.4 | 3.0 | <0.01 |
ns, Not significant.
Mean fasting insulin concentrations were slightly lower on the HFr treatment day (48.0 ± 4.8 pmol/liter, HGl, vs. 38.4 ± 3.0 pmol/liter, HFr). Plasma insulin responses to each HFr meal were markedly lower, and average peak insulin responses were reduced by 65 ± 5% (P < 0.001) compared with after HGl meals; however, the timing of the peaks was not significantly different (Fig. 2). Overall insulin secretion during the 23-h study as defined by the AUC above fasting concentrations was blunted by 49 ± 5% (P < 0.001) during HFr consumption compared with the day of HGl consumption (Table 1).
Plasma insulin concentrations during a 24-h period (0800–0800 h) in 12 women consuming HGl or HFr beverages with each meal. To convert insulin concentrations to micromoles per liter, multiply by 6.
Plasma leptin
Plasma leptin concentrations at 0800 h and morning nadir leptin concentrations, which generally occurred between 1000 and 1200 h, were not different between the HFr and HGl study days (13.0 ± 2.0 ng/ml, HGl, vs. 11.7 ± 0.8 ng/ml, HFr). On the day the HGl meals were consumed, plasma leptin increased from a morning nadir of 11.2 ± 1.4 ng/ml to a nocturnal (0030–0230 h) peak of 24.8 ± 2.2 ng/ml (Δ = +13.6 ± 1.4 ng/ml; P < 0.001; Fig. 3). The percentage change over nadir concentrations was 136.2 ± 17.3% (P < 0.001). On the HFr day, plasma leptin increased from a morning nadir of 9.5 ± 0.7 ng/ml to a nocturnal peak of 19.8 ± 1.7 ng/ml (Δ = 10.3 ± 1.1 ng/ml; P < 0.001; Fig. 3). The percentage change over nadir levels for the HFr day was +108.8 ± 9.3% (P < 0.001). The amplitude of the nocturnal peak on the HFr day was reduced by 24 ± 6% (P < 0.003) compared with the HGl day. The AUC for leptin during the first 12 h of the study was 33 ± 7% smaller (P < 0.001), and overall leptin production as assessed by the 24-h AUC was 24 ± 7% (P < 0.005) smaller on the HFr day than on the HGl day (Table 1).
Change of plasma leptin concentrations over mean baseline levels (0800–0900 h) during a 24-h period (0800–0800 h) in 12 women consuming HGl or HFr beverages with each meal. To convert leptin concentrations to nanomoles per liter, multiply by 0.0625
Ghrelin
Baseline fasting plasma ghrelin concentrations were not different on the HGl days (316 ± 35 pg/ml) compared with the HFr days (300 ± 28 pg/ml). There was a diurnal pattern in the ghrelin levels (Fig. 4), with a nocturnal peak between 2300 and 0300 h that gradually declined until 0800 h, similar to what has been described previously (15, 25). On the HGl day, plasma ghrelin decreased by approximately 30–35% after each meal. The decrease from fasting baseline levels was −105 ± 21, −92 ± 21, and −97 ± 21 pg/ml (all P < 0.0025) (Fig. 4) after breakfast, lunch, and dinner, respectively. When fructose was consumed, there was higher interindividual variability, and the mean postprandial suppression of ghrelin below baseline levels was markedly attenuated, decreasing by −52 ± 30 (not significant), −34 ± 20 (not significant), and −53 ± 18 pg/ml (P < 0.01), after breakfast, lunch, and dinner, respectively (Fig. 4). The degree of suppression of ghrelin was significantly greater after each glucose-containing meal compared with the corresponding fructose-containing meal (P < 0.05 for each meal). During the evening/early morning hours from 2300–0300 h of the HFr day, plasma ghrelin concentrations were elevated compared with baseline levels (Δ = +72 ± 31 pg/ml; P < 0.025). In contrast, plasma ghrelin concentrations were not increased above baseline levels during this time on the HGl day (Δ = +7 ± 34 pg/ml). However, due to a large degree of individual variation, the nighttime increase of ghrelin levels was not significantly greater on the HFr day compared with the HGl day (P = 0.075).
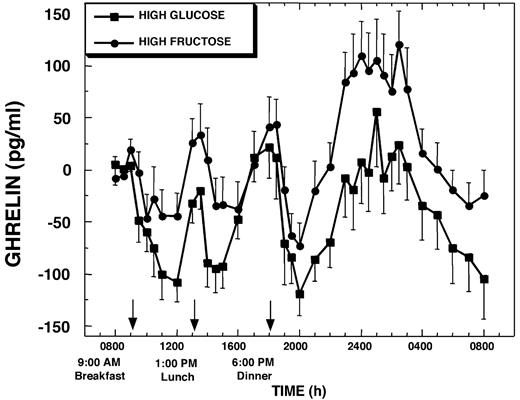
Change of plasma ghrelin concentrations over mean baseline levels (0800–0900 h) during a 24-h period (0800–0800 h) in 12 women consuming HGl or HFr beverages with each meal. To convert ghrelin concentrations to picomoles per liter, multiply by 0.296.
GIP and GLP-1
Plasma levels of GIP (654 ± 126 pg/ml, HGl, vs. 583 ± 83 pg/ml, HFr) and GLP-1 (3.6 + 0.7 pg/ml, HGl, vs. 3.5 ± 0.5 pg/ml, HFr) were similar in the fasting state before administration of each dietary condition and increased after each meal on both the HFr day and the HGl day (Figs. 5 and 66). After meal ingestion, GIP concentrations increased more rapidly when glucose was consumed compared with after fructose ingestion. Overall, GIP levels remained higher throughout the daytime hours on the HGl day than on the HFr day. When HGl beverages were consumed with breakfast, plasma GIP levels increased within 30 min by 726 ± 120 pg/ml (P < 0.001) (%Δ = +158 ± 52%; P < 0.01), whereas when HFr beverages were consumed plasma GIP levels were not significantly increased until 60 min after breakfast. A similar 30- to 60-min delay of plasma GIP responses was also observed after lunch and dinner on the HFr day (Fig. 5). The plasma GIP response after breakfast was larger when glucose was ingested compared with fructose. The AUC for GIP after breakfast was 6722 ± 1502 pg/ml·h on the HGl day and was lower on the HFr day, averaging 3825 ± 742 pg/ml·h (%Δ vs. HGl = −31 ± 9%; P < 0.005). No significant differences in the magnitude of the GIP response were observed after lunch or dinner or in the overall 23-h GIP response (AUC above baseline) between the two treatments (Table 1).
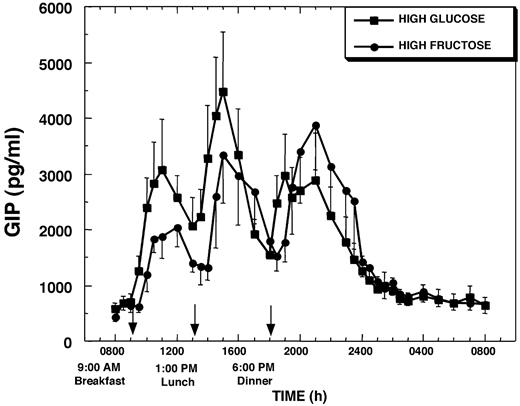
Plasma GIP concentrations during a 24-h period (0800–0800 h) in 12 women consuming HGl or HFr beverages with each meal. To convert GIP concentrations to picomoles per liter, multiply by 0.201.
![Plasma active form of GLP-1 [GLP-1(7-36)] concentrations during a 24-h period (0800–0800 h) in 12 women consuming HGl or HFr beverages with each meal. To convert GLP-1(7-36) concentrations to picomoles per liter, multiply by 0.298.](https://oup.silverchair-cdn.com/oup/backfile/Content_public/Journal/jcem/89/6/10.1210_jc.2003-031855/1/m_zeg0060404870006.jpeg?Expires=1716325684&Signature=kw3V5Qb8c7jX-sGvrEdrbwmddo~AbvnifU-9ccF3lLZPH8TnrA3ST4RNlrEapGHjZuNXSvldsQPMT7jj4fP8RZGK-kyIoMiu3cLwBMk2HfVl2TGk6KXJ-F8GAEbQaRI3t0nJQ762H~Viigb5p1MWt8n~9vZYigsFjJG3gXeJBgV7ojIaVG-5MFAj3dGhebWTNAuJdXieg0jUvHp-wGK9nLWAk5IUwME3WNptzV6wEjbimCMD0lIzOgcCC24~dYnqKhdgKJqBb06G2cVIMVqcWU2vDDe460rcEykBW4~hmUTt8Z~E9Wdrz2hcxdbSdrFxv6Nj5dbHkPBGLYBOpyRcxA__&Key-Pair-Id=APKAIE5G5CRDK6RD3PGA)
Plasma active form of GLP-1 [GLP-1(7-36)] concentrations during a 24-h period (0800–0800 h) in 12 women consuming HGl or HFr beverages with each meal. To convert GLP-1(7-36) concentrations to picomoles per liter, multiply by 0.298.
Peak values of the active form of GLP-1, GLP-1(7-36), after meals did not differ between HFr and HGl days; however, GLP-1(7-36) levels remained elevated for a longer period (up to 120 min) after HFr than after HGl meals (Fig. 6). Although plasma GLP-1(7-36) tended to remain elevated after breakfast on HFr day, integrated GLP-1(7-36) responses after breakfast were not significantly different on the HFr and HGl days. However, the integrated GLP-1(7-36) responses were significantly larger on the HFr day after lunch (AUC = 20.1 ± 4.0 vs. 10.2 ± 3.3 pg/ml·h; P < 0.003 vs. HGl) and dinner (AUC = 11.4 ± 2.7 vs. 6.6 ± 3.2 pg/ml·h; P < 0.05 vs. HGl), due to the prolongation of the responses. As a result, the integrated 24-h plasma GLP-1(7-36) concentrations above baseline were significantly greater on the HFr day compared with the HGl day (Table 1).
Plasma TGs and FFAs
Baseline plasma TGs were not different on the experimental days (0.76 ± 0.06 g/liter, HGl, vs. 0.73 ± 0.08 g/liter, HFr). Plasma TG increased more rapidly during the intermeal interval (4–5 h after breakfast) and achieved higher peak concentrations when the subjects consumed HFr beverages than when they consumed the HGl beverages with meals (Fig. 7). Plasma TG remained elevated after meals and throughout most of the 24-h study period on the HFr day, whereas on the HGl day plasma TGs declined after the major postprandial peaks and remained below baseline levels during the nighttime hours (Fig. 7). Plasma TG levels at 0800 h on the morning after the HFr day were 0.24 ± 0.05 g/liter (24 ± 5 mg/dl) higher (P < 0.001) than baseline, representing a 34.9 ± 9.1% (P < 0.003) increase over baseline concentrations. In addition, the plasma TG concentration at 0800 h was significantly greater than at this same time after the HGl day (P < 0.003). Overall, the 23-h AUC for TG relative to baseline concentrations was slightly negative on the HGl day, but markedly increased above baseline levels on the HFr day (Table 1).
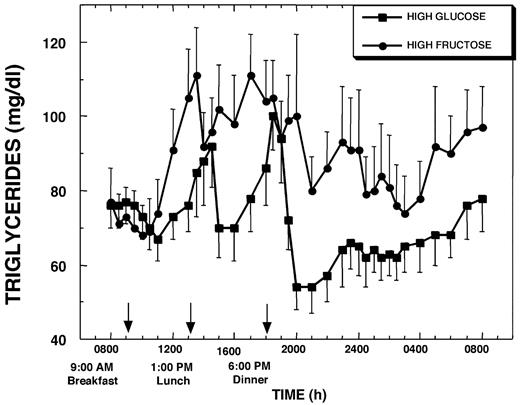
Plasma TG concentrations during a 24-h period (0800–0800 h) in 12 women consuming HGl or HFr beverages with each meal. To convert TG concentrations to millimoles per liter, multiply by 0.0114.
Fasting plasma FFA levels were similar on the 2 study days and were rapidly and markedly suppressed after both HGl (0.51 ± 0.12 g/liter) and HFr (0.49 ± 0.05 g/liter) meals. The increase of plasma FFA levels after postmeal suppression was larger after lunch, and the nocturnal levels after the postdinner nadir appeared higher on the HGl than the HFr day (Fig. 8). However, the overall FFA exposure above fasting baseline levels was not statistically different between the 2 study days, and the small differences would not be expected to influence insulin sensitivity. It should be noted that the temporal pattern of the changes of plasma FFA and plasma ghrelin concentrations were quite similar, with increases of ghrelin preceding the increases of FFAs by approximately 15 min.
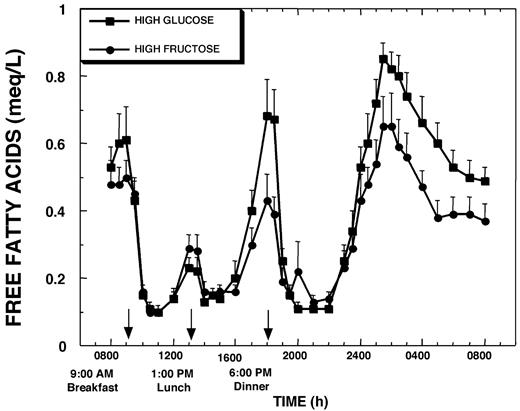
Plasma FFA concentrations during a 24-h period (0800–0800 h) in 12 women consuming HGl or HFr beverages with each meal. To convert FFA concentrations to millimoles per liter, multiply by 3.55.
Hunger ratings and food intake measurements
Integrated hunger ratings in all subjects were not significantly different between the HGl and HFr meals on d 1 when the diet was controlled (22,620 ± 2,142/15 h, HGl, vs. 22,554 ± 3,283/15 h, HFr) or on d 2 when subjects were permitted to eat ad libitum (11,622 ± 1,463/10 h, HGl, vs. 11,244 ± 1,712/10 h, HFr). Furthermore, total energy intake (1816 ± 509 kcal, HGl, vs. 1958 ± 598 kcal, HFr), total fat intake (37.1 ± 13.9 g, HGl, vs. 42.2 ± 13.5 g, HFr), and total carbohydrate intake (275.7 ± 111 g, HGl, vs. 289.5 ± 101 g, HFr) were not significantly different between the 2 treatment days.
When subjects were grouped into restrained and unrestrained eaters, restrained eaters exhibited significant increases of hunger on d 1 of the HFr treatment (22,680 ± 4,925/15 h) compared with d 1 of the HGl treatment (18,400 ± 2,423/15 h; F(1,8) = 8.0; P < 0.02; Fig. 9). Unrestrained eaters did not exhibit any differences in hunger ratings on d 1. No significant differences in hunger were recorded on d 2 in the restrained eaters. The lack of increase in hunger on the day after the HFr treatment in the restrained eaters would be explained by the significant (∼50%) increase in the amount of dietary fat (known to be satiating in the short-term) ingested on the second day of the study in this group of subjects (HGl, 32 ± 6 g, 289 ± 55 kcal; vs. HFr, 47 ± 6 g, 425 ± 53 kcal; F(1,10) = 6.62; P < 0.03) (Fig. 9). Thus, restrained eaters recorded increased hunger during the day of HFr ingestion when their dietary intake was controlled. On the subsequent day, in an ad libitum feeding situation, they exhibited a compensatory increase in fat intake, thereby alleviating the increase in hunger. The increase in fat intake was not reflected by an increase in total energy intake in this small subset of individuals, although mean values tended to be higher (∼20%) in the restrained subjects on the HFr day (1801 ± 238 kcal, HGl, vs. 2154 ± 268 kcal, HFr). As would be expected, unrestrained eaters consumed more fat than restrained eaters in an ad libitum setting on the HGl treatment day. However, in contrast to the significant increase of fat intake after HFr exposure observed in restrained eaters, the unrestrained eaters did not exhibit either an increase in hunger or an increase in food intake after the HFr treatment. These differential responses between subjects with the two behavioral subtypes do not appear to result from differences in their hormonal responses because no significant differences were found in plasma ghrelin or leptin responses to the two treatments between the restrained and unrestrained eaters. Thus, it may be that restrained eaters were more sensitive to the ensuing behavioral effects of the endocrine/metabolic profile elicited by fructose consumption on the preceding day.
![Left, Hunger ratings (AUC over a 15-h period) on d 1 during the HGl and HFr dietary manipulations. Significant treatment by time by behavioral trait (restraint) interactions were found on d 1 when food consumption was controlled. Restrained (n = 5), but not unrestrained (n = 7), subjects reported greater hunger on the HFr day compared with the HGl day [(F(1, 8 ) = 8.0; P < 0.03)]. Right, Total fat intake (kilocalories) on the day after dietary HGl diets and HFr diets during which subjects were permitted ad libitum and eating. Unrestrained subjects selected significantly more total fat than restrained subjects on the day after HGl (P < 0.05). No significant differences in total fat intake between the HGl and HFr days were observed in unrestrained eaters. Significantly greater fat intake was observed on the day after HFr compared with after HGl in the restrained eaters [F(1, 10 ) = 6.62; P < 0.03].](https://oup.silverchair-cdn.com/oup/backfile/Content_public/Journal/jcem/89/6/10.1210_jc.2003-031855/1/m_zeg0060404870009.jpeg?Expires=1716325684&Signature=ubEr27Iw1RU-v1KP0TrQxvzy35EDohMm4hWAYr~CMQJfsZwfNOQiJOQI1RWEdJ7c8nu8iGnlBa6Lm7NvrtBZJfhpEaz3CKj0vX5D7lMAMRbTnKFQOelCerPzBtu~KjC7DIWgAloQwKm1GQ-1S6G94xrcHP6pxgOyn4DRPQaPru~L7dh0HgrDZQ0HZAqE7IQ9Fx9-xv82i9QySZ6IaiHUE4LI65QhW7dFyCEzFXA4XOIvmcg31HLTXf4-3EElUrasKdhoZXFyBw2ZROx1Wv4izfoA9edobBzZoIfStQRum64rbW0aSb0MCIg~emM6GFT33FRIBawJ6yHZqpEefHIYPg__&Key-Pair-Id=APKAIE5G5CRDK6RD3PGA)
Left, Hunger ratings (AUC over a 15-h period) on d 1 during the HGl and HFr dietary manipulations. Significant treatment by time by behavioral trait (restraint) interactions were found on d 1 when food consumption was controlled. Restrained (n = 5), but not unrestrained (n = 7), subjects reported greater hunger on the HFr day compared with the HGl day [(F(1, 8 ) = 8.0; P < 0.03)]. Right, Total fat intake (kilocalories) on the day after dietary HGl diets and HFr diets during which subjects were permitted ad libitum and eating. Unrestrained subjects selected significantly more total fat than restrained subjects on the day after HGl (P < 0.05). No significant differences in total fat intake between the HGl and HFr days were observed in unrestrained eaters. Significantly greater fat intake was observed on the day after HFr compared with after HGl in the restrained eaters [F(1, 10 ) = 6.62; P < 0.03].
Discussion
The major aim of this study was to compare effects of fructose and glucose on endocrine signals involved in the regulation of body adiposity and energy metabolism, as well as glucose and lipid metabolism. In a previous study in normal-weight women, we reported that high-fat, low-carbohydrate meals produced smaller excursions of plasma insulin and glucose than low-fat, high-carbohydrate meals, resulting in reduced circulating leptin concentrations over a 24-h period (1). The results of the present study, also in young, normal-weight women, indicate that like fat, consuming fructose with a mixed meal results in substantially smaller postprandial plasma glucose and insulin excursions and attenuated circulating leptin profiles when compared with glucose.
Fructose does not stimulate insulin secretion (7), presumably because pancreatic β-cells have low levels of the fructose transporter, glucose transporter 5 (28). Thus, iv fructose infusion only marginally increases circulating insulin concentrations (8), and ingested fructose is ineffective in eliciting postprandial insulin secretion (29). When the effects of iv glucose and fructose infusion were compared in monkeys, plasma leptin concentrations were increased by 4 h after the start of the glucose infusion. In contrast, leptin did not increase during infusion of the same amount of fructose (8). We have reported that leptin production by adipocytes is regulated by insulin-mediated glucose metabolism (2, 30). Accordingly, the reduction of circulating leptin in response to fructose infusion is likely the result of the smaller insulin and glucose excursions leading to less insulin-induced glucose utilization by adipose tissue. Thus, in the present study, as predicted, consumption of three high fructose meals resulted in reductions in the amplitude of the diurnal leptin pattern (peak − nadir) and of circulating leptin levels over 24 h when compared with HGl meals. The diurnal pattern of the circulating leptin may be an important determinant of its biological effects because the proportional amplitude (percentage change) of leptin was predictive of the loss of weight and body fat during a 12-wk ad libitum low-fat diet (10).
The smaller postprandial excursions of circulating glucose and insulin after consumption of fructose beverages with meals may also contribute to the attenuated suppression of ghrelin secretion after subjects consumed HFr beverages, compared with HGl beverages with meals. Insulin and glucose have been shown to decrease circulating ghrelin in rodents and humans (31–34). Ghrelin has been the focus of considerable attention due to its potent effects to stimulate food intake in animals (35) and humans (14). The suppression of ghrelin after meal ingestion is blunted in obese subjects compared with normal-weight subjects (36), and circulating ghrelin is markedly elevated in patients with Prader-Willi syndrome (24, 37), a genetic disorder characterized by marked hyperphagia and obesity. Plasma ghrelin levels increase after diet-induced weight loss (25) but remain dramatically reduced in patients after weight loss induced by gastric bypass surgery (25, 38). The relative elevation of plasma ghrelin after fructose ingestion in the present study suggests that a failure of fructose to suppress ghrelin, along with reduced insulin and leptin, could contribute to decreased satiety and increased food intake during long-term fructose consumption.
In this study, we observed delayed and reduced GIP responses and prolonged GLP-1 responses when HFr beverages were consumed with each meal. Other investigators have reported that ingestion of fructose by itself does not stimulate GIP release (19). It is unlikely that the decreased GIP responses are due to delayed gastric emptying because fructose ingestion increases gastric emptying (39). We hypothesize that although consumption of the HGl beverages with a meal provides a rapid direct stimulus for GIP release, GIP release after the consumption of the HFr beverages with a mixed meal is dependent on delivery of the other nutrients in the meal to the intestine, resulting in an attenuated/delayed GIP response.
Although the effects of glucose and fructose in isolation on GLP-1 release have been reported (18, 19), the effects of consuming the two sugars in combination with mixed meals over a 24-h period have not been compared. The results indicate that fructose ingestion prolonged the postprandial release of GLP-1. Given that we specifically measured the intact peptide, which is rapidly metabolized by dipeptidyl peptidase IV (40), it is likely that the prolonged GLP-1(7-36) responses are due to increased secretion rather than reduced clearance. It does not appear likely that either the observed delay in GIP release or increased GLP-1 release makes a major contribution as incretins (41) to the differences in insulin secretion after glucose and fructose consumption because the temporal patterns of the hormones do not coincide with the insulin responses. Although GLP-1 responses to meals could potentially lead to decreased food intake, perhaps by delaying gastric emptying (42), the magnitude of difference is relatively small.
Ingestion of HFr beverages with meals resulted in elevated TG levels compared with HGl beverages. The increase in postprandial TG levels after fructose ingestion is likely to reflect differences in the hepatic metabolism of fructose and glucose. Fructose is phosphorylated by fructokinase to fructose-1-phosphate. Unlike the glycolytic metabolism of glucose via phosphofructokinase, fructokinase is not subject to feedback inhibition by cytosolic citrate and ATP (20). Thus, in contrast to glucose, when large amounts of fructose are ingested, the glycolytic pathway becomes saturated with the fructose carbon, and TG production is facilitated from increased carbon flux into both the glycerol and the acyl portions of TG (20, 43). Decreased TG clearance could also contribute to the increased TGs after fructose ingestion (44, 45). The observed decrease in circulating leptin levels could be an additional mechanism by which fructose influences TG levels because leptin is known to promote fat use (3). Other investigators have reported that TG increases during more long-term consumption of diets high in fructose (46) or sucrose (47) compared with HGl or starch diets (48). We have reported that the effect of fructose to increase postprandial TG persists during 10 wk of fructose consumption and that plasma levels of the atherogenic lipoprotein, Apo-B, are also elevated after long-term fructose, but not glucose consumption (49). Thus, it is possible that the type of carbohydrate, specifically the fructose contained in added sugars, contributes to the known effect of high-carbohydrate diets to raise TG levels. Furthermore, existing hyperlipidemia (45) and/or insulin resistance (50) may predispose individuals to greater postprandial hypertriglyceridemia after consuming fructose.
The two main sources of fructose in the U.S. diet are sucrose, which consists of 50% fructose, and HFr-fructose corn syrup (HFCS), typically containing 55% fructose. It is estimated that fructose consumption has increased by at least 26% over the past three decades (11), primarily due to the increased use of HFCS in soft drinks and other beverages. The average per capita disappearance data for added fructose in 1997 from the combined use of sucrose and HFCS was 81 g/d (11). Individuals in the 90th percentile of fructose intake are estimated to consume between 1.5 and 2.5 times the mean intake (51). In the present study, the amount of fructose consumed was 45 g at each meal, which is approximately the same amount of fructose as that found in 670 ml (24 oz) of soft drink. Because this is equivalent to approximately 1.5 times the average intake, it is likely that a significant portion of the population is consuming comparable amounts of fructose.
The prevalence of obesity in the U.S. population (12, 13) has increased over the same time period as the increase in fructose consumption. Results of the present study indicate that fructose appears to behave more like fat than like other carbohydrates with respect to insulin secretion, leptin production, and postprandial TG levels. Furthermore, fructose, unlike glucose does not cross the blood-brain barrier and could potentially contribute to increased energy intake because it does not trigger CNS glucose sensors involved in the regulation of food intake (52). Increased fructose consumption, along with consumption of larger portions of high-fat foods and inactivity, may be a contributing factor to the increased incidence of obesity. Studies in humans have reported weight gain during prolonged ad libitum consumption of fructose (53, 54), In addition, fructose ingestion leads to increased rates of de novo lipogenesis (55) compared with eucaloric glucose ingestion (56). Children who consume more than 265 ml (9 oz) of soda per day have a 15% higher energy intake than those who do not regularly consume soft drinks (57), and for each sugar-sweetened beverage consumed, both body mass index and the frequency of obesity in children are increased (58).
We found that ingestion of meals with HFr beverages resulted in subsequent increases of hunger and fat intake compared with the same meals with HGl beverages, but only in a subset of subjects with a psychological profile of dietary restraint. These data suggest that certain individuals are more susceptible to the effects of the endocrine/metabolic profile elicited by fructose ingestion. Many obese individuals exhibit a high degree of dietary restraint. Thus, these individuals remain obese despite their efforts to curtail caloric and fat intake through dieting (59, 60). Furthermore, children even as young as 5 yr can exhibit restrained eating behavior (61, 62). These results demonstrate one of the difficulties in identifying the physiological mechanisms regulating body weight in humans, i.e. that psychological attitudes toward food impact eating behavior (63–65). Although the limited number of subjects in the present study precludes any definitive conclusions, the results provide groundwork for future investigations. The finding that ingestion of fructose beverages with mixed nutrient meals is associated with a subsequent increase of food intake contrasts with two other studies that reported decreased caloric intake after a fructose preload compared with a glucose preload. However, in those experiments, the effects of the fructose on food intake were only evident when the sugar was ingested alone and not in combination with a mixed meal (66, 67). Furthermore, unlike the present study, which examined the effects of repeated fructose ingestion over 24 h, previous studies only measured acute responses.
In summary, consuming HFr beverages with meals results in lower circulating insulin and leptin concentrations and higher ghrelin and TG levels compared with consumption of HGl beverages. Because insulin, leptin, and possibly ghrelin function as key signals to the CNS in the long-term regulation of energy balance (4, 35, 52, 68), prolonged consumption of diets high in energy from fructose could lead to increased caloric intake and contribute to weight gain and obesity. The sustained elevation of plasma TG levels after fructose ingestion suggests that chronic fructose consumption could contribute to atherogenesis and cardiovascular disease. Additional studies are needed to investigate the effects of prolonged fructose consumption on the endocrine signals regulating energy homeostasis, insulin action, and lipid metabolism, as well as its long-term effects on appetite and energy intake.
Acknowledgments
We acknowledge the expert technical assistance of Patrice Cowan, Kimber Stanhope, James Graham, Anna Lillethun, Linda Morrell, and the nurses at the General Clinical Research Center of the Hospital of the University of Pennsylvania.
This work was supported by a grant from the Human Nutrition Institute of the International Life Sciences Institute Research Foundation (ILSI RF); National Institutes of Health Grants DK-35747, DK-58108, and M01-RR00042; the American Diabetes Association; The American Physiological Society; and the U.S. Department of Agriculture.
The opinions expressed herein are those of the authors and do not necessarily represent the views of ILSI RF.
Abbreviations:
- AUC,
Area under the curve;
- CNS,
central nervous system;
- FFA,
free fatty acid;
- GCRC,
General Clinical Research Center;
- GIP,
glucose-dependent insulinotropic polypeptide;
- GLP-1,
glucagon-like peptide-1;
- HFCS,
HFr corn syrup;
- HFr,
high fructose;
- HGl,
high glucose;
- TG,
triglyceride.
References
Putnam JJ, Allshouse JE 1999 Food consumption, prices and expenditures, 1970–1997. Washington, DC: U.S. Department of Agriculture, Economic Research Service
