

Abstract
Critical slowing down is considered to be an important indicator for predicting critical transitions in dynamical systems. Researchers have used it prolifically in the fields of ecology, biology, sociology, and finance. When a system approaches a critical transition or a tipping point, it returns more slowly to its stable attractor under small perturbations. The return time to the stable state can thus be used as an index, which shows whether a critical change is near or not. Based on this phenomenon, many methods have been proposed to determine tipping points, especially in biological and social systems, for example, related to epidemic spreading, cardiac arrhythmias, or even population collapse. In this perspective, we briefly review past research dedicated to critical slowing down indicators and associated tipping points, and we outline promising directions for future research.
Export citation and abstract BibTeX RIS
Introduction
The passing of time allows many bifurcations in complex dynamical systems such as climate, lake, neurons, and financial markets [1–3]. Such bifurcations (which are called tipping points) are very important. Many methods have been proposed to predict them. Two main viewpoints on the prediction of tipping points are based on a) the system's model and b) its time series [4,5]. Many studies have been done on the importance of tipping points in climate systems [6,7]. In [8], the authors investigated the effect of climate reddening on critical transitions. They showed that memory is as essential as the variance in understanding the tipping points of climate systems. Tipping points of global pollination systems have been studied in [9]. Forest carbon uptake of semi-arid Mediterranean pine forests has been discussed from the viewpoint of multidecadal shifts in [10].
The "tipping point" was first used in the study of racial segregation [11]. After the year 2000, this term was used as a critical transition in many applications such as climate and ecology [1]. For example, the shallow Dutch Lake Veluwemeer had clear water for many years. In time, nutrient loads in the water increased gradually and made the water darker. Due to the lack of sunlight, the growth of immersed plants decreased. Thus, the lake system transferred to a new state (dark state) in 1960, which cannot recover easily [12]. A social-ecological model has been used to illustrate the effect of technology on resource degradation. It can push the most vulnerable members of society into a poverty trap [13]. The relation of ecological and evolutionary processes affects tipping points in nature [14]. The effect of interaction to help tolerate a community in environmental perturbations was discussed in [15].
There are two ways for a tipping point to appear. One of them is when a system's parameter gradually changes and causes a massive shift from one stable attractor to another [16]. The second way is when perturbations in the state force the system to bifurcate [17]. In other words, a perturbation passes the system's state from the boundary of the basin of attraction of one stable attractor to another. The maximum perturbation for which the system's state remains in its current stable attractor is called resilience. Figure 1 shows the stability landscape for the two types of occurring tipping points.
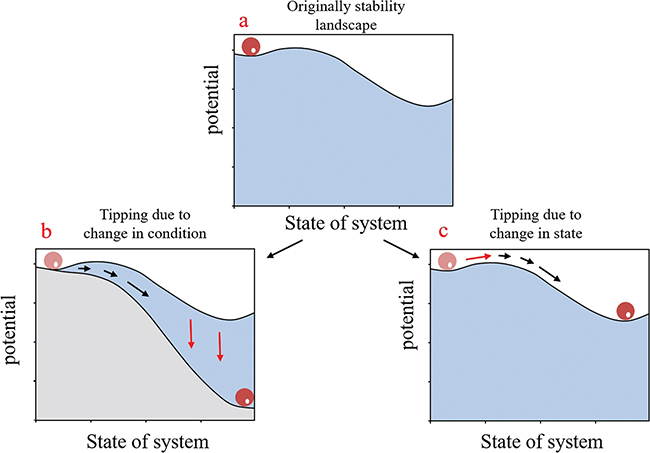
Fig. 1: Different paths to a bifurcation (a) in the stability landscape, (b) by changing conditions, (c) by changes in the state due to a perturbation. Red arrows show the route towards the bifurcation point. Figure reproduced with permission from [5].
Download figure:
Standard imageUsually, the tipping point is defined as shifting from one equilibrium point to another. In [18], the cyclic dynamic was discussed as the system's dynamic, which bifurcates from one cycle to another. Predicting more complex bifurcation points than period-one dynamics was discussed in [19]. Lyapunov exponent can predict various bifurcations in a period-doubling route to chaos [20,21]. In [22], various dynamics of fluctuations of animal populations other than equilibrium points such as irregular waxing and waning were discussed.
There are some signs to detect when a tipping point is imminent. One of them is critical slowing down. The return rate from small perturbation and short-time memory of signal depicts this phenomenon [23]. The other sign is variation in the stability of stochastic systems. In this case, the system's state crosses through different attractors repeatedly, and it is called flickering [16]. The probability density function can show this phenomenon [24]. In [25], various indices of natural systems' stability were categorized into three groups: early response to pulse, sensitivities to press, and distance to threshold. They represent three different ways of looking at the stability of systems. The theory of stability and the response of systems to perturbations were studied in [26]. A bimodal distribution of the Lotka-Volterra system was discussed in [27].
In the next section, we survey critical slowing down indicators from various viewpoints. Some important applications of critical slowing down indicators are discussed in the third section. The fourth section surveys the limitations of critical slowing down indicators in various applications. Finally, the fifth section concludes the paper.
Critical slowing down indicators
The critical slowing down indicators can be studied in two groups, measures based on time series and measures based on the model. Measures based on time series use different time series properties, while measures based on model adapt a general model to the time series [4].
In the measures based on time series, there are many methods. One of them is autocorrelation and spectrum properties. Near a tipping point, the return rate to the stable attractor under small perturbations becomes slower [28,29] and causes an increase in the system's short-term memory [30,31] as measured by autocorrelation. Power spectrum analysis considers spectral properties of the time series [32]. Another critical index is variance. The slowness of the return rate near a tipping point can cause sliding around the stable state. Also, the strong perturbation can push the state to another stable attractor (flickering). Both slowness and flickering cause increases in the variance [33]. Near a tipping point, the return rate to the stable state is slower, which causes changes in the skewness [34]. Also, the kurtosis is increased because of flickering [35]. Detrended fluctuation analysis can measure the short-time and medium-time memory of a time series. Thus, it is used as a tipping point indicator [36]. Conditional heteroscedasticity measures variations in the time series pattern and can be used as a critical slowing down indicator [37]. Kolmogorov complexity measures the stochasticity of the signal and can predict tipping points [38]. A nonlinearity measure was used to predict tipping points of populations under stress [39].
Measures based on models use a general model to predict tipping points. As an example, the nonparametric drift-diffusion-jump model can present a large family of nonlinear processes [40]. Using this model, variance and diffusion are calculated, and tipping points are detected [41]. A time-variant autoregressive model is another tipping point indicator that measures the instant return rate [42]. The threshold autoregressive model characterizes jumping between two stable attractors [42].
The performance of critical slowing down indicators in different fields such as physics, physiology, and finance was categorized in [16]. Recently, researchers have proposed causality methods instead of correlation and regression methods to predict tipping points [43]. In [44], an autocorrelation-based method was compared with a variance-based method. It was shown that the method based on autocorrelation was less robust to short or low-resolution time series; however, it was more robust to noise levels.
Tipping points can be studied in a network of interactive elements [45]. The recovery rate from small-scale perturbations in an ecological network has been studied as an indicator of tipping points [46]. The transitions from a synchronized to a desynchronized state and detecting these transitions using resilience indicators were studied in [47]. Prediction of the tipping point in a mutualistic network was studied in [48]. A model-free early warning indicator based on a dynamical network biomarker was discussed in [49]. Most of the studies on network resilience have been done on internal stress, such as node removal. In [50], the network's resilience to external stress was investigated. Early warning indicators that characterized the topological properties of the network were used in [51]. The dynamic network biomarker was designed to predict the influenza outbreak in [52]. A review of the resilience and stability in complex networks and their regime shifts has been done in [53]. In a complex system with many interacting components, some components have good early warning signals, while others do not offer much information for critical transitions. Researchers in [54] proposed a data-driven method to determine the best components based on their reliability.
Applications to biological systems
Biological systems such as the heart, neural system, neuromuscular system, respiratory system, and immune system have a complicated dynamic and can be studied using nonlinear dynamical tools [55]. On the other hand, despite many ecology promotions, the complexity of ecosystems with unknown environmental factors makes their dynamics unpredictable [56–58]. Climate change and its effect on farmer types were studied in [59]. The importance of understanding the complex systems to realize the regime shifts and resilience of the human body has been discussed in [60].
Critical slowing down indicators can help predict attacks in chronic diseases such as asthma, heart arrhythmias, migraine, epilepsy, and depression [61]. Biological systems such as the heart [62] and migraine [63] were studied from the viewpoint of tipping points. Figure 2 shows a stability landscape of two attractors, one healthy and the other diseased. The figure depicts that in mild illness (a), the system is far away from the tipping point. The state has a high resilience while it returns to its healthy, stable state. In acute illness (b), the system is near its tipping point and has a low resilience in returning to the stable state [61]. Predicting the attack time and its severity in chronic disease can help its diagnosis and therapy. A computational model of panic disorder as a nonlinear dynamical system and its attacks has been discussed in [64]. Some dynamical diseases that show critical slowing down near their attacks were discussed in [61]. The randomness of a signal can help predict tipping points [38]. Based on this feature, Kolmogorov complexity is used to predict tipping points of three models, an environmental model in harvesting [65], a lake model [66], and a discrete Ricker-type model of the fish population [67].
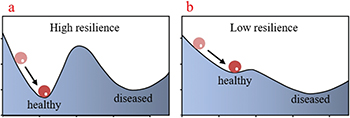
Fig. 2: Stability landscape of two attractors, one healthy and the other diseased. (a) Far from the tipping point. (b) Near a tipping point. Figure reproduced with permission from [61]. In the case of acute illness, the system is near its tipping point and has a low resilience in returning to a stable state.
Download figure:
Standard imageA period-doubling bifurcation can be observed in the inter-beat intervals (IBIs) of chick embryo hearts under the injection of a potassium channel blocker [68]. Figure 3 presents the bifurcation diagram and some examples of its time series, showing the effect of potassium channel blockers. The transition from a period-one orbit to a period-two in the inter-beat interval was estimated using critical slowing down indicators [68].
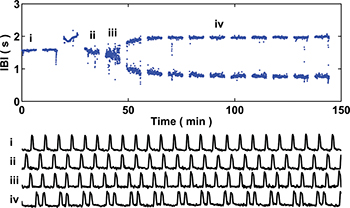
Fig. 3: Bifurcation diagram of inter-beat intervals of a chick embryo heart under the injection of a potassium channel blocker. Figure reproduced with permission from [68]. A period-doubling bifurcation is shown in the diagram, which can be predicted by critical slowing down indicators.
Download figure:
Standard imageA combination of critical slowing down indicators can help to predict tipping points better. Authors in [69] proposed combining some indicators such as standard deviation, coefficient of variation, correlation, and skewness to predict critical transitions in Daphnia magna's population. Extinction of a species is another exciting subject predicted by critical slowing down indicators [70]. This study was done on the population data of Paramecium caudatum and Didinium nasutum as prey and predator, respectively. The species interaction has a significant effect on the response of species to environmental changes [71]. When biological systems interact with the environment, the complexity increases. Thus, the detection of critical slowing down in such systems is more difficult [72].
Dynamic indicators of resilience can be used to predict system failures in biological systems [73]. In [74], the idea of increasing risks of morbidity and mortality by decreasing systemic resilience and the capacity to bounce back to normal functioning after a perturbation was investigated. The resilience of the whole depends on the resilience of subsystems that regulate vital parameters such as temperature, glucose level, and mood. Maintaining resilience is an essential point since there are many chronic diseases despite advances in the science for drugs and devices [74].
The goal of [75] was investigating practical tools to reveal the resilience of older persons in the clinical study. In [76], the authors described the structure of tests to predict resilience that are useful in clinical practice. In [77], two well-known resilience indicators, variance, and temporal autocorrelation, were applied to time series of the mediolateral center of pressure displacement and have shown successful results in the relationship between resilience and successful aging. Cross-correlation and variance of time series of self-rated health were shown which are related to the frailty level of older adults [78]. The relationship between OH, frailty, falling, and mortality was studied in [79]. In [80], a synergetic viewpoint based on critical slowing down was proposed to predict sports injuries. The effect of colored noise on the regime shifts of a gene expression model was studied in [81].
The authors of ref. [82] have used systolic blood pressure as an indicator of mortality risk. It showed that recovery of systolic blood pressure in the first minute after standing is a useful indicator. The authors of ref. [83] have shown that blood pressure measurements of exercise testing are useful to predict future risk for adverse cardiovascular events. Tilt table testing was used to diagnose syncope. Tilt table testing has also used gravity to provoke a downward shift of blood that, in turn, triggers syncope [84]. Studying noninvasively beat-to-beat blood pressure shows that initial orthostatic hypotension is related to syncope in younger adults, while delayed blood pressure recovery and sustained orthostatic hypotension is related to falls in older adults [85]. Average systolic orthostatic blood pressure response was used as an early marker for dementia risk in older adults [86].
Early warning indicators have attracted some attention in the prediction of depression [87]. In [88], temporal autocorrelation, variance, and the correlation between fluctuations of self-reported emotions were used to predict the tipping points of depression. Many studies have discussed epileptic seizures as a tipping point and their prediction [89–92]. Gain and losses of symptom severity for mood disorders in patients can be predicted using early warning signals of daily self-ratings [93].
Limitations of critical slowing down indicators
There are some limitations to the performance of critical slowing down indicators. For example, researchers in [94] have shown that several significant factors in the dynamics of yeast population can cause the different performance of tipping point indicators. The subject is due to the difference between stability (return rate) and resilience (basin of attraction) concerning changing different significant factors. Part (a) of fig. 4 shows variations of stability and resilience when changing two parameters (Driver 1 or Driver 2). It shows that the harmony between stability and resilience can be removed when changing two parameters simultaneously. Part (b) of fig. 4 shows three cases of changing Driver 1 (blue), Driver 2 (magenta), and changing Driver 1 and Driver 2 simultaneously (black). The simultaneous change of two drivers causes a lack of harmony in stability and resilience. Thus, by changing these two drivers toward a tipping point (black curve), stability tells us that the system is getting further away from the tipping point while resilience tells us that a tipping point is near. This study was done on the yeast population.
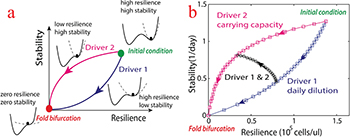
Fig. 4: (a) Stability landscape concerning changing Driver 1 (blue) and Driver 2 (magenta) [94]. (b) Variations of stability and resilience for changing Driver 1 (blue), Driver 2 (magenta), and Driver 1 and 2 simultaneously (black). Figure reproduced with permission from [94]. The simultaneous change of two drivers causes a lack of harmony in the stability and resilience in critical transition prediction.
Download figure:
Standard imageOn the limitation of critical slowing down indicators, the authors of ref. [95] have defined 6 cases of changing parameter, and critical slowing down indicators have been studied in these cases. The upper panels of fig. 5 show a bifurcation diagram (black) and the variation of the driver (red). The lower panels show autocorrelation at lag 1 (AR1, green) and standard deviation (SD, blue) related to the bifurcation. Case 1 is changing the parameter linearly and slowly. Part (a) of fig. 5 shows that AR1 and SD increase before the bifurcation point. Case 2 is changing periodically a fast-slow parameter. Part (b) of fig. 5 shows that AR1 and SD increase before the tipping point. Case 3 shows stochastic resonance and parameter changes in a sinusoidal form. In this case, the parameter just causes the state to approach the tipping point, and then the perturbation can cause a bifurcation. Due to the large perturbation, critical slowing down cannot show the bifurcation points (part (c) of fig. 5). Case 4 shows bifurcation under noisy conditions. Part (d) of fig. 5 shows that AR1 and SD cannot predict the bifurcation point in this case. Case 5 shows bifurcation under an accidentally extreme event. Critical slowing down indicators cannot predict this bifurcation (part (e) of fig. 5). Finally, case 6 shows a big stepwise change in the driver. Part (f) of fig. 5 shows that AR1 and SD cannot predict the tipping point in such a case. The performance of critical slowing down indicators in various cases of approaching the tipping points in a system with a period-doubling route to chaos was discussed in [96].
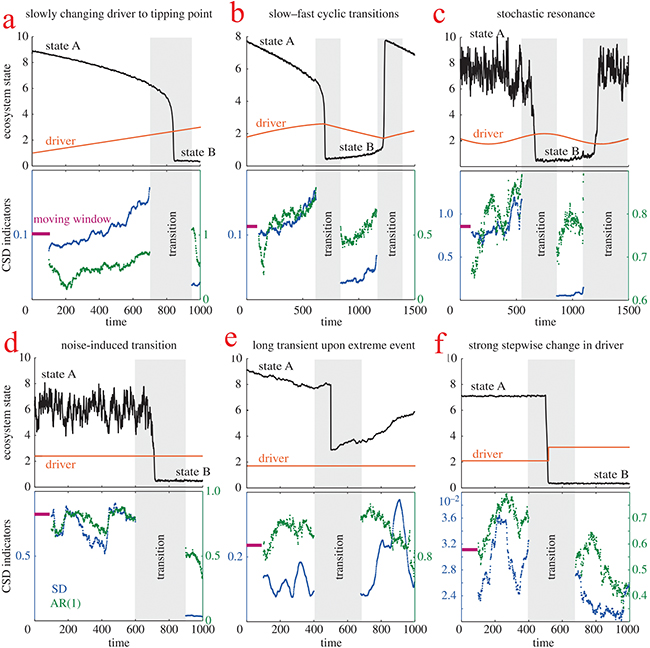
Fig. 5: Six cases of bifurcation for changing a driver (upper panels) and their calculated AR(1) (green) and SD (blue) (lower panels). Figure reproduced with permission from [95]. Critical slowing down indicators can predict transitions with variations in attractors' stability while they cannot predict cases that bifurcate with a high perturbation.
Download figure:
Standard imageIn the presence of noise, errors in the prediction of tipping points using critical slowing down indicators increase. For example, increasing the amplitude of the environment's stochastic effects increases the variance, while autocorrelation is constant. Also, increasing the colored noise increases the variance and autocorrelation [95]. Thus, critical slowing down indicators can predict a tipping point in a system while only noise was changed, and nothing happened to the dynamical system.
Conclusion
Various studies of critical slowing down and resilience before the critical transitions were surveyed in this perspective. Critical transitions and their prediction have been used in many applications, such as ecological and biological systems. The slowness before the bifurcations can be measured, and it can reveal the approach to a tipping point. Many methods were proposed to detect critical slowing down before the critical changes, which we have reviewed from various viewpoints. Especially the critical transitions and their prediction in biological systems were given attention. We have also outlined limitations to those indicators which should be considered in their applications. We hope that this perspective can illuminate future directions for the field.
Acknowledgments
This work was supported by the Slovenian Research Agency (Grant Nos. P1-0403, J1-2457, J4-9302, and J1-9112.