


One of the most important changes in the concept of schizophrenia in recent years has been the recognition that cognitive impairment is part of the disorder. Although not a defining characteristic - some individuals are neurocognitively normal or near-normal Reference Kremen, Seidman, Faraone, Toomey and Tsuang1 - deficits similar in magnitude to those seen in central nervous system disease are common, Reference Heinrichs and Zakzanis2 and in a small number of cases may attain a severity comparable with dementia. Reference Harrison3 Impairment is present in most or all areas of cognitive function but appears to be particularly marked in executive function and long-term memory. Reference Reichenberg and Harvey4 There are unanswered questions about the course of schizophrenic cognitive impairment, but the available evidence suggests that affected individuals show an IQ disadvantage compared with the rest of the population before they become ill; that a further decline in cognitive function takes place around illness onset; but that the level then remains stable, except in chronically hospitalised individuals in whom there may be a further decline in old age. Reference Palmer, Dawes and Heaton5
Although cognitive impairment implies brain damage or dysfunction, little is known about the relationship between schizophrenic cognitive impairment and the structural and functional brain abnormalities that also characterise the disorder. Early computed tomography (CT) studies did not point consistently to an association with lateral ventricular enlargement. Reference Lewis6 Reviewing magnetic resonance imaging (MRI) studies, Antonova et al Reference Antonova, Sharma, Morris and Kumari7 found some evidence that whole brain, lateral ventricular and frontal and temporal lobe volume reductions were associated with general intellectual impairment and/or specific neuropsychological deficits, although there were conflicting findings in all cases. The findings were further complicated by gender differences in the associations found, and also by the existence of correlations between some volume measures and IQ in controls but not in participants with schizophrenia.
Techniques such as voxel-based morphometry (VBM), which map clusters of significant difference between groups of participants throughout the brain without the necessity of preselecting regions of interest, might have more power to detect small and/or localised volume differences related to cognitive impairment. Such studies have suggested that grey matter volume reductions are more extensive in individuals with chronic schizophrenia than in those with a first-episode, Reference Ellison-Wright, Glahn, Laird, Thelen and Bullmore8,Reference Bora, Fornito, Radua, Walterfang, Seal and Wood9 possibly in keeping with the finding that the former group typically show greater degrees of cognitive impairment than the latter. Reference Heaton, Baade and Johnson10,Reference Saykin, Shtasel, Gur, Stafiniak, Kester and Mozley11 However, to date these techniques have not been used to examine the relationship between brain volume and cognitive impairment directly.
Investigation of the brain functional correlates of cognitive impairment in schizophrenia has been limited. In the first study to carry out functional imaging during performance of an executive task in schizophrenia, Weinberger et al Reference Weinberger, Berman and Zec12 found that the degree of hypofrontality correlated with the impairment the participants showed on the Wisconsin Card Sorting Test. However, such an association was not found in two later studies that used executive Reference Frith, Friston, Herold, Silbersweig, Fletcher and Cahill13 and memory Reference Fletcher, McKenna, Frith, Grasby, Friston and Dolan14 tasks. Two meta-analyses of hypofrontality in schizophrenia have also examined the influence of task performance on prefrontal activation, Reference Hill, Mann, Laws, Stephenson, Nimmo-Smith and McKenna15,Reference Van Snellenberg, Torres and Thornton16 and both found only trend-level correlations.
According to recent findings, schizophrenia is characterised not only by hypofrontality but also hyperfrontality, increased task-related activation in areas of the prefrontal cortex, which has been documented during performance of working memory Reference Glahn, Ragland, Abramoff, Barrett, Laird and Bearden17 and other executive tasks. Reference Minzenberg, Laird, Thelen, Carter and Glahn18 Weinberger and colleagues Reference Tan, Callicott and Weinberger19,Reference Weinberger, Egan, Bertolino, Callicott, Mattay and Lipska20 have explicitly linked this latter finding to cognitive function, arguing that people with schizophrenia have to ‘work harder to keep up’ with task demands and so engage greater and/or more widespread cortical metabolic activity than those without schizophrenia when they try to do so. Nevertheless, a number of studies have compared participants with schizophrenia who are low- and high-performing on working memory tasks and their findings suggest that the relationship between hyperfrontality and cognitive impairment is quite complicated. Reference Callicott, Mattay, Verchinski, Marenco, Egan and Weinberger21-Reference Karlsgodt, Sanz, van Erp, Bearden, Nuechterlein and Cannon23
To date, two studies have adopted a strategy of examining predefined groups of individuals with cognitive impairment. de Vries et al Reference de Vries, Honer, Kemp and McKenna24 found that eight participants with schizophrenia and cognitive impairment amounting to dementia had no more ventricular enlargement or sulcal widening than that seen in schizophrenia as a whole. In contrast, most of the participants showed resting perfusion deficits on single photon emission computed tomography. Wexler et al Reference Wexler, Zhu, Bell, Nicholls, Fulbright and Gore25 found that 54 cognitively impaired people with schizophrenia showed similar degrees of lateral ventricular enlargement and grey matter volume reduction to 21 neuropsychologically near-normal individuals with the disorder. However, the cognitively impaired group had significantly smaller white matter volumes in two out of eight regions examined. This study did not investigate whether there were functional imaging differences between the two groups.
Method
Participants
Two groups of people with schizophrenia participated, one (n = 26) with and one (n = 23) without substantial degrees of cognitive impairment (the cognitively impaired group and cognitively preserved group respectively). Both these groups were recruited from long-stay wards (n = 14), acute and subacute units (n = 26) and out-patients/day hospital (n = 9). They all met DSM-IV 26 criteria for schizophrenia based on interview by two psychiatrists. Individuals were excluded if they were younger than 18 or older than 65, had a history of brain trauma or neurological disease, or had shown alcohol/substance misuse within the 12 months prior to participation. Individuals were also excluded if they had a history of learning disability; this was based on attendance at a special school, or on an interview with relatives, for example if the estimated premorbid IQ measure was found to be low. All participants were taking antipsychotic medication (atypical n = 28, typical n = 7, both kinds n = 14), and all were in a relatively stable clinical condition at the time of testing. The groups were selected to be matched for age, gender and premorbid IQ, as estimated using the Word Accentuation Test (TAP). Reference Del Ser, Gonzalez-Montalvo, Martinez-Espinosa, Delgado-Villapalos and Bermejo27 This is conceptually similar to the National Adult Reading Test (NART) Reference Nelson and Willison28 and requires pronunciation of low-frequency Spanish words whose accents have been removed.
Presence of cognitive impairment was defined on the basis of performance on two well-standardised tests of memory and executive function, the Rivermead Behavioural Memory Test (RBMT) Reference Wilson, Cockburn, Baddeley and Hiorns29 and the Behavioural Assessment of the Dysexecutive Syndrome (BADS). Reference Wilson, Burgess, Emslie and Evans30 The RBMT consists of 12 subtests examining verbal recall, recognition, orientation, remembering a route and three measures of prospective memory, the ability to remember to do things. The BADS contains six subtests covering cognitive estimation, rule shifting, planning, problem-solving and decision-making under multiple task demands. The cognitively preserved group scored above the fifth percentile for normal adults on both tests (screening score of ≥8 on the RBMT and profile score of ≥12 on the BADS). The cognitively impaired group were required to score below the first percentile on either the RBMT (screening score of <7) or the BADS (profile score of <8).
The control group consisted of 39 healthy individuals recruited from the community. They met the same exclusion criteria and were selected to be matched to both the groups with schizophrenia in terms of age, gender and premorbid IQ. Controls were recruited from non-medical staff working in the hospital, their relatives and acquaintances, plus independent sources in the community. They were questioned and excluded if they reported a history of mental illness and/or treatment with psychotropic medication.
All participants were right-handed. They gave written informed consent and the study was approved by the local research ethics committee.
Procedure
All participants underwent structural and functional MRI (fMRI) scanning using the same 1.5 Tesla GE Signa scanner (General Electric Medical Systems, Milwaukee, USA).
Structural imaging
High-resolution structural T 1 MRI data were acquired with the following acquisition parameters: matrix size 512×512; 180 contiguous axial slices; voxel resolution 0.47×0.47×1 mm3; echo time (TE) = 3.93 ms, repetition time (TR) = 2000 ms and inversion time (TI) = 710 ms; flip angle 15°.
Calculation of the total volume of brain tissues (normalised for participant's head size) was performed with SIENAX, part of FSL (FMRIB Software Library, Oxford; www.fmrib.ox.ac.uk/fsl/). Reference Smith31,Reference Smith, Jenkinson, Woolrich, Beckmann, Behrens and Johansen-Berg32 This tool additionally generates separate measures of grey and white matter volume. We compared lateral ventricle volume (also normalised for participant's head size) between groups using FreeSurfer (http://surfer.nmr.mgh.harvard.edu/fswiki), for which interrater reliability with manual segmentation has been shown. Reference Fischl and Dale33
Structural data were further analysed with FSL-VBM, an optimised voxel-based morphometry style analysis Reference Ashburner and Friston34,Reference Good, Johnsrude, Ashburner, Henson, Friston and Frackowiak35 carried out with FSL tools, which yields a measure of differences in local grey matter volume. First, structural images were brain-extracted. Next, tissue-type segmentation was carried out. The resulting grey matter partial volume images were then aligned to Montreal Neurologic Institute (MNI)152 standard space, followed by non-linear registration. The resulting images were averaged to create a study-specific template, to which the native grey matter images were then non-linearly re-registered. The registered partial volume images were then modulated by dividing by the Jacobian of the warp field. The modulated segmentated images were then smoothed with an isotropic Gaussian kernel with a sigma of 4 mm (for technical details see www.fmrib.ox.ac.uk/fsl/fslvbm/). Group comparisons were carried out with permutation-based non-parametric tests. These were made with the randomise function implemented in FSL, using the recently developed threshold-free cluster-enhancement method with 10 000 iterations, for proper statistical inference of spatially distributed patterns (corrected for multiple comparisons).
We also carried out a VBM analysis of white matter volume. Since the VBM analysis in FSL has only been validated for grey matter, we used VBM5 (http://dbm.neuro.uni-jena.de/vbm/vbm5-for-spm5/), performed with SPM5 tools for this analysis. The following standard pre-processing steps were carried out: tissue-type segmentation; normalisation (warping) to standard space of the obtained white matter images; and modulation. The resulting images were then smoothed with an isotropic Gaussian kernel with a sigma of 4 mm. Statistical analyses were carried out using the general linear model (GLM) with correction for multiple comparisons using the theory of Gaussian random fields.
fMRI
The paradigm used has been described by Pomarol-Clotet et al. Reference Pomarol-Clotet, Salvador, Sarro, Gomar, Vila and Martínez36 Scanning was carried out while participants performed a sequential-letter version of the n-back task. Reference Gevins and Cutillo37 Two levels of memory load (1-back and 2-back) were presented in a blocked design manner. Each block consisted of 24 letters that were shown every 2 s (1 s on, 1 s off) and all blocks contained 5 repetitions (1-back and 2-back depending on the block) located randomly within block. Participants had to indicate repetitions by pressing a button. Four 1-back and four 2-back blocks were presented in an interleaved way, and between these a baseline stimulus (an asterisk flashing with the same frequency as the letters) was presented for 16 s. In order to identify which task had to be performed, characters were shown in green in 1-back blocks and in red in the 2-back blocks. All participants first went through a training session outside the scanner.
Performance was measured using the signal detection theory index of sensitivity (d′). Reference Green and Swets38 Any participants who had negative d′ values in either or both of the 1-back and 2-back versions of the task, which suggests that they were not performing it, were excluded from the study.
In each individual scanning session 266 volumes were acquired. A gradient echo-planar imaging (EPI) sequence depicting the blood oxygen level-dependent (BOLD) contrast was used. Each volume contained 16 axial planes acquired with the following parameters: TR = 2000 ms, TE = 20 ms, flip angle 70°, section thickness 7 mm, section skip 0.7 mm, in-plane resolution 3×3 mm2. The first ten volumes were discarded to avoid T 1 saturation effects.
Functional MRI analyses were performed with the FEAT module included in FSL software. Reference Smith, Jenkinson, Woolrich, Beckmann, Behrens and Johansen-Berg32 At a first level, images were corrected for movement and coregistered to a common stereotaxic space (MNI template), and spatially filtered with a Gaussian filter (smoothing of full width at half maximum (FWHM) 5.0 mm). To minimise unwanted movement-related effects, individuals with an
Table 1 Demographic, neurocognitive and psychopathological characteristics of the participants with schizophrenia and controls

| Participants with schizophrenia (n = 49) | Group statistics | |||||||||||
|---|---|---|---|---|---|---|---|---|---|---|---|---|
| Control group (n = 39) | Cognitively preserved group (n = 23) | Cognitively impaired group (n = 26) | I < C | I < P | ||||||||
| t | P | t | P | F | χ2 | t | U | P | ||||
| Age, years: mean (s.d.) | 40.10 (11.58) | 40.10 (10.22) | 42.38 (8.23) | 0.45 | 0.64 | |||||||
| Gender, male/female: n | 30/9 | 17/6 | 20/6 | 0.85 | 0.96 | |||||||
| TAP correct words, mean (s.d.) | 23.00 (5.29) | 23.68 (4.34) | 21.00 (5.65) | 1.83 | 0.17 | |||||||
| IQ (WAIS-III), mean (s.d.) | ||||||||||||
| Full-scale IQ | 103.49 (13.13) | 100.43 (13.04) | 92.73 (13.43) | 3.21 | 0.002 | 2.03 | 0.05 | 5.26 | 0.01 | |||
| Verbal IQ | 104.90 (16.73) | 104.00 (17.65) | 96.85 (15.93) | 1.97 | 0.15 | |||||||
| Performance IQ | 100.08 (17.59) | 94.00 (14.61) | 84.54 (16.56) | 3.57 | 0.001 | 2.11 | 0.04 | 6.87 | 0.002 | |||
| BADS score, mean (s.d.) | 16.04 (2.40) | 10.69 (4.33) | 5.43 | < 0.001 | ||||||||
| RBMT screening score, mean (s.d.) | 9.48 (1.44) | 5.17 (1.63) | 9.58 | < 0.001 | ||||||||
| Years of illness, mean (s.d.) | 18.28 (10.02) | 23.76 (8.29) | –2.09 | 0.04 | ||||||||
| PANSS total score, mean (s.d.) | 66.57 (17.11) | 76.15 (15.03) | –2.09 | 0.04 | ||||||||
| CGI score, mean (s.d.) | 4.13 (1.36) | 4.58 (0.90) | 232.00 | 0.16 | ||||||||
| Antipsychotic dosage (chlorpromazine equivalent, mg), mean (s.d.) | 663.41 (550.94) | 985.34 (608.59) | –1.93 | 0.06 | ||||||||
I < C, cognitively impaired group < control group; I < P, cognitively impaired group < cognitively preserved group; TAP, Word Accentuation Test; WAIS-III, Wechsler Adult Intelligence Scale (3rd edn);39 BADS, Behavioural Assessment of the Dysexecutive Syndrome; RBMT, Rivermead Behavioural Memory Test; PANSS, Positive and Negative Syndrome Scale; CGI, Clinical Global Impression.
estimated maximum absolute movement over 3.0 mm, or an average absolute movement higher than 0.3 mm were discarded from the study. Finally, group comparisons were performed using the same FEAT module, by means of mixed-effects GLM models. A z-threshold of 2.3 (the default in FSL) was used to generate the initial set of clusters. To properly account for the spatially distributed patterns, FEAT uses the Gaussian random field theory when performing statistical tests.
Data analysis
The main focus in the structural and functional brain analyses was on two specific comparisons. First, we contrasted the cognitively preserved group with the control group. This was in order to determine changes in brain structure and function attributable to schizophrenia, without the complicating factor of cognitive impairment. Second, in order to assess the possible contribution of cognitive impairment itself, we contrasted the cognitively preserved and cognitively impaired groups. All statistical tests in the VBM and fMRI analyses were performed with a statistical threshold of P<0.05, corrected for multiple comparisons.
Results
Sample characteristics
There were no differences between the three groups in age, gender and TAP-estimated premorbid IQ (Table 1). The two groups with schizophrenia did not differ in overall severity of illness as measured by the Clinical Global Impression (CGI); Reference Guy40 however, the cognitively impaired group had significantly higher total symptom scores on the Positive and Negative Syndrome Scale (PANSS). Reference Kay, Fiszbein and Opler41 They also had a significantly longer duration of illness than the cognitively preserved group and showed trend level higher mean dosages of antipsychotic drugs.
As expected, the two groups with schizophrenia differed significantly in their performance on the BADS and RBMT. The distributions of their scores are shown in Fig. 1. The
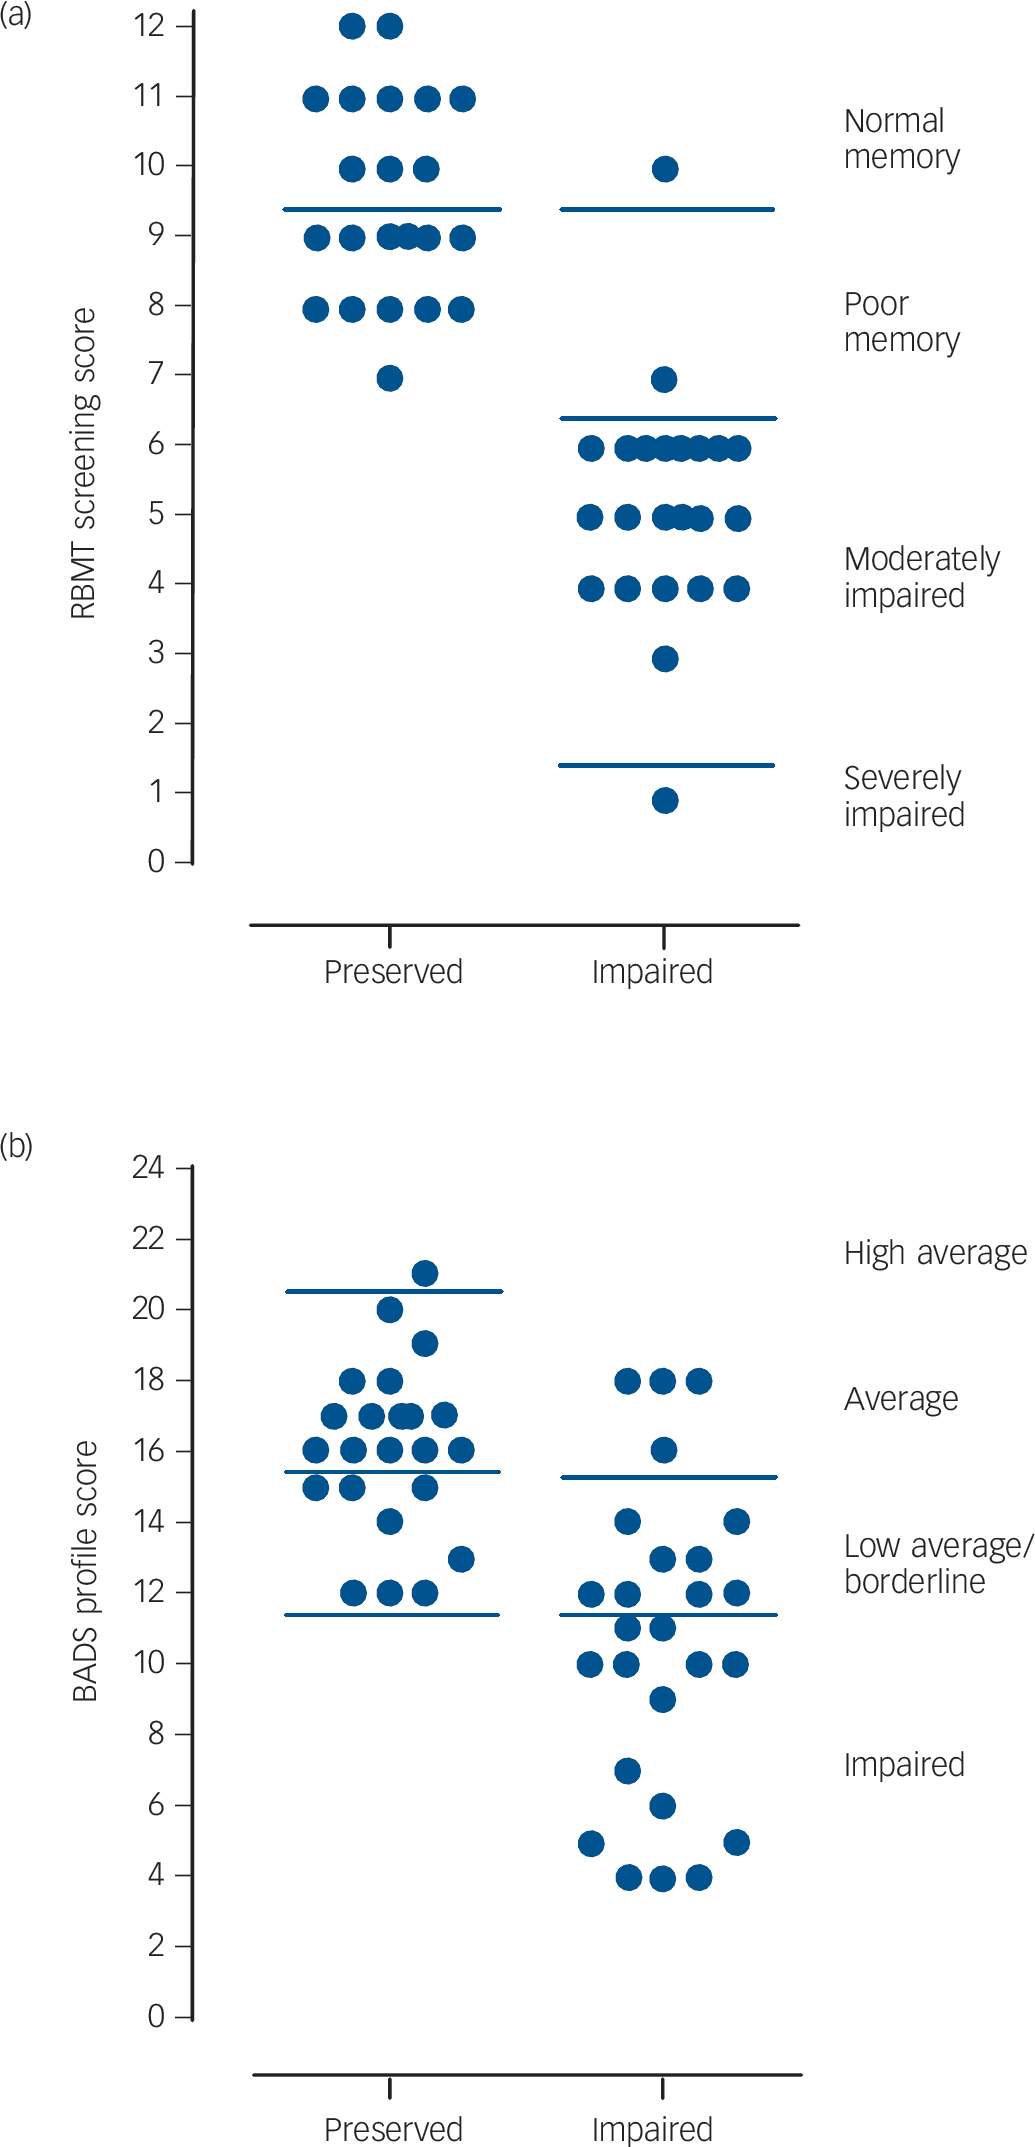
Fig 1 Scatter plots of the cognitively preserved and cognitively impaired groups' scores on the (a) Rivermead Behavioural Memory Test (RBMT) and (b) the Behavioural Assessment of the Dysexecutive Syndrome (BADS).
cognitively impaired group also had lower scores on current IQ than the cognitively preserved group, but this only reached significance for performance IQ.
Brain and lateral ventricular volume measures
All participants were included in the analysis except in the comparison of lateral ventricles, where one control had to be excluded for technical reasons. Comparing all participants with schizophrenia with the controls, they showed reduced whole brain volume (1526.75 cm3 (s.d. = 47.69) v. 1485.91 cm3 (s.d. = 53.36), t = 3.74, P<0.001, effect size (ES) = 0.80), reduced grey matter volume (819.46 cm3 (s.d. = 35.39) v. 785.75 cm3 (s.d. = 39.09), t = 4.19, P<0.001, ES = 0.89) and lateral ventricular enlargement (12.58 cm3 (s.d. = 7.24) v. 16.74 cm3 (s.d. = 10.47), t = –2.20, P = 0.03, ES = –0.45). However, there was no difference in white matter volume between participants with schizophrenia and controls (707.29 cm3 (s.d. = 25.62) v. 700.17 cm3 (s.d. = 24.71), t = 1.32, P = 0.19, ES = 0.28). As shown in Table 2, when the controls were compared with the cognitively preserved group the differences in whole brain and grey matter volume differences remained evident (whole brain: t = 2.62, P = 0.01, ES = 0.68; grey matter: t = 2.83, P = 0.006, ES = 0.73), although that for lateral ventricular volume no longer reached significance (t = –1.25, P = 0.22, ES = –0.35). However, the differences between the cognitively preserved and cognitively impaired groups were small and non-significant on all these measures (whole brain: t = 0.36, P = 0.72, ES = 0.10; grey matter: t = 0.62, P = 0.53, ES = 0.18; lateral ventricular volume: t = –0.92, P = 0.36, ES = –0.14).
VBM
The same participants took part in this analysis, i.e. all those in the cognitively preserved group (n = 23) and cognitively impaired group (n = 26) and the 39 controls.
Controls v. cognitively preserved group
The cognitively preserved group showed significantly smaller grey matter volume than the controls in one cluster. This was situated anteriorly and medially, extending from the orbital and medial prefrontal cortex to the anterior cingulate gyrus (2190 voxels, P = 0.04; peak in Brodmann Area (BA) 10, MNI (–12, 44, –8), z-score = 4.70). This is shown in Fig. 2 (the appearance of separate clusters is artefactual, due to the 3D rendering). There were no regions where the cognitively preserved group showed significantly greater volume than the controls.
No areas of significant white matter volume difference were found between the controls and the cognitively preserved group.
Cognitively preserved group v. cognitively impaired group
There were no areas of significant grey or white matter volume difference between these two groups.
fMRI
Some participants could not tolerate the fMRI procedure and in others the images were not usable because of excessive movement. Therefore, 19 participants who were cognitively impaired, 18 who were cognitively preserved and 34 controls took part in this analysis. As shown in Table 3, the groups remained matched for age, gender and TAP score. Significant differences between the two groups with schizophrenia remained evident on the BADS and the RBMT. These two groups did not differ in CGI or PANSS score, or in antipsychotic dosage. There were no significant differences between the participants with schizophrenia who took part in this part of the study and those who did not in terms of age (41.07 v. 42.05), gender (29/8 v. 8/4) or TAP score (22.03 v. 22.83).
Behavioural performance
The cognitively preserved group were significantly impaired compared with the controls on the 1-back version of the task (mean d′ 3.77 (s.d. = 0.91) v. 4.40 (s.d. = 0.65), t = 2.90, P = 0.01) and in the 2-back version (mean d′ 2.67 (s.d. = 0.87) v. 3.27 (s.d. = 0.96), t = 2.22, P = 0.03). The cognitively impaired group were marginally significantly impaired compared with the cognitively preserved group on the 1-back task (mean d′ 3.07 (s.d. = 1.16) v. 3.77 (s.d. = 0.91), t = 2.03, P = 0.05) and significantly impaired on the 2-back task (mean d′ 1.89 (s.d. = 0.68) v. 2.67 (s.d. = 0.87), t = 3.06, P = 0.004).
Table 2 Whole brain and lateral ventricular volume measures in the controls, cognitively preserved and cognitively impaired groups with schizophrenia

| Controls (n = 39) | Cognitively preserved group (n = 23) | Cognitively impaired group (n = 26) | ANOVA | ||||||||
|---|---|---|---|---|---|---|---|---|---|---|---|
| P < C | I < C | I > C | |||||||||
| t | P | t | P | t | P | F | P | ||||
| Whole brain | 1526.75 (47.69) | 1488.82 (65.92) | 1483.35 (40.36) | 2.62 | 0.01 | 3.82 | <0.001 | 6.98 | 0.002 | ||
| Grey matter | 819.46 (35.39) | 789.55 (47.52) | 782.38 (30.36) | 2.83 | 0.006 | 4.37 | <0.001 | 8.94 | < 0.001 | ||
| White matter | 707.29 (25.62) | 699.27 (29.79) | 700.96 (19.74) | 0.89 | 0.41 | ||||||
| Lateral ventriclesa | 12.58 (7.24) | 15.95 (12.49) | 17.44 (8.49) | –2.59 | 0.01 | 2.95 | 0.06 | ||||
P < C, cognitively preserved group < control group; I < C, cognitively impaired group < control group; I > C, cognitively impaired group > control group.
a Data in this analysis were corrected for intracranial volume; results were similar without correction. One control was excluded from the analysis.
Controls v. cognitively preserved group
No areas of significant difference in activation were seen in the 1-back v. baseline contrast or in the 2-back v. 1-back contrast. In the 2-back v. baseline contrast the controls activated more than the cognitively preserved group in the right cerebellum (1606 voxels, P = 8.27×10⁻⁵, MNI (12, −58, −24), z-score 4.48).
Additionally, in the 2-back v. baseline contrast, the cognitively preserved group showed two clusters where they failed to de-activate significantly relative to the control group. The larger of these included parts of the medial and inferior orbital prefrontal cortex, extending to the anterior cingulate cortex (3878 voxels, P = 1.72×10⁻⁹, peak activation in BA11, MNI (0, 26,-14), z-score 4.52). The smaller cluster was located in the right insula and in the right superior temporal gyrus (629 voxels, P = 0.04, peak activation in BA48, MNI (42, −8, −6), z-score 4.13).
This failure of de-activation was more evident in the 2-back v. 1-back contrast. Here, a large cluster was seen that included the
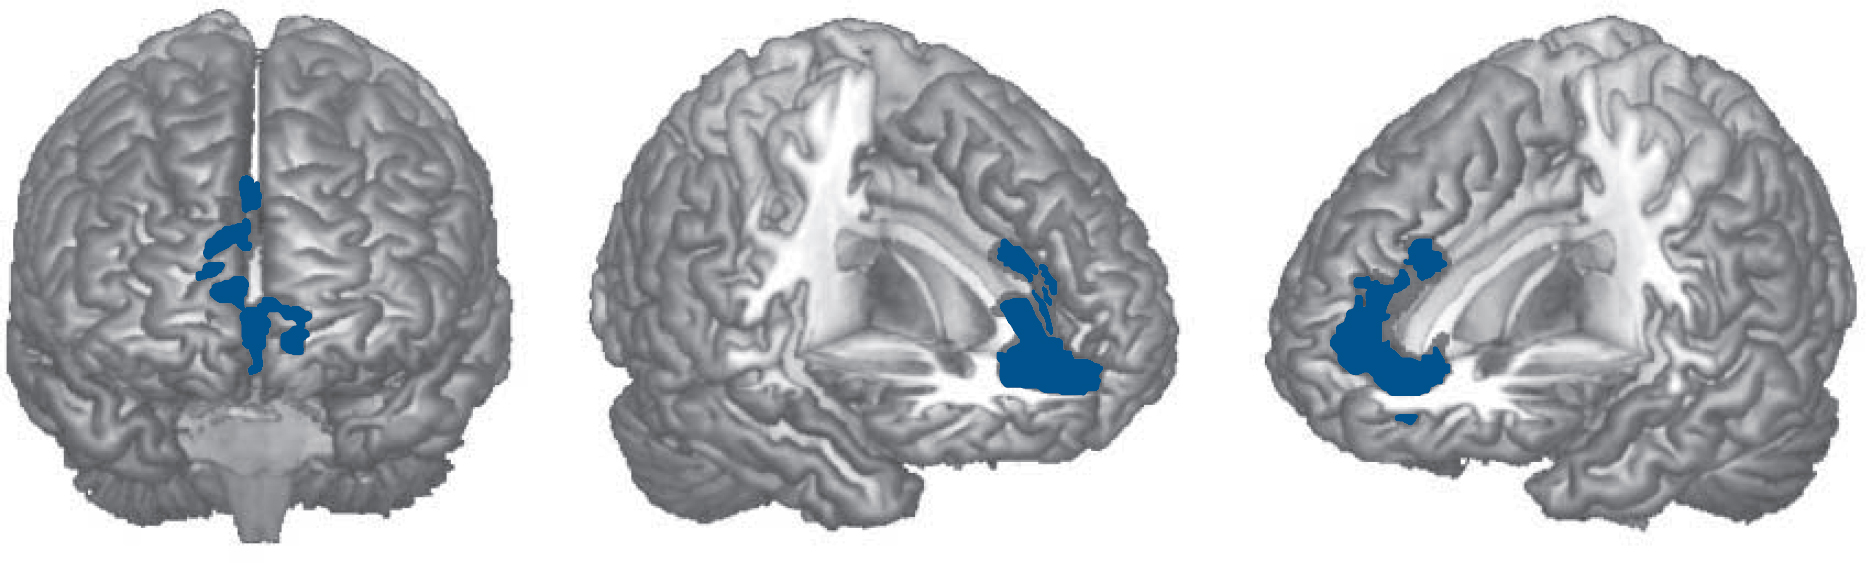
Fig. 2 Brain regions showing significant grey matter volume reduction in the cognitively preserved group with schizophrenia compared with healthy controls.
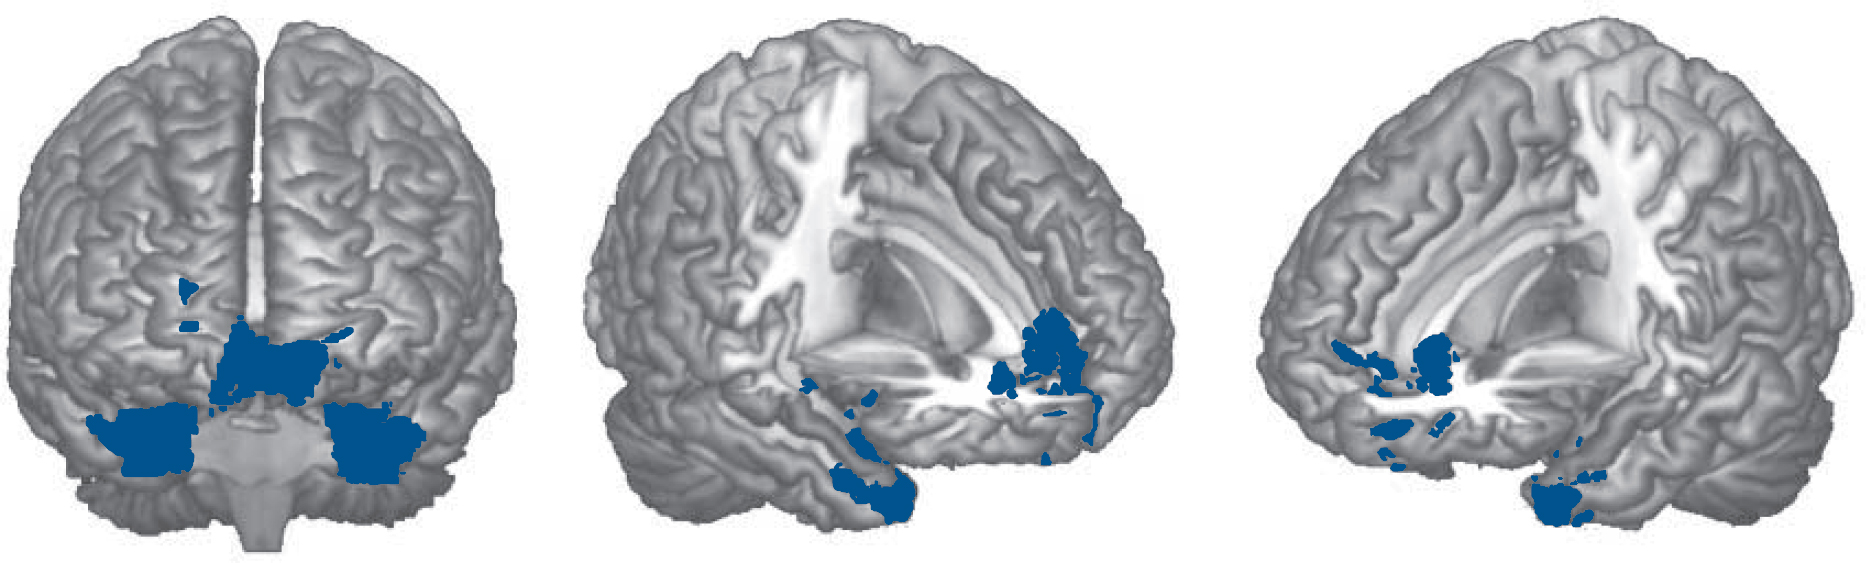
Fig. 3 Brain regions where the cognitively preserved group with schizophrenia showed significant failure to de-activate compared with the controls in the 2-back v. 1-back contrast.
medial and inferior orbital prefrontal cortex, the left basal ganglia and anterior regions of the left temporal cortex (5748 voxels, P = 8.66×10⁻¹³, peak activation in BA38, MNI (–40, 18, –34), z-score 4.49). Another cluster affected parts of the right basal ganglia and anterior temporal cortex (2235 voxels, P = 2.56×10⁻⁶; peak activation in BA35, MNI (26, 2, −34), z-score 4.56) (Fig. 3).
Cognitively preserved group v. cognitively impaired group
There were no differences between the groups in the 1-back v. baseline contrast. The 2-back v. baseline contrast revealed significantly reduced activation in the cognitively impaired group in an area that included the right dorsolateral prefrontal cortex, the inferior lateral frontal lobe and the right insula (1749 voxels, P = 2.94×10⁻⁵, peak activation in right frontal inferior pars triangularis, MNI (38, 28, 26), z-score 3.93). This area of reduced
Table 3 Mean values, standard deviations and statistical results of demographic, neurocognitive and psychopathological characteristics of the functional magnetic resonance imaging sample

| Participants with schizophrenia (n = 37) | Group statistics | |||||||||||
|---|---|---|---|---|---|---|---|---|---|---|---|---|
| Control group (n = 34) | Cognitively preserved group (n = 18) | Cognitively impaired group (n = 19) | I < C | I < P | ||||||||
| t | P | t | P | F | χ2 | t | U | P | ||||
| Age, years: mean (s.d.) | 40.90 (11.80) | 40.49 (10.58) | 41.62 (7.94) | 0.06 | 0.95 | |||||||
| Gender, male/female: n | 26/8 | 14/4 | 15/4 | 0.04 | 0.98 | |||||||
| TAP correct words, mean (s.d.) | 23.00 (5.42) | 23.41 (4.02) | 20.79 (5.08) | 1.55 | 0.25 | |||||||
| IQ (WAIS-III), mean (s.d.) | ||||||||||||
| Full-scale IQ | 104.24 (12.47) | 100.44 (13.99) | 94.11 (9.37) | 3.08 | 0.003 | 4.24 | 0.02 | |||||
| Verbal IQ | 105.44 (16.06) | 103.06 (19.07) | 96.58 (10.86) | 1.95 | 0.15 | |||||||
| Performance IQ | 100.85 (18.19) | 94.67 (15.68) | 86.74 (17.08) | 2.77 | 0.01 | 4.09 | 0.02 | |||||
| BADS score, mean (s.d.) | 16.06 (2.69) | 11.58 (4.26) | 3.80 | 0.001 | ||||||||
| RBMT screening score, mean (s.d.) | 9.72 (1.36) | 5.56 (1.46) | 8.84 | 0.001 | ||||||||
| Years of illness, mean (s.d.) | 18.44 (10.86) | 22.71 (7.71) | –1.39 | 0.18 | ||||||||
| PANSS total score, mean (s.d.) | 67.89 (18.33) | 76.79 (17.04) | –1.53 | 0.14 | ||||||||
| CGI score, mean (s.d.) | 4.28 (1.41) | 4.58 (1.02) | 146.50 | 0.44 | ||||||||
| Antipsychotic dosage (chlorpromazine equivalent, mg), mean (s.d.) | 688.22 (603.25) | 913.50 (507.21) | –1.23 | 0.23 | ||||||||
I < C, cognitively impaired group < control group; I < P, cognitively impaired group < cognitively preserved group; TAP, Word Accentuation Test; WAIS-III, Wechsler Adult Intelligence Scale (3rd edn); BADS, Behavioural Assessment of the Dysexecutive Syndrome; RBMT, Rivermead Behavioural Memory Test; PANSS, Positive and Negative Syndrome Scale; CGI, Clinical Global Impression.
activation was more pronounced in the 2-back v. 1-back contrast: on the right, one cluster included the dorsolateral prefrontal cortex extending to the precentral gyrus posteriorly and the superior middle frontal cortex anteriorly (2494 voxels, P = 1.19×10⁻⁷, peak activation in BA42, MNI (12, 24, 46), z-score 3.88). A similar cluster on the left included the dorsolateral prefrontal cortex and extended to the basal ganglia, the insula and the precentral gyrus (1786 voxels, P = 96×10–6; peak activation in BA6, MNI (–30, 6, 24), z-score 4.27). Two more clusters were located in regions of the right parietal and occipital lobes (1962 voxels, P = 2.09×10⁻⁶, peak activation in BA40, MNI (38, –46, 50), z-score 4.25) and in roughly similar regions on the left (1785 voxels, P = 6.02×10⁻⁶, peak activation in BA7, MNI (–32, –64, 48), z-score 3.91). Two further small clusters were found in both thalami (608 voxels, P = 0.02, peak activation in the right thalamus, MNI (6, –8, 19), z-score 2.9) and in the left inferior and middle occipital gyri (603 voxels, P = 0.03, peak activation in BA19, MNI (–52, –76, –2), z-score 4.04). The findings are shown in Fig. 4.
There were no areas where the cognitively impaired group activated more than the cognitively preserved group.
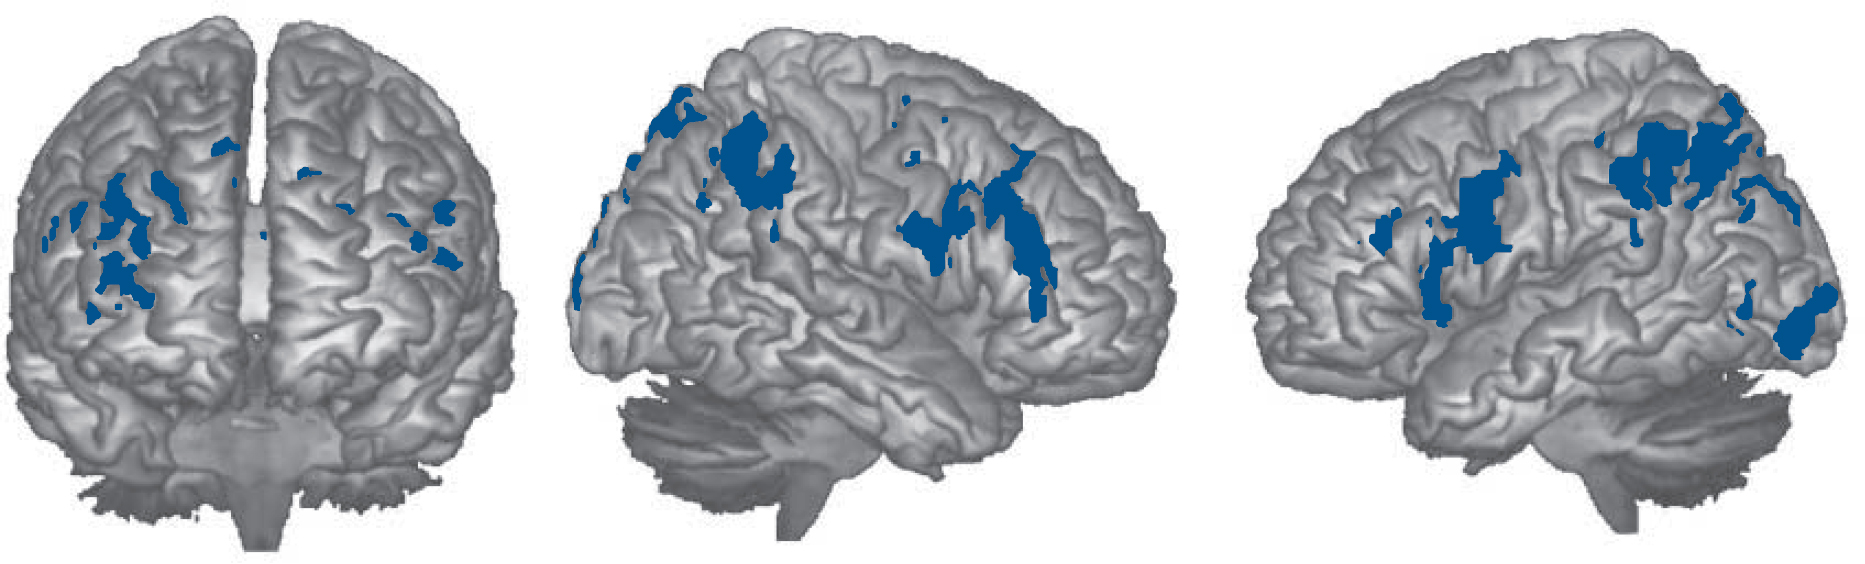
Fig. 4 Brain regions where the cognitively preserved group activated significantly more than the cognitively impaired group in the 2-back v. 1-back contrast.
Discussion
Structural imaging findings
As a group, the participants with schizophrenia in this study showed typical structural imaging findings associated with the disorder, namely reduced brain volume, reduced grey matter volume and lateral ventricular enlargement. However, the cognitively preserved and cognitively impaired groups did not differ from each other on these measures. When VBM was used to examine grey and white matter volume further, a cluster of grey matter volume reduction was seen in the cognitively preserved group in the medial and orbital prefrontal cortex, overlapping with areas identified in recent meta-analyses. Reference Bora, Fornito, Radua, Walterfang, Seal and Wood9,Reference Fornito, Yucel, Patti, Wood and Pantelis42 Once again, no clusters of significant grey or white matter volume difference emerged between the cognitively preserved and cognitively impaired groups.
Although counterintuitive, these findings are consistent with the rest of the structural imaging literature, which has documented only weak and conflicting evidence of an association between cognitive impairment and lateral ventricular size, whole brain volume and regional cortical volumes in schizophrenia. Reference Lewis6,Reference Antonova, Sharma, Morris and Kumari7 The recent study of Wexler et al, Reference Wexler, Zhu, Bell, Nicholls, Fulbright and Gore25 the only other study besides ours to explicitly compare groups of cognitively preserved and impaired individuals with schizophrenia, also failed to find significant differences in lateral ventricular volume and grey matter volume between them. Wexler et al Reference Wexler, Zhu, Bell, Nicholls, Fulbright and Gore25 did find that cognitively impaired individuals showed significantly smaller white matter volume in two out of eight regions examined (sensorimotor and parietal-occipital cortex). However, these differences may not have been robust since there was no control for multiple comparisons.
Our structural imaging findings are also in keeping with a well-established neuropathological finding in schizophrenia. This is that, although severe cognitive impairment is prevalent among elderly people who are institutionalised - more than 70% have Mini-Mental State Examination (MMSE) scores in the demented range Reference Harvey, Lombardi, Kincaid, Parrella, White and Powchik43 - post-mortem studies have revealed no more Alzheimer-type or other brain pathology in such individuals than in age-matched controls. Reference Harrison3
Nevertheless, our study does not completely exclude the possibility of small structural differences related to cognitive function. This is because in the conventional MRI analysis there were differences in whole brain volume and grey matter volume between the cognitively impaired and cognitively preserved groups of 0.4% and 0.9% respectively. Although these differences were small and non-significant, the reductions of brain volume in schizophrenia as a whole are also small, being of the order of 2% (whole brain) and 4% (grey matter) according to the meta-analysis of Wright et al. Reference Wright, Rabe-Hesketh, Woodruff, David, Murray and Bullmore44 It could therefore be argued that our study was simply underpowered to detect differences between the two groups with schizophrenia. However, it should be noted that two groups of 769 participants would be required to make the differences we found in whole brain volume between cognitively impaired and cognitive preserved groups significant, and 239 for each group would be needed to do so for the differences in grey matter volume.
A final objection to our finding of no relationship between cognitive impairment and brain volume reduction is conceptual. If, as is widely accepted, Reference Weinberger, Marenco, Hirsch and Weinberger45 structural brain abnormality in schizophrenia is neurodevelopmental in origin, then it might not be expected to show the same relationship with cognitive impairment as brain changes that are the result of brain injury or degenerative disease. When the evidence that additional brain volume reductions also take place after illness onset Reference Hulshoff Pol and Kahn46 is also taken into account, plus the fact that cognitive impairment itself follows a complex pre-, peri- and postmorbid course, Reference Palmer, Dawes and Heaton5 there is scope for a further argument, that the relationship between brain structure and cognitive impairment in schizophrenia cannot be adequately assessed in a simple cross-sectional study such as ours.
Functional imaging findings
In contrast to the brain structural findings, we found clear evidence of differences between the cognitively impaired and cognitively preserved groups on functional imaging. Specifically, in the 2-back v. baseline contrast the cognitively impaired group showed reduced activation compared with the cognitively preserved group in the right dorsolateral prefrontal cortex and other frontal areas, changes which became bilateral and extended more widely in the 2-back v. 1-back contrast. In fact, most of the task-related hypoactivation we found appeared to be attributable to cognitive impairment - in the comparison between the cognitively preserved group and the controls the cognitively preserved group showed reduced activation only in the cerebellum.
This result deviates somewhat from the rest of the literature which, as noted in the introduction, has not found evidence of a robust correlation between hypofrontality and task performance. Reference Hill, Mann, Laws, Stephenson, Nimmo-Smith and McKenna15,Reference Van Snellenberg, Torres and Thornton16 One possible reason for our stronger findings here is that, rather than using correlational methods, we prospectively compared groups that differed in cognitive function but which were matched for other factors that might affect task performance, especially premorbid intellectual function. The fact that the two groups were also well-separated in terms of memory and/or executive performance (i.e. one was above the fifth percentile and the other was below the first percentile) would also have tended to increase functional imaging differences between them related to this factor.
It does not seem likely that the differences we found between the cognitively impaired and cognitively preserved groups were the result of the former simply not performing the task, since we excluded a priori any participants who showed negative d′ scores, an indicator of failure to perform the task. At the same time, the difference in level of n-back performance between the two groups with schizophrenia has the potential to complicate the interpretation of any functional imaging differences found between them. This possibility could not be investigated in our study because the groups were preselected on the basis that they differed in cognitive function and the n-back task is itself a cognitive task. Therefore, entering n-back performance as a covariate in the analysis would have violated the principle that the covariate should not be affected by the group factor.
In fact, this issue is part of a wider debate about what drives task-related hypofrontality in schizophrenia: are both poor task performance and reduced brain activation manifestations of an underlying intrinsic cortical dysfunction? Or does the reduced activation merely index the fact that cognitively impaired individuals perform the task more poorly and so activate their frontal lobes to a correspondingly lesser extent (see Fletcher et al Reference Fletcher, McKenna, Frith, Grasby, Friston and Dolan14 )? This debate has now to some extent been superseded by the finding that schizophrenia is characterised not only by hypofrontality, but also by hyperfrontality during task performance. Reference Glahn, Ragland, Abramoff, Barrett, Laird and Bearden17,Reference Minzenberg, Laird, Thelen, Carter and Glahn18 Nevertheless, cognitive impairment continues to play a central role in explanations of this latter functional imaging abnormality. Thus, according to Weinberger et al, Reference Tan, Callicott and Weinberger19,Reference Weinberger, Egan, Bertolino, Callicott, Mattay and Lipska20 people with schizophrenia have reduced efficiency of prefrontal cortical processing. This causes them to show more activation than healthy individuals - i.e. hyperfrontality - at low task demands, as they ‘work harder to keep up’. As task demands increase, they then reach their limit of performance sooner than healthy participants, and thereafter show a fall-off of activation, or hypofrontality. We did not find any evidence of hyperfrontality in our study, suggesting that this abnormality may not be related to cognitive function in the way predicted by Weinberger and colleagues, Reference Tan, Callicott and Weinberger19,Reference Callicott, Mattay, Verchinski, Marenco, Egan and Weinberger21 a conclusion also reached by Karlsgodt et al. Reference Karlsgodt, Sanz, van Erp, Bearden, Nuechterlein and Cannon23 However, it should be noted that we did not fully examine this question, since the theory predicts that hyperfrontality should be seen at low task difficulty in the comparison between controls and individuals who are cognitively impaired, and we did not compare these two groups directly.
In addition to reduced activation related to cognitive function, we also found failure of de-activation. This affected the medial frontal cortex among other areas and, since it was only seen in the comparison between the controls and the cognitively preserved group, it was unrelated to the presence of cognitive impairment. Failure of task-related de-activation in the medial frontal cortex in schizophrenia has now been documented several times, Reference Pomarol-Clotet, Salvador, Sarro, Gomar, Vila and Martínez36,Reference Whitfield-Gabrieli, Thermenos, Milanovic, Milanovic, Tsuang and Faraone47,Reference Salgado-Pineda, Fakra, Delaveau, McKenna, Pomarol-Clotet and Blin48 where it has been interpreted as evidence of dysfunction in the default mode network - one of the two prominent midline nodes of which is located in the medial frontal cortex. The default mode network is currently a focus of considerable research interest in schizophrenia, with studies finding evidence of both changes in task-related de-activation and abnormal connectivity at rest (for a review see Broyd et al Reference Broyd, Demanuele, Debener, Helps, James and Sonuga-Barke49 ). Among other things, it has been suggested that failure of de-activation in the network might account for the cognitive impairment associated with the schizophrenia. Reference Pomarol-Clotet, Salvador, Sarro, Gomar, Vila and Martínez36,Reference Whitfield-Gabrieli, Thermenos, Milanovic, Milanovic, Tsuang and Faraone47 Our findings suggest that this is not the case.
Also interesting in this respect was the overlap between the structural and functional abnormalities that was evident in our study: in the VBM comparison between the controls and the cognitively preserved group, volume reductions were clustered in a medial frontal cortex region where failure of de-activation was also seen. We have previously examined this overlap in more detail, Reference Pomarol-Clotet, Canales-Rodriguez, Salvador, Sarró, Gomar and Vila50 and two other studies have had comparable findings. Camchong et al Reference Camchong, Macdonald, Bell, Mueller and Lim51 found functional connectivity abnormality in the anterior node of the default mode network, plus white matter changes in subjacent regions on diffusion tensor imaging, and Salgado-Pineda et al Reference Salgado-Pineda, Fakra, Delaveau, McKenna, Pomarol-Clotet and Blin48 found failure of both de-activation and volume reductions in regions extending along the length of the cingulate gyrus.
Conclusions and limitations
This study provides evidence that structural brain abnormality in schizophrenia is a function of having the disorder, not the cognitive impairment that goes with it. In contrast, a substantial part of the functional imaging abnormality associated with schizophrenia appears to reflect cognitive impairment. Limitations of the study include the relatively small sizes of the groups with and without cognitive impairment. Also, since the cognitively preserved group was defined in terms of memory and executive function above fifth percentile cut-offs, it was not completely free of cognitive impairment; some fell into the poor normal memory range on the RBMT and the low average/borderline categories in the BADS. As discussed above, the inferences that can be drawn from positive findings in an fMRI comparison between cognitively preserved and cognitively impaired individuals are inevitably limited by the differences in performance between them on the task used. In general terms, more detailed knowledge about the trajectories of structural and functional brain change in schizophrenia might be needed before firm conclusions can be drawn about their relationship with cognitive impairment in the disorder.
Funding
Supported by the Instituto de Salud Carlos III, Centro de Investigación en Red de Salud Mental, CIBERSAM and Marie Curie European Reintegration Grant () given to E.P.-C. Four grants from the Spanish Ministry of Health - Instituto de Salud Carlos III: provided to E.P.-C.; , given to R.S.; given to J.G.; given to B.S-S.; given to J.O.-G.


eLetters
No eLetters have been published for this article.