- Research
- Open access
- Published:
Severely malnourished children with a low weight-for-height have a higher mortality than those with a low mid-upper-arm-circumference: I. Empirical data demonstrates Simpson’s paradox
Nutrition Journal volume 17, Article number: 79 (2018)
Abstract
Background
According to WHO childhood severe acute malnutrition (SAM) is diagnosed when the weight-for-height Z-score (WHZ) is <−3Z of the WHO2006 standards, the mid-upper-arm circumference (MUAC) is < 115 mm, there is nutritional oedema or any combination of these parameters. Recently there has been a move to eliminate WHZ as a diagnostic criterion on the assertion that children meeting the WHZ criterion are healthy, that MUAC is universally a superior prognostic indicator of mortality and that adding WHZ to the assessment does not improve the prediction; these assertions have lead to a controversy concerning the role of WHZ in the diagnosis of SAM.
Methods
We examined the mortality experience of 76,887 6–60 month old severely malnourished children admitted for treatment to in-patient, out-patient or supplementary feeding facilities in 18 African countries, of whom 3588 died. They were divided into 7 different diagnostic categories for analysis of mortality rates by comparison of case fatality rates, relative risk of death and meta-analysis of the difference between children admitted using MUAC and WHZ criteria.
Results
The mortality rate was higher in those children fulfilling the WHO2006 WHZ criterion than the MUAC criterion. This was the case for younger as well as older children and in all regions except for marasmic children in East Africa. Those fulfilling both criteria had a higher mortality. Nutritional oedema increased the risk of death. Having oedema and a low WHZ dramatically increased the mortality rate whereas addition of the MUAC criterion to either oedema-alone or oedema plus a low WHZ did not further increase the mortality rate. The data were subject to extreme confounding giving Simpson’s paradox, which reversed the apparent mortality rates when children fulfilling both WHZ and MUAC criteria were included in the estimation of the risk of death of those fulfilling either the WHZ or MUAC criteria alone.
Conclusions
Children with a low WHZ, but a MUAC above the SAM cut-off point are at high risk of death. Simpson’s paradox due to confounding from oedema and mathematical coupling may make previous statistical analyses which failed to distinguish the diagnostic groups an unreliable guide to policy. WHZ needs to be retained as an independent criterion for diagnosis of SAM and methods found to identify those children with a low WHZ, but not a low MUAC, in the community.
Background
About 19 million children are estimated to have severe wasting, of whom about half to one million die each year [1]. These estimates were made from prevalence data using weight-for-height (WHZ) as the single criterion. As the deaths related to a low mid-upper-arm-circumference (MUAC) or nutritional oedema (kwashiorkor) were not included in these estimates the actual prevalence is much higher than this estimated burden. Furthermore, although the prevalence may have been overestimated with respect to WHZ [2], the incidence was not taken into account; this would increase the annual burden much more substantially [3]. Whatever the actual magnitude it is clear that severe acute malnutrition (SAM), with other nutritional insults, are major neglected conditions leading to death and poor development of children globally and as such constitute a critical public health priority. The criteria used to define SAM have a crucial effect upon all aspects of the condition.
Not only assessments of the numbers of children affected but also their individual eligibility for treatment is affected by the criteria used to define SAM. These criteria have changed repeatedly over the years so that different numbers and degrees of severity have characterised those designated as having SAM. These schemes initially included those based upon weight-for-age, introduced by Gomez [4] and adopted by The Wellcome Trust [5], as the basic parameter [6]. Later weight-for-height was suggested [7] and forms a classification by Waterlow [8] to differentiate underweight children (weight-for-age) into those that are light because they are wasted (weight-for-height, WHZ) from those that are small because they are stunted (height-for-age). Wasting and stunting are thought to represent acute and chronic malnutrition and to be appropriately treated, respectively, with an acute intervention to reverse the wasting and prevent death or long term support to the child and family to permit sustained improvement of growth and development. The normal references to which the malnourished children are compared have also been refined successively from the Baldwin-Wood [9], Harvard [10], NCHS [11], CDC2000 [12] and more recently to the WHO2006 references [13]. The WHO2006 references are now promulgated as being standards, rather than references, to which all children should aspire for optimal health [14]. They have rendered all other references obsolete.
Since Waterlow’s classification [8], SAM has been defined as children having a low WHZ and/or nutritional oedema. More recently WHO has endorsed the additional criterion of a low absolute MUAC as an independent criterion to classify children with SAM [15]. Therefore the universal definitions of childhood SAM now mandated by WHO are a WHZ of <−3Z of the WHO2006 standards or an absolute MUAC of < 115 mm or nutritional oedema, or any combination of these three criteria.
Because of its simplicity, ease of use and relative cheapness as a diagnostic tool MUAC has been readily taken up to screen children for SAM in the community and elsewhere [16]. It can even be used by mothers themselves [17]. The development of a therapeutic food suitable and safe to give at home [18] has led to a revolution in the care of SAM children [19, 20], to scaling up of treatment programs (SUN movement) and “coverage” assessed by the proportion of SAM children diagnosed by MUAC in the community that are receiving treatment [21]. Thus, MUAC has been widely adopted by many agencies and some governments as the preferred criterion for diagnosis of SAM and is used to select children for treatment from the community and health facilities in accordance with WHO recommendations [22]; these agencies no longer assess WHZ and now run “MUAC only” programs. Children admitted by MUAC show as good a response to treatment in the community as those admitted by the WHZ criterion [23] particularly if they have a good appetite, are uncomplicated and are relatively close to the 115 mm threshold. Community programs prevent the milder forms of SAM from deteriorating further and developing complications and have enabled many children to access treatment at home who would otherwise have remained untreated.
Although the prevalence of SAM (and moderate acute malnutrition - MAM), is about the same in nutritional surveys when diagnosed by MUAC and WHZ, different children are identified by the two criteria with a considerable discordance in individual countries [24,25,26,27,28,29,30,31,32,33,34,35,36,37,38,39,40,41]. We previously collected data from representative community surveys of children from 47 countries to assess the degree of overlap for SAM and MAM by the two anthropometric criteria, to examine the external validity, the scale and direction of discordance and how it varied by country [42]. We found that the two criteria performed quite differently in the various countries and regions, with some diagnosing most SAM children with MUAC and others nearly all SAM children with WHZ. There was no satisfactory explanation for this phenomenon (see [42] for discussion). The mean overlap for SAM (children fulfilling both the WHZ and MUAC criteria) was 16.5%, so that more than 80% of children in the community had SAM by one or the other but not by both criteria. About 45% of the children fulfilled the WHZ definition for SAM but not the MUAC criterion; i.e. they were identified by WHZ alone because they had an absolute MUAC of over 115 mm. As the two diagnostic parameters select different children we proposed that both MUAC and WHZ should continue to be used routinely to identify those children who should receive treatment.
This suggestion led to a direct criticism from Briend et al. [43] who maintain that only MUAC should be used to identify severely malnourished children, that this is a public health priority and nothing should divert resources from universal use of MUAC as the only criterion for diagnosing and selecting children. The position taken by Briend et al. appears to have widespread approval shown by his numerous co-authors and support from humanitarian agencies and donors. However, Briend et al’s proposal has led to a controversy among the humanitarian and nutritional community concerning whether WHZ should or should not be abandoned as a criterion for the diagnosis of SAM. A major assertion justifying their point of view is that children with a low WHZ are relatively healthy [44,45,46,47,48,49,50] and therefore are not in need of treatment. Briend et al. [43, 46] also contend 1) that WHZ can be abandoned on the grounds that MUAC has repeatedly been shown to be a better indicator of mortality than WHZ, based solely on comparison of receiver operating characteristic curves (ROC) to predict long-term, all-cause mortality risk, 2) that they only have a low WHZ because their legs are relatively long, 3) that the two criteria are proxies for each other and 4) that when children satisfy both criteria their mortality rate is not additive, but that MUAC mortality is always higher than that of WHZ [43, 46, 49,50,51], and 5) that the addition of WHZ to MUAC does not increase the prognostic sensitivity or specificity of death prediction [51]. These contentions have each been rebutted [52] (rebuttal follows after [43]). At stake is the fate of the 45% of children with SAM by WHZ but not by the MUAC; if they are indeed relatively healthy at a low risk of death then dropping the use of WHZ may have merit, however, if they are at a high risk of death such a policy would lead to a large proportion of SAM children being denied treatment.
The purpose of this study is to address the controversy by examining the relative mortality rates of children who have SAM by the three different WHO recommended criteria; a WHZ of <−3Z using the WHO2006 standards, a MUAC of < 115 mm, and nutritional oedema (kwashiorkor and marasmic-kwashiorkor), each separately as well as the various combinations of the three criteria.
Our a priori hypotheses were 1) that children with SAM by MUAC-only and WHZ-only both have a substantial mortality risk, 2) that the two conditions are additive so that children satisfying both criteria have an augmented mortality risk and 3) that nutritional oedema further augments the risk of death. We did not hypothesise that SAM by MUAC-only or WHZ-only would have a higher mortality rate in older or younger children. On one hand younger children are more likely to have a MUAC < 115 mm but also have an inherently higher mortality rate, on the other hand an older child who fulfils the MUAC criterion will be more severely malnourished. Thus, we a priori determined to examine relative mortality by age group.
Methods
We re-analysed data from in-patient treatment facilities (IPFs), out-patient treatment programs (OTPs) and supplementary feeding centres (SFCs) to determine the mortality rates associated with combinations of the different diagnostic criteria: MUAC, WHZ and oedema using the WHO2006 recommended criteria that now define marasmus, kwashiorkor and marasmic-kwashiorkor.
In order to have a sufficient number of deaths, admission weight, height, MUAC, oedema, age, sex and outcome data were collected from patients that had been treated for SAM from three sources: 1) Therapeutic feeding centres and hospitals in African countries; these children, with complicated SAM were all under intensive daily care and are collectively referred to as being treated in in-patient facilities (IPFs); 2) Children with uncomplicated SAM with a reasonable appetite were treated in out-patient therapeutic programs (OTPs), and followed weekly; and, 3) Children initially classified as having MAM who were given take-home supplementary food and followed either every 2 weeks or monthly at supplementary feeding centres (SFCs).
All the data were retrospective and involved only children that were being treated using standard WHO therapeutic protocols [53] for earlier studies and updated versions for later studies [54] and for those treated as outpatients [55]. Although the treatment given in each type of program was different, the treatment given in each mode of treatment was standardised according to WHO and updates, derivative National Guidelines on Integrated Management of Severe Malnutrition and derivate Non-Governmental Organisations’ (NGO) guidelines. There were only minor differences between the documents. Most programs were carried out by International NGOs so that cross facility and country treatment was the same and the supervisory staff had had the same training at head-quarter level. A few were conducted under the auspices of UNICEF and again followed standard treatment guidelines.
Each child’s individual data had been recorded on forms designed specifically for the management of the severely malnourished according to the guidelines (they are not designed for research purposes). During original data collection these were verified by checking with the centres’ admission’s registry.
The data from all the IPFs, OTPs and SFCs were combined to give three separate datasets of individual patients admitted for one of the three modes of treatment. This was because individual facilities did not contain sufficient deaths to allow for meaningful statistical analysis. Some of the IPF data has already been reported [56]; others were obtained personally for the purpose of program evaluation during visits by MHG and Dr. Yvonne Grellety for National Governments, UNICEF and NGOs; most were from ongoing therapeutic programs by various NGOs.
SFCs should not have recruited any SAM children as these are specifically designed for treatment of MAM children only. However, with the introduction of the WHO2006 standards some children who had been classified as moderately malnourished using the NCHS reference or a MUAC cut-off of < 110 mm now satisfied the criteria for SAM with the WHO2006 standards and the introduction of a higher MUAC cut-off point as admission criteria for SAM. The data for those children, re-classified as SAM, were abstracted from the SFC data and constitutes a separate dataset for the purpose of this study. As the difference between the NCHS and the WHO standards affect mainly children below about 72 cm in height when NCHS <−3Z was used and all children when < 70% of the NCHS median was used as the admission criterion, the reclassification mainly selected younger children. These children would all have milder forms of SAM as their WHZ fell into the “tramlines” between the two references; those with more serious illness would have been treated in the OTP or IPF.
The individual datasets from each centre and program had been recorded by the authors or by the staff of the NGO running the program using either SPSS, Epi-info or Excel (various versions). They were all transferred to ENA-for-SMART software [57] and their WHZ computed using the WHO2006 gender specific standards.
All children that did not meet at least one of the criteria for SAM, were below 6 or above 60 months or the data for weight, height, MUAC or outcome was absent were excluded. The data were examined for gross errors of recording (such as a child with a height of 10 cm, a weight of 30 kg or a MUAC of 50 mm) which could not occur in children from 6 to 60 months; these records were also excluded. A flow-chat of the data handling and cleaning is given in Fig. 1. No records were excluded on the basis of either WHO or SMART flagging of extreme values; it was assumed that children who were below the cut-off points used during data-cleaning for survey analysis would still fall below the cut-off points for SAM and so were correctly categorised.
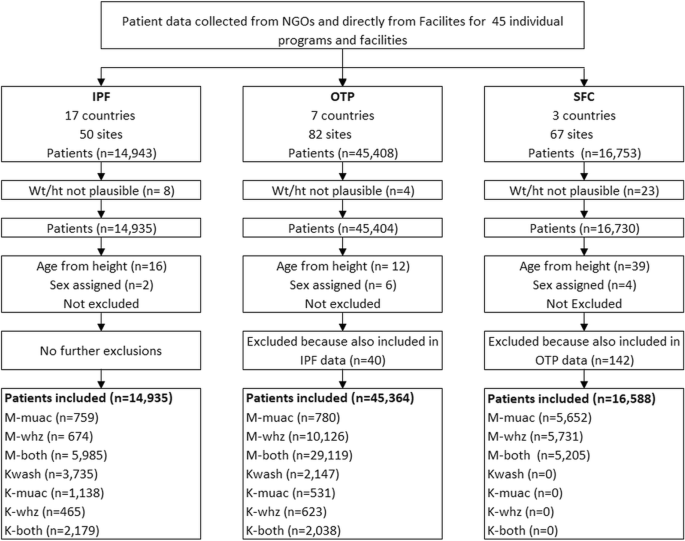
Flow chart of analyses of admissions for treatment of Severe Acute Malnutrition in Africa. NGOs Non-Governmental Organizations; IPF In-patient Facility (Hospital. Therapeutic Feeding Center); OTP Out-patient Treatment Program (Home treatment); SFC Supplementary Feeding Center; Wt/ht Weight or height; M-muac MUAC < 115 mm with WHZ ≥ −3Z and no oedema (marasmus by MUAC only); M-whz WHZ < −3Z with MUAC ≥115 mm and no oedema (marasmus by WHZ only); M-both MUAC < 115 mm & WHZ < −3Z and no oedema (marasmus by both diagnostic criteria); Kwash nutritional oedema/Kwashiorkor without meeting either MUAC or WHZ criteria; K-muac oedema & MUAC < 115 mm with WHZ ≥ −3Z (marasmic kwashiorkor by MUAC only); K-whz oedema & WHZ < −3Z with MUAC ≥115 mm (marasmic kwashiorkor by WHZ only); K-both oedema & MUAC < 115 mm & WHZ < −3Z (marasmic kwashiorkor by both diagnostic criteria)
As no data were being analysed that depended upon accurate recording of age, where age was not recorded they were retained in the analysis if their heights were between 55 and 115 cm and assigned an age according to their height so that breakdown of the children’s outcome into broad age groups would not be biased (71 children: less than 0.01% of all patients). Where oedema was not recorded they were assumed to be oedema free. Oedema status was not recorded for any of the children in SFC as the presence of oedema is a criterion for direct admission to SAM treatment programs; all these children were assumed to be oedema free. Where sex was not recorded they were assigned a sex at random (12 children).
In keeping with intention-to-treat practice, for each dataset, children that defaulted were retained in the analysis as they were at risk of death prior to their default and most deaths from malnutrition occur early after admission before most defaults occur and children in extremis are less likely to default (the numbers of defaulting children are given in Table 1. Children recorded as failing to respond to treatment were retained. The outcome of non-responders and defaulters after quitting the service is unknown; there was no recorded follow-up of such children in any of the programs. Some of the children in the OTP were recorded as “other”; these were children who moved out of the catchment area, were transferred to a different OTP or started their treatment in the IPF and continued treatment successfully in the OTP. They were retained in the analysis (they were not included in the IPF data).
Children from the SFC who were recorded as being transferred to an OTP or IPF were excluded if the data from the receiving treatment facility were available, otherwise they were included. Similarly, for the OTP, children that were transferred to the IPF were excluded from the analysis if the corresponding IPF data were available, otherwise they were included (i.e. no child was counted in both programs). Children that were transferred to other facilities from the IPF were included in the analysis and assumed to have survived; they were mostly children sent for surgery, tuberculosis or other specialised treatment after their initial severe malnutrition has been successfully managed.
The absolute numbers of children admitted in one of the following categories was determined for each data set divided by whether they left the program alive or dead. Children having:
-
1.
MUAC < 115 mm as the only criterion for admission (WHZ ≥ −3Z, no oedema) - (M-muac);
-
2.
WHZ < −3Z as the only criterion for admission (MUAC ≥115 mm, no oedema) - (M-whz);
-
3.
MUAC < 115 mm and WHZ < −3Z (no oedema) - (M-both);
-
4.
oedema with MUAC ≥115 mm and WHZ ≥ −3Z - (Kwash);
-
5.
oedema with MUAC < 115 mm and WHZ ≥ −3Z - (K-muac);
-
6.
oedema with MUAC ≥115 mm and WHZ < −3Z - (K-whz);
-
7.
oedema with MUAC < 115 mm and WHZ < −3Z - (K-both).
The abbreviations given in parenthesis are used where M- indicates marasmus, K- indicates kwashiorkor/oedematous malnutrition, “muac” is used when the only anthropometric criterion is a MUAC of < 115 mm, “whz” when the only anthropometric criterion is a WHZ < −3Z WHO2006, and the suffix “both” when the child has both a MUAC < 115 mm and a WHZ < −3Z.
The data for non-oedematous and oedematous children were analysed separately. Those children who were alive at exit from the program compared to those that had died were analysed by 2 × 3 and 2 × 4 Chi-squared analysis respectively. The post-hoc individual comparisons were made using the Marascuilo procedure [58, 59]. The complete data were also analysed using a 2 × 7 chi-squared analysis with post hoc Marascuilo comparisons to confirm the significance of comparisons of interest with increased degrees of freedom (data not presented as they include a number of comparisons that were not considered a priori).
The individual comparisons were then re-tested by grouping all the children with a low MUAC (i.e. M-muac + M-both) to give a count of all the children admitted who had a low MUAC – designated as “ALL-muac”. Similarly all children with a low WHZ (M-whz + M-both) were combined to be analysed as “ALL-whz”. This was repeated with the K-muac, K-whz and K-both groups and also with the grand total of oedematous and non-oedematous children combined. These additional analyses were made because most of the published literature on comparison of MUAC and WHZ criteria for diagnosis of SAM includes children that are oedematous and most do not distinguish those who have a single deficit from those that have both a low MUAC and a low WHZ (studies reviewed in the companion paper – [60]).
Because we anticipated that there would be a difference in the relative mortality in younger and older age groups all the analyses were repeated using children 6 to < 18, 18 to < 36 and 36 to 60 months of age.
To determine whether there were regional differences in case fatality rates (CFRs) of children who were admitted by MUAC-only or WHZ-only we combined the data from countries within each region of Africa (see Additional file 1: Table S1 for combinations of countries) by treatment program for comparison of the respective mortality risks. The data were analysed by binary meta-analysis using MetaXL version 5.3 [61]. The odds ratios comparing the case fatality rates for children admitted with M-muac v M-whz and also K-Muac v K-whz were compared using Peto’s method [62] of weighting the groups. No adjustment for the quality of each set of data was made. We did not have sufficient access to any potential confounding data to adjust for confounding.
Ethical statement
This is a secondary analysis of existing anonymous data which had been collected and analysed for programmatic purposes: that is, to audit services, compare the performance with the Sphere standards [63], identify were performance needed improvement and assess case-loads for future staff and product requirement planning. As no individual, location or administrative district could be identified formal ethical clearance was not required.
Results
The children’s countries of residence, mode of treatment and outcomes are shown in Table 1. The corresponding breakdown of the children by diagnostic criteria is given in Additional file 2: Table S2. There were 76,887 children with SAM in the three modes of treatment of which 3588 died. They are divided into the 7 different diagnostic categories of SAM depending upon the criteria present at the time of admission. Their mortality rates are presented by mode of treatment and age group in Table 2. The significances of the paired differences between the diagnostic groups are given Table 3. Figs. 2 and 3 show, respectively, the CFRs and the relative risks of death (RR) calculated against M-muac (the lowest RR) to show how the risks of death for each of the 7 categories of patient relate to one another. The data for the IPF and OTP combined (i.e. excluding those children reclassified as SAM from the SFC) are given in Additional file 3: Table S3.

Case-fatality rates of children with SAM aged 6–60 by diagnostic criteria and treatment program. IPF In-patient Facility; OTP Out-patient Treatment Program; All patients refers to the combined totals of children in the IPF, OTP and the SFC (Supplementary Feeding Center); M-muac MUAC < 115 mm with WHZ ≥ −3Z and no oedema; M-whz WHZ < −3Z with MUAC ≥115 mm and no oedema; M-both MUAC < 115 mm & WHZ < −3Z and no oedema; Kwash nutritional oedema/Kwashiorkor without meeting either MUAC or WHZ criteria; K-muac oedema & MUAC < 115 mm with WHZ ≥ −3Z; K-whz oedema & WHZ < −3Z with MUAC ≥115 mm; K-both oedema & MUAC < 115 mm & WHZ < −3Z; CFR Case fatality rate

Relative Risks of death (RR) of children with SAM aged 6–60 months by diagnostic criteria and treatment program. The relative risks of death are calculated against marasmic children by MUAC only (M-muac). The error bars are the 95% confidence intervals. IPF In-patient Facility; OTP Out-patient Treatment Program; M-muac MUAC < 115 mm with WHZ ≥ −3Z and no oedema; M-whz WHZ < −3Z with MUAC ≥115 mm and no oedema; M-both MUAC < 115 mm & WHZ < −3Z and no oedema; Kwash nutritional oedema/Kwashiorkor without meeting either MUAC or WHZ criteria; K-muac oedema & MUAC < 115 mm with WHZ ≥ −3Z; K-whz oedema & WHZ < −3Z with MUAC ≥115 mm; K-both oedema & MUAC < 115 mm & WHZ < −3Z; RR Relative Risk of death
Considering marasmus, overall the mortality is significantly higher in those with WHZ < −3Z than in those with MUAC < 115 mm. WHZ-only children also had a higher mortality in each of the age groups although this does not reach significance in the children 36 to 60 months. The children who had both anthropometric deficits had more than twice the mortality of either the WHZ-only or the MUAC-only groups. The children with complicated SAM (IPF) and those without complications (OTP) show the same pattern of mortality, but, as expected, it is higher in the complicated than uncomplicated cases. For both the complicated and un-complicated cases examined separately, the higher mortality with WHZ than with MUAC was present in each of the age groups. There was no indication that MUAC mortality dominated death in either the younger or older age groups. WHZ-only consistently had equivalent or higher mortality than MUAC-only across all age groups.
For the oedematous children, those without severe wasting (Kwash) had about the same mortality rate as the marasmic children with both anthropometric deficits (M-both), but higher than children with single deficits. It was significantly higher in the complicated than the uncomplicated cases; this is presumably because only children with mild or moderate oedema are admitted to the OTPs whereas those with severe oedema are always admitted to the IPF as well as those with complications. Table 2 also shows the RR of oedematous children calculated against those without an anthropometrical deficit (Kwash). The children with oedema and a low MUAC (K-muac) did not have a higher mortality than oedematous cases without a low MUAC (Kwash) in either the OTP or IPF so that the addition of the MUAC criterion to oedematous cases did not increase their mortality risk (K-muac). This is in marked contrast to the children with oedema and a WHZ below <−3Z (K-whz); these particular children in both the OTP and IPF experienced a very high CFR and a RR of between 2 and 3 times the risk for children with either Kwash or K-muac. Their mortality was, well above the Sphere standards. The fact that the severely oedematous cases (+++) were not included in the OTP group did not seem to ameliorate the mortality rate of the K-whz children treated as outpatients compared to those treated in the IPFs. Furthermore, addition of a low MUAC to those who already had a low WHZ and oedema (K-both) did not further augment the mortality rate over those with oedema and a low WHZ (K-whz). Thus, the presence or absence of a MUAC below 115 mm in the oedematous children appears to be without significance in terms of increasing their mortality risk; this is in marked contrast to WHZ where there was a profound increase in risk.
In comparison with those children with only a MUAC < 115 mm, each diagnostic category had a significantly higher relative CFR and RR (Figs. 2 & 3). In the case of the children with a WHZ < −3Z and oedema the death rate was between 6 to 12 times as high as those with only a MUAC < 115 mm. These observations did not change by age group, although the numbers of deaths in the older age group and in the children admitted to SFC was insufficient to reach significance.
Meta-analysis showing regional differences
Figure 4 shows the forest-plot of the meta-analysis by programs from the different regions of Africa comparing WHZ-only with MUAC-only. The countries that constituted each of the regions are given in Additional file 4: Table S4 (OTP of oedematous children from West Africa is omitted from the plot for formatting reasons. The odds ratio in favour of K-whz over K-muac was very high – 17.8, CI = 7.5–41.9 – but is included in the statistics and sensitivity analyses given in Additional file 5: Table S5). Overall the odds ratio of death was 1.7 times higher for the children with only a WHZ < −3Z that those with only a MUAC < 115 mm. There were regional differences; for each of the modes of treatment (IPF, OTP, SFC) WHZ carried a higher risk of death than MUAC in the Central, West and Sahelian countries for both non-oedematous and oedematous children. In contrast, marasmic children in the East African group (Kenya, Tanzania, Uganda, Ethiopia) had a lower risk of death with WHZ than with MUAC, albeit not significantly.

Forest plot by region comparing Odds ratios of the risk of death of M-muac v M-whz. Maras Marasmus (M-muac vs M-whz); Kwash nutritional oedema (K-muac vs K-whz); IPF In-patient Facility; OTP Out-patient Treatment Program; SFC Supplementary Feeding Center; DRC Democratic Republic of Congo. The countries contributing data from each region are given in Additional file 2: Table S3. The statistical data are given in Additional file 4: Table S4 and the sensitivity analysis in Additional file 5: Table S5. Please note that the data for OTP West Africa has been omitted from this plot due to issues of presentation, but the data including this program is given in the additional files. In each of the forest plots “favours WHZ” indicates that the Odds ratio for death is higher in children with WHZ < −3Z than with a MUAC of < 115 mm; “favours MUAC” indicates that the Odds ratio for children with a MUAC < 115 mm is higher than those with WHZ < −3Z
The same data are analysed by oedema status and presented in Fig. 5. They show that for marasmic children the odds ratio is marginally significant at 1.37 (95% CI, 0.99–1.90) whereas for oedematous children the odds ratio for death with K-whz is twice that of K-muac (2.03, CI 1.50–2.75). The East African data in particular shows a discordance between the children without oedema and those with oedema.

Forest plot by oedema status (marasmus vs kwasiorkor) region comparing Odds ratios of the risk of death of children admitted with WHZ < −3Z only against MUAC < 115 mm only. Maras Marasmus (M-muac vs M-whz); Kwash nutritional oedema (K-muac vs K-whz); IPF In-patient Facility; OTP Out-patient Treatment Program; SFC Supplementary Feeding Center; DRC Democratic Republic of Congo
Simpson’s paradox
In Table 4 the case fatality rates for the patients with MUAC-alone, WHZ-alone and both combined are shown and compared with all the cases with a low MUAC (All-muac = M-muac + M-both) and all the WHZ cases (All-whz = M-whz + M-both). As shown in Table 2, for marasmic cases each comparison is highly significant with WHZ having a higher mortality than MUAC when the children fulfilling each criterion alone are considered. Table 4 shows that when the children with both defects are added to the WHZ and the MUAC categories not only is the difference now non-significant, but the CFR is reversed so that MUAC now appears to have a higher mortality than WHZ. For the oedematous children the ratio is not quite reversed, but the apparent mortality of MUAC has increased and that of WHZ decreased. When all the SAM children are considered, that is oedematous and non-oedematous SAM combined, again the relative mortality is significantly higher in children with a low WHZ when considered alone, but this is reversed when the children with both criteria are incorporated into the MUAC and the WHZ groups.
This is an example of extreme confounding, in this case due to mathematical coupling, leading to Simpson’s paradox where there is a paradoxical reversal of the estimated mortality risk to give an erroneous result when groups of children are inappropriately combined.
Discussion
To judge whether using any of the 3 recognised WHO diagnostic criteria for SAM can be dropped, the critical factor is to focus on the potential fate of those children who would then become systematically ineligible for treatment and omitted from care. About 45% of SAM children in the community fulfil the WHZ but not the MUAC criterion [42]. Any advocates that propose elimination of children fulfilling WHZ criteria from treatment should demonstrate that both their risk of death and the other detrimental effects of being severely malnourished are trivial or at least substantially lower than those diagnosed using MUAC. Our data demonstrate that children with a WHZ less than -3Z but a MUAC of above 115 mm are at high risk of death, at least as high as or higher than those with a low MUAC across each of the age groups. On this evidence there is no place to cease the use of WHZ as an independent criterion for the admission and treatment of SAM children; agencies and governments that have adopted a MUAC-only policy should reflect upon the provisions of their guidelines, and where appropriate reverse the MUAC-only policy and maintain using the current WHO guidance.
It would appear that the contentions put forward by Briend et al. and others [43, 46, 49,50,51] are incorrect (see also the companion paper [60] where the literature is reviewed). In particular the contention that children with a WHZ below -3Z are relatively healthy with a low risk of death. This is justified by reference to a review on leg length and beauty which does not mention wasting let alone marasmus [64]. This contention is without evidence and contrary to common sense and clinical experience in all age groups [65]. In fact there are abundant data to confirm that low WHZ itself caries a substantial risk of death [66,67,68,69,70,71,72,73,74,75,76,77,78]. Although none of these papers also measured MUAC to determine whether the deaths occurred in patients that had a concomitant low MUAC and would therefore be identified by both criteria. Given the low rate of concordance it is unlikely that the majority of deaths occurred in children with both deficits. Of interest is the paper by Katz et al. [72] who show a much higher mortality risk for WHZ (< 80% NCHS) in older than younger children, when they are less likely to have a low MUAC. Briend is a co-author on O’Neill et al’s paper [76] where BMI-for-age (closely related to WHZ) is a better predictor of mortality than MUAC and WHZ itself has a dramatic impact on mortality.
Briend et al. also assert that the discrepancy is simply because children with a low WHZ have longer legs, whereas the only papers that have addressed this issue show this is, at best, a minor contributor [32, 42, 79] and the original authors are clear that long legs do not explain the discrepancy between WHZ and MUAC. Long legs do not account for the fact that in most surveys different children are identified by WHZ and MUAC. The discrepancy is more likely due to differences in body build, rather than linear growth; a concern of auxologists in early studies which has not been considered in deriving modern standards [9, 80]. What is not clear is whether endomorphic children, with narrow torsos, who are more likely to have a lower WHZ, have a different risk of death than exomorphic children. We speculate that endomorphic children have a higher risk of death than exomorphic children, in the face of privation, as their body fat and muscle mass is relatively low; however, there are no data to support or refute such an hypothesis.
Briend et al. also dispute that the deficits are additive or that the two diagnostic criteria are complementary. Our data also show that this assertion to be false. Those with both deficits had over twice the mortality of those with a MUAC< 115 mm alone. Indeed, some of the data suggests that the deficits might by synergistic. Even WHZ and stunting (height-for-age) combined show an additive effect [74]. Although stunting has not been taken into account in our analysis it is another confounder for all prognostic assessments of SAM. In our companion paper [60] we present a literature review of studies comparing WHZ and MUAC to predict death of malnourished children; the conclusions reached are in broad agreement with the present study.
Confounding and Simpson’s paradox
Simpson’s paradox is an example of extreme confounding where the actual results of a comparison can be reversed resulting in the less important variable becoming the dominant variable. This can occur with all analyses of categorical data, including simple Chi-squared analyses, logistic regression and ROC curve analyses. When categorical and continuous/ordinal data are combined the same phenomena can also occur and is then termed Lord’s paradox and when both sets of data are continuous “suppression effects”. They all have the same basis and are due to inadequate categorisation of subjects, confounding, mathematical coupling, inappropriate adjustment and unmeasured effects [81]. Even if the results are not actually reversed, mathematical coupling and the other confounders give erroneous results. The classical examples compare surgical operations for renal stones, psychiatric hospital admissions and death from diabetes [82] where those with more severe disease are not analysed separately from those with milder forms of a condition. Combining patients inappropriately led to erroneous statics and conclusions in each case. In the case of SAM, the same phenomenon occurs when children with both deficits, who have a higher mortality risk, are combined with those with single deficits who have a lower mortality risk, particularly when WHZ children are at higher risk of death than those with a low MUAC. Thus, inappropriate categorisation of patients, the presence of confounding or data from patients that are included in both arms of a comparison, even if the results are not completely reversed the magnitude of the difference in mortality can be grossly in error. Stochastic studies that relate subsequent events to antecedent parameters (such as subsequent death to antecedent anthropometry or adult blood pressure to birth weight etc. [83]) are particularly liable to error by confounding, sometimes to the extent of paradoxical reversal.
Consider Table 5. Here we present comparison of two criteria X and Y, with different numbers of subjects and deaths (the table can be reproduced in a spreadsheet to examine the paradox). In scenario A, there are no deaths at all in children with X alone, but when combined with children with both X and Y, the two deficits appear to have exactly the same mortality risk. In scenario B there is a lower CFR with X than with Y, but when those with both deficits are added the apparent CFR is reversed. In scenario C the two deficits have the same morality risk, but when combined with those with both deficits X appears to have a higher mortality. The percentage of total deaths identified using criterion X is much lower than with Y in each scenario even though the CFR with X appears to be higher when those with both groups are incorporated. In this case the error is due to mathematical coupling.
Mathematical coupling occurs where “one variable directly or indirectly contains the whole or part of another, and the two variables are analysed using standard statistical techniques” [84, 85]. This nearly always results in erroneous results and appears to be the case in all the papers where children with M-both or K-both have been incorporated into the data analysed (see companion paper II [60]) and is the case with our patient’s data (Table 4). It is for this reason that we have not used the children with both deficits in the meta-analysis and separated them in Table 2. Other types of confounding can also cause errors and even generate Simpson’s paradox. Some are know; for example, the meta-analysis showed that MUAC had a higher risk of death for marasmic children in three different programs in East Africa and the combined risk is marginally in favour of WHZ, but when the children with oedema are added to the them Fig. 5 shows that the risk is changed so that overall WHZ has a significantly higher mortality. Some confounders have not been recorded in our data such as HIV, diarrhoea and family circumstances; and some are unknown such as birth weight. The use of such data to guide policy must be circumspect and confirmed. These problems are usually described in regression or correlation analyses, but the phenomenon also applies to logistic regression and ROC curve analysis.
ROC curves
Comparison of WHZ and MUAC related all-cause mortality using ROC curve comparisons generally show that the area under the curve is greater with MUAC than WHZ and is the only reason why MUAC is considered to be a “superior” prognostic of death than WHZ [51, 68, 86,87,88]. The question arises as to why these ROC curves have provided the opposite results to the findings in the present analysis. We have discussed many problems of ROC curve interpretation in relation to MUAC and WHZ assessment of future all-cause mortality elsewhere [52]. In particular, if they identify mostly or completely different children at high risk of death we argue that they are complementary and are not competing to identify the same child deaths. Thus, even if one diagnostic has a higher mortality risk than the other, if different deaths are identified, they are both useful prognostic indicators. If the objective of treatment is to try to prevent all the deaths and not only deaths which are related to one or the other diagnostic criterion both diagnostic criteria must be used. This is despite the fact that none of the anthropometric criteria are very good prognostic indicators and the differences between them are marginal. Each relates poorly to clinical or physiological abnormalities [89,90,91,92].
There has been a debate in the statistical literature about the problems of bias in ROC curves [93] which are particularly relevant to prognostic models of stochastic data (i.e. a future event) [94,95,96]. There have been attempts to combine time-to-event analysis with ROC curve analysis [97] and also comparison of crude data against smoothed data analysis with small sample sizes of individuals [98], but frequently there are anomalous results [99]. It is noteworthy that most of the papers presenting ROC curves of WHZ and MUAC have not given the confidence intervals of the curves [100].
The ROC curves that have been published in support of MUAC being “superior” to WHZ are all subject to Simpson’s paradox because the children with both defects have not been analysed separately. They are also confounded due to the presence of oedema, HIV, convulsions, measles and other biases that affect children with a low MUAC and WHZ differently. As Tu et al. [81] state: “Incorrect use of statistical models might produce consistent, replicable, yet erroneous results”. We contend that this stricture applies to each of the reports using ROC curve analysis and the conclusions based upon these data are consistently erroneous. When we separate those children with both defects from those with either one or the other we reach quite the opposite conclusion; WHZ < −3Z has a higher mortality risk than MUAC < 115 mm.
When the WHZ ROC curve has a greater area under the curve than the MUAC curve, the data are not presented as the authors consider there has been a mistake [101]. When sensitivity is compared there are some situations where WHZ out performs MUAC [39]; this is uncommon with combined data but is usually ignored. Although papers, with completely inadequate data are erroneous and have been heavily criticised [102], they are still being quoted to justify a MUAC-only policy [103].
Marasmic-kwashiorkor
The finding of an exceptionally high mortality among children with oedema and a WHZ < −3Z, but no augmentation of mortality in those with oedema and a MUAC < 115 mm, is an unexpected new finding which to our knowledge has not been previously reported. The only explanation we can think of is that the weight of the oedema fluid will increase the WHZ so that the oedema-free WHZ may be much less than -3Z. However, the fact that the high mortality occurred in the OTP, with mild to moderate oedema, as well as the IPF with more severe oedema is against this as a complete explanation. The severity of the oedema does not appear to substantially affect the increased mortality risk when combined with a WHZ < −3Z. It appears that there is a qualitative difference between oedematous SAM related to a low WHZ and a low MUAC. The effect is seen in both younger and older children, so that age is not a satisfactory explanatory factor. Nevertheless, this observation may explain a controversy surrounding the relative increase in risk of children with marasmic-kwashiorkor over those with either marasmus or kwashiorkor alone. The WHO guidelines state that children who have been selected by screening children with MUAC and have mild or moderate oedema can be safely treated as outpatients [104], whereas clinicians treating children admitted using WHZ criteria maintain that children who also have oedema are at very high risk of death. Our data may reconcile this difference as the difference appears to depend upon whether a child has been diagnosed using the WHZ or the MUAC criterion. It should be noted that the high mortality in our data for oedema plus WHZ < −3Z was for both children with a MUAC of more and less than 115 mm. As the two anthropometric parameters appear to identify different risks of death, we suggest that all oedematous children should have their WHZ assessed and if they have marasmic-kwashiorkor with a WHZ of less than -3Z they should be treated as in-patients, whereas if their only anthropometric deficit is a low MUAC they can continue to be treated as out-patients.
Limitations of the study
Although there were a very large number of children’s data amassed for this analysis, when those with “both” criteria were omitted from the analyses there were few deaths in some of the categories of interest, making it necessary to combine data from different sites. This could have resulted in a “clustering” effect. However, the large number of sites contributing data should have ameliorated such effects.
The percent of children with both WHZ and MUAC criteria without oedema in the IPF, OTP and SFC is 81, 73 and 31% respectively; for those with oedema the overlap was 58 and 64%. Compared to the overlap of SAM children identified in nutritional surveys (16.5%) in the community there is an excess of children fulfilling both criteria. There is a clear ascertainment bias as well as potential co-morbidity and stochastic biases [52]. The increase is numbers of children with both criteria may have contributed to the appearance of Simpson’s paradox. The increase in the degree of overlap going from the least to the most intensive management reflects the severity of the cases being admitted as well as the diagnostic procedures and policy of the institutions/agencies involved. As a child deteriorates s/he is more likely to be complicated, to fulfil more than one diagnostic category and to be admitted for more intensive treatment. The ascertainment bias indicates that the data do not reflect the children with SAM in the community and disproportionally describes the experience of more severely affected children than are generally found during a community survey. Nevertheless, by dividing the children into the 7 different diagnostic categories, and omitting those satisfying both criteria from comparison of MUAC and WHZ CFRs, we consider that this bias has been ameliorated; thus, the M-muac and M-whz children included are more likely to represent the M-muac and M-whz children found in the community than the M-both children. Ascertainment bias is likely to be a more important consideration in studies that fail to separate the categories of patients and also those that include oedematous children in the analysis.
The fact that similar results were obtained in each mode of treatment supports the conclusion that children with a low WHZ have a higher mortality risk than those with a low MUAC, in all age groups and modes of treatment irrespective of the criterion used to admit the child for treatment initially. The fact that similar results were obtained with the three modes of treatment, each with a different degree of overlap, indicates that this is not a primary cause for the paradoxical results found.
We did not have data for other potential confounding influences on our analyses; in particular variables such as infection rates (TB, HIV, malaria etc.), socio-economic status, birth weight etc. all of which could confound studies of this nature. Furthermore, the causes of death were not clear, but were presumed to be related to their severe acute malnutrition.
There were a considerable numbers of defaulters from all the programs (Table 1). We included them in our study because they were at risk of death up to the time they defaulted and defaulting generally occurs after most of the deaths due to SAM have taken place [56]. However, this applies mainly to the IPF patients were it is know for certain whether a child has died or not prior to default. The patients in OTP and SFC are at home and attend the program sites weekly or less often; they are declared defaulters if they do not attend for two consecutive visits. As home visits are rarely performed, a proportion of these “defaulters” will have died; thus, the OTP and SFC’s mortality rates should be regarded as minimum mortality rates and not actual mortality rates. For this reason defaulting is a potential major bias particularly for the OTP and SFC data. Table 6 shows the percent of defaulting by category and treatment mode. There was no difference in the rate of defaulting for children with M or K muac and whz in the IPF. However, in the OTP and SFC the difference was significant; children with M-muac had a higher percent of defaults than those with M-whz. If the same proportion of defaulting children died with each criterion, then there would be more deaths added to the M-muac group which would increase their CFR. With the oedematous children in the OTP the defaulting rate difference was the opposite so that this would increase the oedematous children’s K-whz CFR more than the K-muac rate. For these reasons the OTP and SFC data are less reliable than the IPF data. This criticism applies to all studies of patients attending OTP programs unless there is universal home-visiting follow-up to ascertain the reason for the patient not attending the OTP/SFC site. This is very rarely done. One study from Niger (Médecins Sans Frontières personal communication) indicated that about 10% of “defaults” could be reclassified as deaths, but this figure is likely to be context specific, so we have not assumed any particular “correction” factor for our analyses.
Oedema is rarely seen during a nutritional survey because the time course of kwashiorkor is brief relative to marasmus; thus, even if the prevalence is low during a survey, the incidence can be considerable; this is evident from the high proportion of oedematous cases in some of the IPF studies. The ratios of oedematous SAM to non-oedematous SAM in treatment facilities always greatly exceed those in surveys.
In order to choose an appropriate admission policy that avoids death due to SAM, children should be categorised in the analysis into those with each criterion alone or both separately and those who have oedema or death from diseases not related to their nutritional status should be analysed separately.
Conclusions
Some within the nutritional community has been deceived by replicated ROC analyses because of mathematical coupling and confounding which may even lead to Simpson’s paradox. Children with a low weight-for-height are at substantial risk of death at least as great as those with a low MUAC. But, because the two parameters identify different children they cannot be fairly compared as diagnostic markers for the same risks so that the comparison of areas under ROC curves, even if this were statistically a legitimate comparison, is largely meaningless. In studies of cancer, for example, one would not compare the ROC curves of all-cause mortality in patients with bladder and renal cancer and decide, because one curve was “superior” to drop attempts to diagnose the other condition.
MUAC-only programs will fail to identify up to 45% of SAM children at high risk of death without the possibility of their being diagnosed or treated, and this omission will fail to be recognised by “coverage surveys” using MUAC screening alone. In our opinion MUAC-only programs are unethical wherever it is possible to also measure WHZ because they contravene the dictates of Hippocrates. In emergency situations where health services are overwhelmed MUAC- only programs could be justified at the outset of the emergency; however, in emergencies older children have a proportionately higher increase in prevalence of SAM (unpublished) than younger children and emergency interventions should not neglect this group of children. The research priority should be to develop innovative ways of identifying those children with a low WHZ in community screening programs. Stereo-photography has been used for many years [105] but with modern technology this has become practical [106,107,108,109]. Such data may also solve the problems of body build in determination of the difference between those with a low WHZ and a low MUAC and explore the relative risks of endomorphic and exomorphic children. In the meantime WHZ should continue to be used in all health facilities to identify and treat all those children with SAM by WHZ only.
Our data also suggest that those children with oedema and a low WHZ, but not those with a low MUAC, are at very high risk of death and should be referred to an IPF for initial treatment; they should form a separate diagnostic category and considered to be a very high risk group.
Both a WHZ < −3Z and MUAC < 115 mm must be retained as diagnostic criteria for SAM.
Abbreviations
- CFR:
-
Case fatality rate
- IPFs:
-
In-patient treatment facilities
- MAM:
-
Moderate acute malnutrition
- MUAC:
-
Mid-upper-arm-circumference
- NGOs:
-
Non-governmental organisations
- OR:
-
Odds ratios
- OTPs:
-
Out-patient treatment programs
- ROC curve:
-
Receiver operating characteristic curve
- RR:
-
Relative risks
- SAM:
-
Severe acute malnutrition
- SFCs:
-
Supplementary feeding centres
- WHZ:
-
Weight-for-height Z-score
References
Black RE, Victora CG, Walker SP, Bhutta ZA, Christian P, De Onis M, et al. Maternal and child undernutrition and overweight in low-income and middle-income countries. Lancet. 2013;382:427–51. http://www.sciencedirect.com/science/article/pii/S014067361360937X
Grellety E, Golden MH. The effect of random error on diagnostic accuracy illustrated with the anthropometric diagnosis of malnutrition. PLoS One. 2016;11:e0168585. http://journals.plos.org/plosone/article?id=10.1371/journal.pone.0168585.
Isanaka S, O’Neal Boundy E, Grais RF, Myatt M, Briend B. Improving estimates of numbers of children with severe acute malnutrition using cohort and survey data. Am J Epidemiol. 2016;184(12):861–9. https://doi.org/10.1093/aje/kww129.
Gomez F, Galvan RR, Cravioto J, Frenk S. Malnutrition in infancy and childhood, with special reference to kwashiorkor. Adv Pediatr. 1955;7:131–69.
Anonymous. Classification of infantile malnutrition. Lancet. 1970;2:302–3.
Gopalan C, Rao KSJ. Classifications of undernutrition? Their limitations and fallacies. J Trop Pediatr. 1984;30:7–10.
Dugdale AE. An age-independent anthropometric index of nutritional status. Am J Clin Nutr. 1971;24:174–6. http://ajcn.nutrition.org/content/24/2/174.full.pdf+html
Waterlow JC. Classification and definition of protein-calorie malnutrition. Br Med J. 1972;3:566–9. https://www.bmj.com/content/bmj/3/5826/566.full.pdf.
Pryor HB, Stolz HR. Determining appropriate weight for body build. J Pediatr. 1933;3:608–22. http://www.sciencedirect.com/science/article/pii/S0022347633801284
Stuart HC, Stevenson SS, Nelson WE. Textbook of pediatrics. In: Textbook of pediatrics. Philadelphia: Saunders; 1959. p. 50–1.
Hamill PV, Drizd TA, Johnson CL, Reed RB, Roche AF. NCHS growth curves for children birth-18 years. United States, Vital and health statistics. Series 11, Data from the National Health Survey edn. 1977. http://www.dtic.mil/dtic/tr/fulltext/u2/a433981.pdf
Kuczmarski RJ, Ogden CL, Grummer-Strawn LM, Flegal KM, Guo SS, Wei R et al. CDC growth charts: United States. Advance data [314], 1–27. 2000. https://stacks.cdc.gov/view/cdc/11267
WHO. The WHO Child Growth Standards. 2006. http://www.who.int/childgrowth/standards/en/
De Onis M, Garza C, Onyango AW, Borghi E. Comparison of the WHO child growth standards and the CDC 2000 growth charts. J Nutr. 2007;137:144–8. http://jn.nutrition.org/content/137/1/144.full
WHO, Unicef. WHO child growth standards and the identification of severe acute malnutrition in infants and children: a joint statement by the World Health Organization and the United Nations Children's fund. 2009. http://www.who.int/nutrition/publications/severemalnutrition/9789241598163_eng.pdf
Myatt M, Khara T, Collins S. A review of methods to detect cases of severely malnourished children in the community for their admission into community-based therapeutic care programs. Food Nutr Bull. 2006;27:S7–23. http://archive.unu.edu/unupress/food/FNB_v27n3_suppl.pdf#page=7
Ale FG, Phelan KP, Issa H, Defourny I, Le Duc G, Harczi G, et al. Mothers screening for malnutrition by mid-upper arm circumference is non-inferior to community health workers: results from a large-scale pragmatic trial in rural Niger. Arch Public Health. 2016;74:38. https://archpublichealth.biomedcentral.com/track/pdf/10.1186/s13690-016-0149-5?site=archpublichealth.biomedcentral.com
Briend A, Lacsala R, Prudhon C, Mounier B, Grellety Y, Golden MH. Ready-to-use therapeutic food for treatment of marasmus. Lancet. 1999;353:1767–8. http://www.thelancet.com/journals/lancet/article/PIIS0140-6736(99)01078-8/abstract
Collins S, Yates R. The need to update the classification of acute malnutrition. Lancet. 2003;362:249. http://www.thelancet.com/pdfs/journals/lancet/PIIS014067360313927X.pdf
Collins S, Dent N, Binns P, Bahwere P, Sadler K, Hallam A. Management of severe acute malnutrition in children. Lancet. 2006;368:1992–2000. http://www.sciencedirect.com/science/article/pii/S0140673606694439
Epicentre. Open review of coverage methodologies. 2015. http://www.coverage-monitoring.org/wp-content/uploads/2015/03/Open-Review-of-Coverage-Methodologies-Questions-Comments-and-Way-Forwards.pdf
WHO. Updates on the management of severe acute malnutrition in infants and children. 2013. http://www.who.int/nutrition/publications/guidelines/updates_management_SAM_infantandchildren/en/
Goossens S, Bekele Y, Yun O, Harczi G, Ouannes M, Shepherd S. Mid-upper arm circumference based nutrition programming: evidence for a new approach in regions with high burden of acute malnutrition. PLoS One. 2012;7:e49320. http://journals.plos.org/plosone/article?id=10.1371/journal.pone.0049320
John C, Ocheke IE, Diala U, Adah RO, Envuladu EA. Does mid upper arm circumference identify all acute malnourished 6-59 month old children, in field and clinical settings in Nigeria? South Afr J Clin Nutr. 2016:1–5. http://www.tandfonline.com/doi/abs/10.1080/16070658.2016.1255486
Manyike PC, Chinawa JM, Ubesie A, Obu HA, Odetunde OI, Chinawa AT. Prevalence of malnutrition among pre-school children in. South-east Niger Ital J Pediatr. 2014;40:75. https://www.ijponline.biomedcentral.com/articles/10.1186/s13052-014-0075-5
Gayle HD, Binkin NJ, Staehling NW, Trowbridge FL. Arm circumference v. Weight-for-height in nutritional assessment: are the findings comparable? J Trop Pediatr. 1988;34:213–7. https://www.academic.oup.com/tropej/article-abstract/34/5/213/1632459/Arm-Circumference-v-Weight-for-Height-in.
Ross DA, Taylor N, Hayes R, McLean M. Measuring malnutrition in famines: are weight-for-height and arm circumference interchangeable? Int J Epidemiol. 1990;19:636–45. https://www.academic.oup.com/ije/article-abstract/19/3/636/760605/Measuring-Malnutrition-in-Famines-Are-Weight-for
Bern C, Nathanail L. Is mid-upper-arm circumference a useful tool for screening in emergency settings? Lancet. 1995;345:631–3. http://www.sciencedirect.com/science/article/pii/S0140673695905278
Rees DG, Henry CJK, Diskett P, Shears P. Measures of nutritional status: survey of young children in north-East Brazil. Lancet. 1987;329:87–9. http://www.sciencedirect.com/science/article/pii/S0140673687919209
Hop LT, Gross R, Sastroamidjojo S, Giay T, Schultink W. Mid-upper-arm circumference development and its validity in assessment of undernutrition. Asia Pac J Clin Nutr. 1998;7:65–9. http://indianpediatrics.net/feb2016/166.pdf.
Tripathy JP, Sharma A, Prinja S. Is mid-upper arm circumference alone sufficient to identify severe acute malnutrition correctly. Indian Pediatr. 2016;53:166–7. http://indianpediatrics.net/feb2016/166.pdf
Roberfroid D, Huybregts L, Lachat C, Vrijens F, Kolsteren P, Guesdon B. Inconsistent diagnosis of acute malnutrition by weight-for-height and mid-upper arm circumference: contributors in 16 cross-sectional surveys from South Sudan, the Philippines, Chad, and Bangladesh. Nutr J. 2015;14:1. https://nutritionj.biomedcentral.com/articles/10.1186/s12937-015-0074-4
Dasgupta R, Sinha D, Jain SK, Prasad V. Screening for SAM in the community: is MUAC a simple tool? Indian Pediatr. 2013;50:154–5. http://link.springer.com/article/10.1007/s13312-013-0032-1
Fernandez MA, Delchevalerie P, Van HM. Accuracy of MUAC in the detection of severe wasting with the new WHO growth standards. Pediatrics. 2010;126:e195–201. http://citeseerx.ist.psu.edu/viewdoc/download?doi=10.1.1.919.6180&rep=rep1&type=pdf
Carter EP. Comparison of weight: height ratio and arm circumference in assessment of acute malnutrition. Arch Dis Child. 1987;62:833–5. https://adc.bmj.com/content/62/8/833.short.
Laillou A, Prak S, de Groot R, Whitney S, Conkle J, Horton L, et al. Optimal screening of children with acute malnutrition requires a change in current WHO guidelines as MUAC and WHZ identify different patient groups. PLoS ONE. 2014;9:e101159. https://bmcnutr.biomedcentral.com/articles/10.1186/s40795-016-0049-7
Grellety E, Krause LK, Shams EM, Porten K, Isanaka S. Comparison of weight-for-height and mid-upper arm circumference (MUAC) in a therapeutic feeding programme in South Sudan: is MUAC alone a sufficient criterion for admission of children at high risk of mortality? Public Health Nutr. 2015;18:2575–81. http://www.epicentre.msf.org/sites/preprod.epicentre.actency.fr/files/661_Comparison%20of%20weight-for-height.pdf
Talapalliwar MR, Garg BS. Diagnostic accuracy of mid-upper arm circumference (MUAC) for detection of severe and moderate acute malnutrition among tribal children in Central India. Int J Med Sci Public Health. 2016;5:1317–21. http://www.ejmanager.com/mnstemps/67/67-1441365239.pdf
Dukhi N, Sartorius B, Taylor M. Mid-upper arm circumference (MUAC) performance versus weight for height in south African children (0-59 months) with acute malnutrition. S Afr J Clin Nutr. 2017:1–6. http://www.tandfonline.com/doi/abs/10.1080/16070658.2016.1255483
Fiorentino M, Sophonneary P, Laillou A, Whitney S, de Groot R, Perignon M, et al. Current MUAC Cut-Offs to Screen for Acute Malnutrition Need to Be Adapted to Gender and Age: The Example of Cambodia. PLoS ONE. 2016;11:e0146442. http://journals.plos.org/plosone/article/file?id=10.1371/journal.pone.0146442&type=printable
Tadesse AW, Tadesse E, Berhane Y, Ekstrom EC. Comparison of mid-upper arm circumference and weight-for-height to diagnose severe acute malnutrition: a study in southern Ethiopia. Nutrients. 2017;9:267. http://www.mdpi.com/2072-6643/9/3/267/htm
Grellety E, Golden MH. Weight-for-height and mid-upper-arm circumference should be used independently to diagnose acute malnutrition: policy implications. BMC Nutr. 2016;2:10. https://bmcnutr.biomedcentral.com/articles/10.1186/s40795-016-0049-7
Briend A, Alvarez JL, Avril N, Bahwere P, Bailey J, Berkley JA, et al. Low mid-upper arm circumference identifies children with a high risk of death who should be the priority target for treatment. BMC Nutr. 2016;2:63. https://bmcnutr.biomedcentral.com/articles/10.1186/s40795-016-0101-7
Hammond W, Badawi AE, Deconinck H. Detecting severe acute malnutrition in children under five at scale. The Challenges of Anthropometry to Reach the Missed Millions Ann Nutr Disord & Ther. 2016;3:1030. http://austinpublishinggroup.com/nutritional-disorders/fulltext/andt-v3-id1030.php#Top
Garenne M, Maire B, Fontaine O, Briend A. Adequacy of child anthropometric indicators for measuring nutritional stress at population level: a study from Niakhar, Senegal. Public Health Nutr. 2013;16:1533–9. https://www.cambridge.org/core/services/aop-cambridge-core/content/view/S136898001200448X
Briend, A. Use of MUAC for severe acute malnutrition. CMAM forum 2012. http://citeseerx.ist.psu.edu/viewdoc/download?doi=10.1.1.662.303&rep=rep1&type=pdf
Taren D, de Pee S. The Spectrum of Malnutrition. In Nutrition and Health in a Developing World. Springer. 2017:91–117.
Deconinck H. Understanding pathways of integrating severe acute malnutrition interventions into national health systems in low-income countries. Doctoral dissertation. Université catholique de Louvain; 2017. https://dial.uclouvain.be/pr/boreal/object/boreal%3A183112/datastream/PDF_02/view
EN-Net. WFH versus MUAC. 2015. Emergency Nutrition Network. http://www.en-net.org/question/1915.aspx
EN-Net. Only MUAC for admission and discharge? 2015. Emergency Nutrition Network. http://www.en-net.org/question/1922.aspx
Briend A, Maire B, Fontaine O, Garenne M. Mid-upper arm circumference and weight-for-height to identify high-risk malnourished under-five children. Matern Child Nutr. 2012;8:130–3. http://onlinelibrary.wiley.com/doi/10.1111/j.1740-8709.2011.00340.x/full
Grellety E, Golden MH. Response to Briend et al "low mid-upper-arm-circumference identifies children with a high risk of death and should be the priority target for treatment". BMC Nutr. 2016;2-63:1–12. https://bmcnutr.biomedcentral.com/articles/10.1186/s40795-016-0101-7
WHO. Management of severe malnutrition: a manual for physicians and other senior health workers. World Health Organization; 1999. http://apps.who.int/iris/handle/10665/41999
Golden MH, Grellety Y. Integrated Management of Acute Malnutrition (IMAM) Generic Protocol ENGLISH version 6.6.2. 2011. https://doi.org/10.13140/RG.2.1.3511.1448
Concern Worldwide, FANTA, UNICEF and Valid International. Training Guide for Community-Based Management of Acute Malnutrition (CMAM). Washington, DC: FANTA FHI360; 2008. https://www.fantaproject.org/focus-areas/nutrition-emergencies-mam/cmam-training
Grellety Y. The management of severe malnutrition in Africa.Ph.D. University of Aberdeen; 2000. https://www.ennonline.net/managementsamafrica.
Erhardt J, Golden MH, Seaman J, Bilukha O. Software for emergency nutrition assessment (ENA for SMART). SMART 2011. http://smartmethodology.org/survey-planning-tools/smart-emergency-nutrition-assessment/
Marascuilo LA. Large-sample multiple comparisons. Psychol Bull. 1966;65:280.
Wagh ST, Razvi NA. Marascuilo method of multiple comparisons (an analytical study of caesarean section delivery). Int J Contemp Med Res. 2016;3:1137–40. https://www.ijcmr.com/uploads/7/7/4/6/77464738/_marascuilo_method_of_multiple_comparisons__an_analytical_study_of_caesarean_section_delivery___.pdf
Grellety E, Golden MH. Severely malnourished children with a low weight-for-height have a higher mortality than those with a low mid-upper-arm-circumference: II. Systematic literature review and meta-analysis. Nutr J. 2018. https://doi.org/10.1186/s12937-018-0383-5
Barendregt JJ, Doi SA. Meta XL. 5.32 [computer program]. EpiGear International Pty Ltd: Queensland, Australia; 2016. https://www.epigear.com/index_files/metaxl.html
Peto R. Why do we need systematic overviews of randomized trials? Stat Med. 1987;6:233–40. https://doi.org/10.1002/sim.4780060306.
The Sphere Project. Humanitarian Charter and Minimum Standards in Disaster Response, 2 edn. Geneva, Switzerland; 2011. http://www.sphereproject.org/resources/download-publications/?search=1&keywords=&language=English&type=0&category=22
Bogin B, Varela-Silva MI. Leg length, body proportion, and health: a review with a note on beauty. Int J Environ Res Public Health. 2010;7:1047–75. http://www.mdpi.com/1660-4601/7/3/1047/htm
Signorini A, De Filippo E, Panico S, De Caprio C, Pasanisi F, Contaldo F. Long-term mortality in anorexia nervosa: a report after an 8-year follow-up and a review of the most recent literature. Eur J Clin Nutr. 2007;61:119–22. http://www.nature.com/ejcn/journal/v61/n1/abs/1602491a.html
Van Den Broeck J, Eeckels R, Vuylsteke J. Influence of nutritional status on child mortality in rural Zaire. Lancet. 1993;341:1491–5. http://www.sciencedirect.com/science/article/pii/014067369390632Q
Lindskog U, Lindskog P, Carstensen J, Larsson Y, Gebre-Medhin M. Childhood mortality in relation to nutritional status and water supply--a prospective study from rural Malawi. Acta Paediatr Scand. 1988;77:260–8. http://www.ircwash.org/sites/default/files/203.1-88CH-18814.pdf.
Pelletier DL. The relationship between child anthropometry and mortality in developing countries: implications for policy, programs and future research. J Nutr. 1994;124:2047S–81S. https://sites.google.com/site/mfkdocsexternal/Home/articles/Childanthropometryandmortality_Pelletier_1994.pdf
Olofin I, McDonald CM, Ezzati M, Flaxman S, Black RE, Fawzi WW, et al. Associations of suboptimal growth with all-cause and cause-specific mortality in children under five years: a pooled analysis of ten prospective studies. PLoS One. 2013;8:e64636. http://journals.plos.org/plosone/article?id=10.1371/journal.pone.0064636
Acevedo P, Esteban MTG, Lopez-Ejeda N, Gomez A, Marrodan MD. Influence of malnutrition upon all-cause mortality among children in Swaziland. Endocrinologia, Diabetes y Nutricion 2017. https://doi.org/10.1016/j.endinu.2017.01.008
Fawzi WW, Herrera MG, Spiegelman DL, el Amin A, Nestel P, Mohamed KA. A prospective study of malnutrition in relation to child mortality in the Sudan. Am J Clin Nutr. 1997;65:1062–9. http://ajcn.nutrition.org/content/65/4/1062.short
Katz J, West KP, Tarwotjo I, Sommer A. The importance of age in evaluating anthropometric indices for predicting mortality. Am J Epidemiol. 1989;130:1219–26. https://doi.org/10.1093/oxfordjournals.aje.a115450
Lawrence M, Yimer T, O'Dea JK. Nutritional status and early warning of mortality in southern Ethiopia, 1988–1991. Eur J Clin Nutr. 1994;48:38–45. PM:8200328
McDonald CM, Olofin I, Flaxman S, Fawzi WW, Spiegelman D, Caulfield LE, et al. The effect of multiple anthropometric deficits on child mortality: meta-analysis of individual data in 10 prospective studies from developing countries. Am J Clin Nutr. 2013;97:896–901. http://ajcn.nutrition.org/content/97/4/896.full
Nieburg P, Person-Karell B, Toole MJ. Malnutrition-mortality relationships among refugees. J Refug Stud. 1992;5:247–56. https://academic.oup.com/jrs/article-abstract/5/3-4/247/1522998/Malnutrition-Mortality-Relationships-among
O'Neill SM, Fitzgerald A, Briend A, Van Den Broeck J. Child mortality as predicted by nutritional status and recent weight velocity in children under two in rural Africa. J Nutr. 2012;142:520–5. PM:22259194
Yambi O, Latham MC, Habicht JP, Haas JD. Nutrition status and the risk of mortality in children 6-36 months old in Tanzania. Food Nutr Bull. 1991;13:6.
Roberfroid D, Hammami NM, Lachat C, Prinzo ZW, Sibson V, Guesdon B, et al. Utilization of mid-upper arm circumference versus weight-for-height in nutritional rehabilitation programmes: a systematic review of evidence. Geneva: World Health Organization; 2013. www.who.int/entity/nutrition/publications/guidelines/updates_management_SAM_infantandchildren_review1.pdf?ua=1
Post CL, Victora CG. The low prevalence of weight-for-height deficits in Brazilian children is related to body proportions. J Nutr. 2001;131:1290–6. http://jn.nutrition.org/content/131/4/1290.full
Manuel HT. Physical Measurements of Mexican Children in American Schools 1934, 5: 237–252. http://www.jstor.org/stable/1125742
Tu YK, Gunnell D, Gilthorpe MS. Simpson's paradox, Lord's paradox, and suppression effects are the same phenomenon - the reversal paradox. Emerg Themes Epidemiol. 2008;5:2. https://ete-online.biomedcentral.com/articles/10.1186/1742-7622-5-2
Julious SA, Mullee MA. Confounding and Simpson's paradox. Br Med J. 1994;309:1480–1. https://www.bmj.com/content/309/6967/1480.full.pdf+html
Tu YK, Tilling K, Sterne JA, Gilthorpe MS. A critical evaluation of statistical approaches to examining the role of growth trajectories in the developmental origins of health and disease. Int J Epidemiol 2013, dyt157. http://citeseerx.ist.psu.edu/viewdoc/download?doi=10.1.1.923.9437&rep=rep1&type=pdf
Archie JP Jr. Mathematic coupling of data: a common source of error. Ann Surg. 1981;193:296. http://journals.lww.com/annalsofsurgery/abstract/1981/03000/mathematic_coupling_of_data__a_common_source_of.8.aspx
Tu YK, Maddick IH, Griffiths GS, Gilthorpe MS. Mathematical coupling can undermine the statistical assessment of clinical research: illustration from the treatment of guided tissue regeneration. J Dent. 32:133–42. https://doi.org/10.1016/j.jdent.2003.10.001
Berkley J, Mwangi I, Griffiths K, Ahmed I, Mithwani S, English M, et al. Assessment of severe malnutrition among hospitalized children in rural Kenya: comparison of weight for height and mid upper arm circumference. Jama. 2005;294:591–7. http://jamanetwork.com/journals/jama/fullarticle/201328
Chiabi A, Mbanga C, Mah E, Nguefack DF, Nguefack S, Fru F, et al. Weight-for-Height Z Score and Mid-Upper Arm Circumference as Predictors of Mortality in Children with Severe Acute Malnutrition. J Trop Pediatr. 2017;63:260–6.
Sachdeva S, Dewan P, Shah D, Malhotra RK, Gupta P. Mid-upper arm circumference v. weight-for-height Z-score for predicting mortality in hospitalized children under 5 years of age. Public Health Nutr. 2016:1–8. https://www.cambridge.org/core/services/aop-cambridge-core/content/view/S1368980016000719
Brasseur D, Hennart P, Dramaix M, Bahwere P, Donnen P, Tonglet R, et al. Biological risk factors for fatal protein energy malnutrition in hospitalized children in Zaire. J Pediatr Gastroenterol Nutr. 1994;18:220–4. http://journals.lww.com/jpgn/Abstract/1994/02000/Biological_Risk_Factors_for_Fatal_Protein_Energy.16.aspx
Van Den Broeck J, Meulemans W, Eeckels R. Nutritional assessment: the problem of clinical-anthropometrical mismatch. Eur J Clin Nutr. 1994;48:60–5. PM:8200330
Dramaix M, Hennart P, Brasseur D, Bahwere P, Mudjene O, Tonglet R, et al. Serum albumin concentration, arm circumference, and oedema and subsequent risk of dying in children in Central Africa. Br Med J. 1993;307:710–3. https://www.bmj.com/content/307/6906/710.abstract.
Dramaix M, Brasseur D, Donnen P, Bawhere P, Porignon D, Tonglet R, et al. Prognostic indices for mortality of hospitalized children in central Africa. Am J Epidemiol. 1996;143:1235–43. PM:8651222
Whiting P, Rutjes AW, Reitsma JB, Glas AS, Bossuyt PM, Kleijnen J. Sources of variation and bias in studies of diagnostic accuracy: a systematic review. Ann Intern Med. 2004;140:189–202. http://citeseerx.ist.psu.edu/viewdoc/download?doi=10.1.1.833.9748&rep=rep1&type=pdf#page=46
Coggon DIW, Martyn CN. Time and chance: the stochastic nature of disease causation. Lancet. 2005;365:1434. http://www.thelancet.com/pdfs/journals/lancet/PIIS0140673605663805.pdf
Cook NR. Use and misuse of the receiver operating characteristic curve in risk prediction. Circulation. 2007;115:928–35. http://citeseerx.ist.psu.edu/viewdoc/download?doi=10.1.1.324.758&rep=rep1&type=pdf
Cook NR. Statistical evaluation of prognostic versus diagnostic models: beyond the ROC curve. Clin Chem. 2008;54:17–23. http://citeseerx.ist.psu.edu/viewdoc/download?doi=10.1.1.325.269&rep=rep1&type=pdf
Lorent M, Giral M, Foucher Y. Net time-dependent ROC curves: a solution for evaluating the accuracy of a marker to predict disease-related mortality. Stat Med. 2014;33:2379–89. http://onlinelibrary.wiley.com/doi/10.1002/sim.6079/full
Pepe MS, Janes H, Longton G, Leisenring W, Newcomb P. Limitations of the odds ratio in gauging the performance of a diagnostic, prognostic, or screening marker. Am J Epidemiol. 2004;159:882–90. http://citeseerx.ist.psu.edu/viewdoc/download?doi=10.1.1.547.5511&rep=rep1&type=pdf
Van Calster B, Steyerberg EW, D'Agostino RB, Pencina MJ. Sensitivity and specificity can change in opposite directions when new predictive markers are added to risk models. Med Decis Mak. 2014;34:513–22. http://journals.sagepub.com/doi/abs/10.1177/0272989X13513654
Westover MB, Westover KD, Bianchi MT. Significance testing as perverse probabilistic reasoning. BMC Med. 2011;9:20. https://bmcmedicine.biomedcentral.com/articles/10.1186/1741-7015-9-20
Lapidus N, Luquero FJ, Gaboulaud VR, Shepherd S, Grais RF. Prognostic accuracy of WHO growth standards to predict mortality in a large-scale nutritional program in Niger. PLoS Med. 2009;6:e1000039. http://journals.plos.org/plosmedicine/article?id=10.1371/journal.pmed.1000039
Golden MH. Comment on WHZ and MUAC for diagnosis of severe malnutrition by Chiabi a et al. J Trop Pediatr 2017;0:1–2. doi: https://doi.org/10.1093/tropej/fmx008.
Heikens GT, Manary MJ, Trehan I. African children with severe pneumonia remain at high risk for death even after discharge. Paediatr Perinat Epidemiol. 2017; http://onlinelibrary.wiley.com/doi/10.1111/ppe.12350/full
WHO. Guideline: Updates on the management of severe acute malnutrition in infants and children. Geneva: World Health Organization; 2013. http://www.who.int/nutrition/publications/guidelines/updates_management_SAM_infantandchildren/en/
Piebson WR. Monophotogrammetric determination of body volume. Ergonomics. 1961;4:213–8. http://www.tandfonline.com/doi/abs/10.1080/00140136108930521
Wells JCK, Ruto A, Treleaven P. Whole-body three-dimensional photonic scanning: a new technique for obesity research and clinical practice. Int J Obes. 2008;32:232–8. http://www.nature.com/ijo/journal/v32/n2/abs/0803727a.html
Yu W. Development of a three-dimensional anthropometry system for human body composition assessment. The University of Texas at Austin; 2008. https://repositories.lib.utexas.edu/bitstream/handle/2152/17838/yuw.pdf%3Bjsessionid%3D61F89DE75AA927339A6A0909C615A7FE?sequence%3D2
Mikat RP. Chest, waist, and hip circumference estimations from stereo photographic digital topography. J Sports Med Phys Fitness. 2000;40:58.
Conkle J, Ramakrishnan U, Flores-Ayala R, Suchdev PS, Martorell R. Improving the quality of child anthropometry: manual anthropometry in the body imaging for nutritional assessment study (BINA). PLoS One. 2017;12(12):e0189332. http://journals.plos.org/plosone/article?id=10.1371/journal.pone.0189332
Acknowledgements
We would like to acknowledge Action Contre le Faim, Médecins Sans Frontières, Save the Children, Concern International, UNICEF and the National Governments of the countries from which we obtained data. We would also like to thank the following reviewers of the initial submission, Alan Jackson, Dominique Roberfroid and Geraldine Lo Siou for their very careful and useful comments; they have led to real improvement of our paper.
Funding
Nutriset provided a PhD fellowship to Université Libre de Bruxelles in support of EG. Nutriset had no role in any aspect of this research including data collection, design, analysis, interpretation or writing the article. MHG received no support.
Availability of data and materials
The datasets used and/or analysed during the current study are available from the corresponding author on reasonable request.
Author information
Authors and Affiliations
Contributions
EG & MHG were involved in all stages from the conception and design, data acquisition, analysis and interpretation. Both authors approved the final version of the article.
Corresponding author
Ethics declarations
Ethics approval and consent to participate
This is a secondary analysis of anonymous data which had been collected and analysed for programmatic purposes: that is, to audit services, compare the performance with the Sphere standards, identify were performance needed improvement and assess case-loads for future staff and product requirement planning. As no individual, location or administrative district could be identified no formal ethical clearance was required.
Consent for publication
Not applicable.
Competing interests
The authors declare that they have no competing interests.
Publisher’s Note
Springer Nature remains neutral with regard to jurisdictional claims in published maps and institutional affiliations.
Additional files
Additional file 1:
Table S1. Regional grouping of data from countries for meta-analysis. (DOCX 12 kb)
Additional file 2:
Table S2. Admission diagnostic criteria by country and admission facility. (DOCX 22 kb)
Additional file 3:
Table S3. Analysis of IPF and OTP patients combined. (DOCX 15 kb)
Additional file 4:
Table S4. Statistical data on the meta-analysis comparing WHZ-only vs MUAC-only by Region, oedema and treatment facility/program. (DOCX 14 kb)
Additional file 5:
Table S5. Sensitivity statistics for meta-analysis of WHZ-only vs MUAC-only, by oedema, Region and treatment facility/program. (DOCX 14 kb)
Rights and permissions
Open Access This article is distributed under the terms of the Creative Commons Attribution 4.0 International License (http://creativecommons.org/licenses/by/4.0/), which permits unrestricted use, distribution, and reproduction in any medium, provided you give appropriate credit to the original author(s) and the source, provide a link to the Creative Commons license, and indicate if changes were made. The Creative Commons Public Domain Dedication waiver (http://creativecommons.org/publicdomain/zero/1.0/) applies to the data made available in this article, unless otherwise stated.
About this article

Cite this article
Grellety, E., Golden, M.H. Severely malnourished children with a low weight-for-height have a higher mortality than those with a low mid-upper-arm-circumference: I. Empirical data demonstrates Simpson’s paradox. Nutr J 17, 79 (2018). https://doi.org/10.1186/s12937-018-0384-4
Received:
Accepted:
Published:
DOI: https://doi.org/10.1186/s12937-018-0384-4