- Research
- Open access
- Published:
An analysis of single image defogging methods using a color ellipsoid framework
EURASIP Journal on Image and Video Processing volume 2013, Article number: 37 (2013)
Abstract
Abstract
The goal of this article is to explain how several single image defogging methods work using a color ellipsoid framework. The foundation of the framework is the atmospheric dichromatic model which is analogous to the reflectance dichromatic model. A key step in single image defogging is the ability to estimate relative depth. Therefore, properties of the color ellipsoids are tied to depth cues within an image. This framework is then extended using a Gaussian mixture model to account for multiple mixtures which gives intuition in more complex observation windows, such as observations at depth discontinuities which is a common problem in single image defogging. A few single image defogging methods are analyzed within this framework and surprisingly tied together with a common approach in using a dark prior. A new single image defogging method based on the color ellipsoid framework is introduced and compared to existing methods.
1 Introduction
The phrase single image defogging is used to describe any method that removes atmospheric scattering (e.g., fog) from a single image. In general, the act of removing fog from an image increases the contrast. Thus, single image defogging is a special subset of contrast restoration techniques.
In this article, we refer to fog as the homogeneous scattering medium made up of molecules large enough to equally scatter all wavelengths as described in [1]. Thus, the fog we are referring to is evenly distributed and colorless.
The process of removing fog from an image (defogging) requires the knowledge on physical characteristics of the scene. One of these characteristics is the depth of the scene. This depth is measured from the camera sensor to the objects in the scene. If scene depth is known, then the problem of removing fog becomes much easier. Ideally, given a single image, two images are obtained: a scene depth image and a contrast restored image.
The essential problem that must be solved in most single image defogging methods is scene depth estimation. This is equivalent to converting a two-dimensional image to a three-dimensional image with only one image as the input. The approach to estimating the scene depth for the purpose of defogging is not trivial and requires prior knowledge such as depth cues from fog or atmospheric scattering.
The concept of depth from scattering is not new. It has been used by artists to convey depth to a viewer in their paintings as early as the renaissance [2]. The mathematical model of light propagating through a scattering medium and dependence on distance can be traced back to Beer-Lambert-Bouguer, then Koschmieder [3], Middleton [4], Duntley [5] and then McCartney [6]. The light attenuation is characterized as an exponential decaying term,
where at pixel location i, the transmission t i is a function of the scattering β i (λ) and distance d i . The term λ is the specific wavelength.
Even though depth from scattering is a well-known phenomenon, single image defogging is relatively new, and a growing number of methods exist. The first methods trying to achieve single image defogging were presented by Tan [7] and Fattal [8]. Both authors introduced unique methods that remove fog from a single image by inferring the transmission image or map. Soon afterwards, another unique method called the dark channel prior (DCP) by He et al. [9] supported the ability to infer a raw estimate of t using a single image with fog present. The DCP method has also influenced many more single image defogging methods (see [10–16]). Within the same time frame, Tarel and Hautière [17] introduced a fast single image defogging method that also estimates the transmission map.
In this article we address the question: Can existing single image defogging methods be unified with a common model? One key message is the existing methods estimate the transmission with a common prototype
where w is a scaling term, and θ is a ‘dark prior’. The DCP method by He et al. [9] was the first to explicitly use (2); however, we demonstrate that this is the prototype used also by other methods regardless of their approach. We find that the dark prior is dependent on properties from the proposed color ellipsoid framework. The following single image defogging methods are analyzed within the framework: Fattal [8], He et al. [9], Tarel and Hautière [17], and Gibson et al. [16].
The second key message in this article is that a new single image defogging method is proposed. This method is developed using a lemma from the color ellipsoid framework and also estimates the transmission with the same prototype in (2).
There are eight sections in this article including this section. Section 2 presents a detailed description of the atmospheric dichromatic model. Section 3 introduces the color ellipsoid framework. The framework is analyzed when fog is present, and our new defogging method is introduced in Section 4. We then unify four different single image defogging methods using the color ellipsoid model in Section 6. The discussion and conclusion are provided in Sections 7 and 8, respectively.
2 Atmospheric dichromatic model
For each color λ at pixel location i, the dichromatic atmospheric scattering model [18],
is commonly used in single image defogging methods for characterizing the intensity of a foggy pixel.
In comparison to the dichromatic reflectance model [19], the diffuse and specular surface reflections are analogous to the direct transmission, t i (λ)x i (λ), and atmospheric veiling, (1-t i (λ))a(λ), respectively. The atmospheric scattering causes the apparent radiance to have two chromatic artifacts caused by particles in the air that both attenuate direct transmission and add light induced by a diffuse light source.
For obtaining a defogged image, the goal is to estimate the p-channel color image using the dichromatic model (3). For most cases, p = 3 for color images. However, the problem with (3) is that it is under-constrained with one equation and four unknowns for each color channel. Note that there are two unknowns contained within the transmission, t(λ), in (1).
The first unknown is the desired defogged image x. The second unknown variable is the airlight color, . This is the color and intensity observed from a target when the distance is infinite. A good example is the color of the horizon on a foggy or hazy day.
The third and fourth unknowns are from the transmission introduced in (1). The transmission, , is the exponentially decaying function based on scattering, β i (λ), and distance d i .
The scattering β i (λ) is itself a function of particle size and wavelength. For foggy days, the scattering is color independent. On clear days with very little fog, the scattering coefficient becomes more dependent on wavelength. In [18], the scattering is assumed to be the same for all wavelengths and also homogeneous for scenes with thick fog down to dense haze [4]. In this article, we make the same assumption that β i (λ) = β for scenes with at least dense haze present, therefore t i (λ) = t i ∀ λ. The atmospheric dichromatic model is simplified to:
bringing the unknown count down to a total of two for gray scale or four for red-green-blue (RGB) color excluding estimating x. The transmission t is the first unknown and airlight a is the second unknown for gray scale. For color (p = 3), transmission t is one unknown and airlight a has three unknowns.
The single image defogging problem is composed of two estimations using only the input image : the first is to estimate the airlight a and the second to estimate the transmission t.
There exists several methods for estimating a [7, 9, 18]. In this article, we will assume that the airlight has been estimated accurately in order to focus the analysis on how transmission is estimated (with possible need for refinement). Therefore, the key problem in single image defogging is estimating transmission given a foggy image.
3 Color ellipsoid framework without fog
The general color ellipsoid model and its application to single image defogging was introduced by Gibson and Nguyen in [20] and [21]. This work will be reproduced here to facilitate the development of additional properties of the model in this article.
The motivation for approximating a color cluster with an ellipsoid is attributed to the color line model in [22] which is heavily dependent on the work from [23]. The color line model exploits the complex structure of RGB histograms in natural images. This line is actually an approximation of an elongated cluster where Omer and Werman [22] model the cluster with a skeleton and a 2D Gaussian neighborhood. Likewise, truncated cylinders are used in [23].
We continue the thought presented by Omer and Werman [22] that subsets of these clusters are ellipsoidal in shape. We accomplish this by instead generating an RGB histogram using color pixels sampled from a small window within the image.
Let us begin with modeling the observed apparent radiance at window Ω i with pixel location i as a three-dimensional random variable X i ,
Assume that the observed data within the sample window exhibits a normal density,
with and . The covariance matrix is decomposed as
with the eigenvalues in are sorted in decreasing order.
Given color pixels within window Ω i , we will define the color ellipsoid as
parameterized by the sample mean μ i and sample covariance Σ i . We will drop the parameters for clarity so that .
It is common to assume that the distribution of the color values sampled within Ω i is normally distributed or can be modeled with an ellipsoid. The distribution for the tristimulus values of color textures was assumed to be normally distributed by Tan [24]. Even though Devaux et al. [25] do not state that the sample points are normally distributed, they model the color textures with a three-dimensional ellipsoid using the Karhunen-Loeve transform. Kuo and Chang [26] sample the entire image and characterize the distribution as a mixture of Gaussians with K clusters.
In Figure 1, we illustrate the concept of approximating the cluster of points from a sample window Ω i . We have a clear day image with two sample windows located on a tree trunk and dirt road. The color points are plotted in Figure 1b. The densities from the data points are then estimated and plotted using two-dimensional histograms for each color plane: red-green, green-blue, and red-blue. The higher the frequency, the darker red the density points become.

Color ellipsoids in clear natural scene. (a) Clear day scene with a sample window over the tree trunk (white rectangle) and a window over the road (black rectangle). (b) RGB histogram plot of points from the two windows with their densities projected on each color plane. (c) The same RGB histogram plot only with the ellipsoid approximations for each region of interest (ROI). The green ellipsoid is from the tree trunk, and the red ellipsoid is from the dirt road.
In Figure 1c, we approximated color ellipsoids to each cluster using principal component analysis, where the sample mean and sample covariances were used. In Figure 1b,c, the upper cluster is from the road and the lower cluster is from the tree trunk. Approximating the RGB clusters with an ellipsoidal shape does well in characterizing the three-dimensional density of the cluster of points.
4 Color ellipsoid framework with fog
4.1 General properties
We derive in this section the constraints for color ellipsoids when fog is present. We first simplify the derivation by assuming that the surface of the radiant object within the sample window is flat with respect to the observation angle so that the transmission t i is the same within Ω i (t i = t).
If the apparent radiance of the same surface is subjected to fog, then it can be shown using (4) and (6) that the observed foggy patch is also normally distributed with attenuated variance and translated mean,
Note that the transmission is the same within the patch because it is assumed that the depth is flat.
The RGB histogram of the surface and a foggy version of the surface should exhibit two main differences. The first is that the RGB cluster will translate along the convex set between μ i and a according to (10). Second, with 0≤t i ≤ 1, the size of the cluster will become smaller when fog is present according to (11). In this article, we present the following new lemmas.
Lemma 1.
The transmission t of any scene with fog in the atmosphere β > 0 has the inequality
Proof.
Let β > 0 since the scene is viewed within the fog. Then, t = e - βd = 1 holds if and only if d = 0. However in real world images, the distance to the camera is never zero (d > 0), therefore 0 ≤ t < 1. □
Lemma 2.
Define the clear day color ellipsoid as
and the foggy day color ellipsoid as
If the parameters μ and are formed according to (10), and , then the centroid of is closer to the origin than the centroid of .
Proof.
Let us begin with a reasonable assumption that the airlight is the brightest color in the image,
The centroid of the foggy day color ellipsoid is within the convex set in (10) such that when t = 0, μ = a, and when t = 1, μ = x. Similarly,
However, Lemma 1 strictly excludes the point ; therefore
□
Lemma 3.
The volume of the color ellipsoid is larger than the foggy color ellipsoid .
Proof.
Using (11) and denoting det as the determinant, the ellipsoid volumes are
Given Lemma 1, 0 ≤ t < 1, we then have the relationship
□
We demonstrate Lemmas 2 and 3 with a real-world foggy day image set. In Figure 2, there are three images of the same tree on a foggy day at three different distances. A sample window Ω i is located on the same tree branch in each image. For each Ω i , the densities are plotted in Figure 2d. Note that the densities are ellipsoidal in shape. Also, for the tree branch positioned closer to the camera, the ellipsoid is larger in size and positioned closer to the RGB cube origin (Ω 3). For the tree branch positioned farthest away (Ω 1), the ellipsoid is smaller in size and positioned farther away from the RGB origin.

Color ellipsoids in foggy natural scene. (a to c) Images of the tree branch in the fog at three different distances with sample windows overlaid on the same branch in each image. (d) RGB histogram of each sample set.
4.2 Color ellipsoid model with depth discontinuity
We have assumed in the previous section that the transmission within a sample window is constant. However, this is not always true. For example, the sample window may be centered on a depth discontinuity (e.g., edge of a building).
If depth discontinuities are not accounted for in transmission estimation, then undesired artifacts will be present in the contrast restored image. These artifacts are discussed in more detail in [9, 16, 17]. In summary, these artifacts appear to look like a halo at a depth edge.
To account for the possibility that the sample window is over a depth discontinuity, we characterize the pixels observed within Ω as a Gaussian mixture model [27]. The sample window may cover K different types of objects. This yields K clusters in the RGB histogram.
Let the gth random mixture variable at pixel location i be the summation of disjoint sub-windows of Ω i ,
and the total mixture distribution become
The parameter vector is a culmination of the K Gaussian mean and covariance parameters defined by Equations 10 and 11, respectively. The mixture weight π i,g is |Ω i,g |/|Ω i | with .
An example of the presence of multiple mixtures within Ω is shown in Figure 3. The sample window is centered on a region with leaves close to the camera and leaves on a tree branch farther away. Even though the plot of the color pixels appear to be one elongated cluster, the existence of two mixtures is evident in the density plots with two distinct dark red regions on each color plane in Figure 3b.

Example of color ellipsoid with depth discontinuity. (a) Foggy image with ROI centered at a depth discontinuity. (b) RGB histogram of the ROI. Note the presence of two density mixtures.
Similar to the example in Figure 3, let the sample window be small enough to only contain two mixtures (K = 2). Denoting the mixtures with subscripts 1 and 2, and using (10) and (11), the overall sample mean is
which is the weighted average between the two mixtures. The sample covariance,
has a shape influenced by the mixture weights.
Let us simplify even more by assuming that Ω is at an extreme depth discontinuity where one of the depths is at infinity or t = 0. With t 1 > t 2 = 0, the sample mean and covariance become
respectively. Instead of the transmission influencing the position of the ellipsoid, the mixture weight also has influence on the sample mean. Therefore, the problem of ambiguity exists because of the combination of the mixture weight and transmission π 1 t 1. In order to use the sample mean to estimate the transmission value, the mixture weight must be considered.
5 Proposed ellipsoid prior method
Part of our key message in unifying existing defogging methods is that the transmission can be estimated using parameters from . As an introduction to this unification, we will use Lemma 2 to derive a new unique dark prior.
The principal question to address is how can we infer transmission given the observed color ellipsoid . Suppose we use only Lemma 2 to create a cost function such that . A cost function can be created in order to minimize the defogged centroid magnitude ,
where the defogged estimate is
Minimizing is simply trying to make the image darker on average. The cost function is minimized when
Similar to the nomenclature in [9], let the centroid prior, θ C , be the dark prior using Lemma 2.
The transmission estimate must account for depth discontinuities. One method to acquire the sample mean with respect to the mixture weights is to use the median operator. The median operator is used for this purpose by Gibson et al. [16] and Tarel and Hautière [17]. In the same fashion, the centroid prior, θ C (26), can be modified to use the median operator so that depth discontinuities can be considered. We include the median operator when acquiring the centroid of the ellipsoid with
where c is the color channel.
An example of the improvement when using the median operator is in Figure 4. The tree in the foreground poses a dramatic depth discontinuity and is evident with the halo around the edge in Figure 4b. The halo is diminished using the median operator in Figure 4c. From this point on, we drop the subscripts m and i (θ C,m,i = θ C ) for clarity but still imply the median operator is used.

Example of the halo effect. (a) Original image. (b) Enhanced image using centroid prior with simple averaging. (c) Enhancement of using centroid prior with median operator. Note the halo around the tree in the foreground in (b) is not present in (c)
The defogged image, , is then estimated with
with t 0 set to a low value for numerical conditioning (t 0 = 0.001) (see the work by [9] for the recovery method and [17] for additional gamma corrections). For generating the defogged image using the centroid prior, , a gamma value of 1/2 was used for the examples in this article, e.g., . The complete algorithm for the ellipsoid prior defogging method is in Algorithm 5.
Algorithm 1 The ellipsoid prior defogging algorithm.
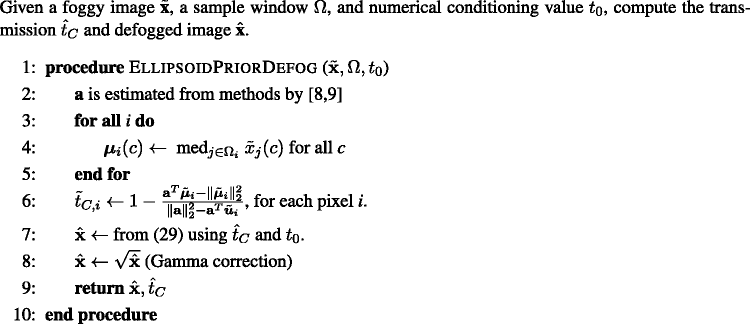
In Figure 5, we compare existing single image defogging methods with the centroid prior using a house image provided by Fattal [8]. The defogged image using has richer color because the cost function, , tries to minimize the magnitude of while being constrained to the atmospheric dichromatic model.

The transmission estimate in (26) is of the same prototype form in (2). Deriving a transmission estimate based on Lemma 2 results in creating a centroid prior that is a function of the ellipsoid parameters. In Section 6, we will show that other single image defogging methods also use the prototype in (2) where a dark prior is used. We will also show that the dark prior is a function of the color ellipsoid properties.
6 Unification of single image defogging methods
The color ellipsoid framework will now be used to analyze how four single image defogging methods (Fattal [8], He [9], Gibson [16], and Tarel [17]) estimate the transmission using properties of the color ellipsoids.
6.1 Dark channel prior
In [20], the dark channel prior (DCP) method [9] was explained using a minimum volume ellipsoid which we will reproduce here for completeness.
In order to estimate the transmission, the DCP was used which is a statistical operator,
The transmission was then estimated by a linear operation on the prior,
with w = 0.95 for most scenes. This DCP transmission estimate in (31) is of the same form as (2).
It was observed by He et al. [9] through an experiment that the DCP of non-foggy outdoor natural scenes had 90% of the pixels below a tenth of the maximum possible value, hence the dark nomenclature in DCP. The is constructed in such a way that it assumes there is a pixel within the sample region centered at i that originally was black. This is a strong assumption, and there must be more to why this initial estimate works.
He et al. [9] stated that ‘the intensity of the dark channel is a rough approximation of the thickness of the fog.’ This can be understood when the DCP is considered as an approximation of a minimum distance measure to the Löwner-John ellipsoid [20] either from the R-G, G-B, or R-B planes,
with equivalence when z c ∈ Ω i since a point from the set Ω i is selected instead of the estimated shell of the ellipsoid.
The unit vector e c represents the normal to one of the three color planes within the RGB cube. The matrix parameter A is from the Löwner-John ellipsoid, or minimum volume ellipsoid, that encapsulates the cluster from Ω i ,
An illustration of the relationship between the DCP and the minimum volume ellipsoid is in Figure 6. The example is on the R-G plane and demonstrates how the DCP measures the minimum distance from either the red or green axis which is dependent on the position, size, and orientation of the ellipsoid. What was not addressed in [20] was that the DCP is able to estimate transmission (with the need for refinements) because it utilizes Lemma 2 and Lemma 3.

DCP and color ellipsoid relationship. Graphical example of the relationship between the DCP and the minimum distance to three different minimum volume ellipsoids on the red-green plane.
However, the DCP is not a function of the mixture weights such that depth discontinuities are accounted for. This results in halo artifacts when trying to recover a defogged image as discussed in Section 4.2. In [9], a soft matting algorithm by Levin et al. [28] was applied to to refine the transmission image, . The alpha matting of an image at pixel i is a function of foreground and background mixtures,
Being similar with the atmospheric dichromatic model (4) and the alpha matting (34), the transmission can be treated as an alpha matting [9],
The transmission vector (canonically stacked by columns) is smoothed into by minimizing the cost function
The right hand side of (36) was chosen by He et al. [9] to regularize the matting based on the DCP and to enforce smoothing weighted by λ.
The derivation of the Laplacian matrix, L, by Levin et al. [28] is also based on the color line model and hence a function of the color ellipsoid properties. The Laplacian matrix is [28]
and D and I 3 × 3 in (38) is influenced by the properties of the color ellipsoid (μ k and Σ k ) within the window Ω k . The ability of preserving depth discontinuity edges is afforded by the affinity matrix, W, which is effective in preserving edges and discontinuities because of its locally adaptive nature [28].
The DCP method estimates the transmission with the prototype in (2), just like the centroid prior. Additionally, the properties of the color ellipsoids play a key role in the DCP for initial estimation and Laplacian matting for refinement.
6.2 Fattal prior
The single image defogging method by Fattal [8] is a unique method that at first does not appear to be using the prototype in (2). However, we show that Fattal’s method does indeed indirectly develop a dark prior and estimates the transmission with the same prototype in (2).
Fattal developed a way to create a raw estimate of the transmission and then employed a refinement step to improve the transmission estimate. We will first investigate how the raw transmission estimate is constructed.
Fattal [8] split the observed color X i into a shade l i and albedo r i product,
with x i = l i r i . The observation made by Fattal was that the sample covariance of the shading and transmission should be statistically uncorrelated over a patch Ω,
when the albedo r is constant.
The airlight vector is used to create a subspace so that the observed color pixel is split into two components. The first is the color projected onto the airlight vector
and the second is the residual which is the observed color pixel projected on the color vector perpendicular to a (a⊥)
with ||a|| = ||a⊥|| and 〈a,a⊥ 〉 = 0.
Using the statistically uncorrelated relationship in (40) and assuming the albedo r is constant, Fattal constructs the raw transmission estimate as (dropping i for clarity)
The term is the residual albedo projected onto a⊥.
The estimate also uses the prototype in (2) to estimate the transmission. Looking at the right hand side of the raw transmission (43) (reintroducing subscript i),
we see yet another prior, the Fattal prior θ F . The Fattal prior should behave similar to the DCP (θ D ) and centroid prior (θ C ) since it is also used to estimate the transmission. The term θ F should match the intuition that it becomes darker (close to zero) when radiant objects are closer to the camera when fog is present.
The Fattal prior utilizes Lemma 2. Note that in (4) as the transmission increases, t → 1, the foggy pixel moves farther away from the airlight vector, a, while staying on the convex set . This causes more energy to go to the residual, , and less to x a . Therefore, according to (46), the Fattal prior decreases or becomes darker, θ F → 0, as the transmission increases regardless of the value of η.
The Fattal prior also utilizes Lemma 3. To observe this, we analyze the weight factor, η, in (46) which is a measure of ambiguity. It increases as the albedo color becomes parallel with the airlight or becomes more ambiguous. A low η value means that it is not known whether the pixel is covered by fog or if it is truly the same color as the airlight, but not covered by fog.
The albedo is not known; therefore, the ambiguity weighting is measured by sampling values within a window Ω such that the decorrelation in (40) is satisfied,
Since η is measured using a sample region Ω, we employ the color ellipsoid framework to show that the θ F is dependent on the color ellipsoid.
In order to find more intuition of η and its relationship with the color ellipsoid, let the distribution of from patch Ω be Gaussian with centroid μ. Dropping Ω and i for clarity, η becomes
where is the centroid of the color ellipsoid projected onto the airlight vector, and μ h is the local average of h,
We can rearrange (48) by approximating with Jensen’s inequality (f(E[X]) ≤ E[f(X)]). The ambiguity weight factor η (48) has a lower bound expressed as
with
Let the variance of the observed colors projected onto the airlight vector (41) be
Using (52) in (50), the inequality becomes
with k 2 = ||a||k 1. To view the influence of the color ellipsoid shape, we simplify (53) into
As η increases, the transmission estimate has an increasing influence from the residual color . The variance along the airlight vector is the color ellipsoid projected onto the airlight vector,
The shape of the color ellipsoid is utilized to influence the ambiguity weight η. For example, consider the two ellipsoids in Figure 7, labeled and . The ellipsoids are positioned such that they both have the same . However, their orientation and shape are different. has a very small variance projected onto a, σ a,1, compared to the variance for , σ a,2. The η term for is increased which effectively increases the transmission estimate. On the contrary, ellipsoid has a very large variance projected onto a which produces a lower η value. Due to the shape and orientations, the transmission estimate for the color ellipsoid is higher compared to the transmission estimated for the color ellipsoid . We then have the relationship t 2 < t 1 for the example in Figure 7.

Geometric interpretation of Equation 46. The figure contains two ellipsoids and with centroids and , respectively. The projection of the centroids onto the airlight vector a are the same for both ellipsoids.
The raw transmission estimate, , is not complete because several pixels are ignored due to potential division by zero in Equation 47. Since the mixture weights π are not considered, depth discontinuities are not accounted for and will produce incorrect estimations. As a refinement step, Fattal uses a Gauss-Markov random field model by maximizing
where is the refinement of , and are the pixels in that are good. The transmission variance σ t is discussed in detail in [8] and is measured based on the noise in the image. The smoothing is controlled by the variance value .
The statistical prior on the right hand side of (57) not only enforces smoothness but also that the variation in the edges in transmission matches the edges in the original image projected onto airlight. Therefore, if there is a depth discontinuity, the variation will be large in enforcing to preserve depth discontinuity edges.
6.3 Tarel prior
In this section, we will explore the single image fog removal method presented by Tarel and Hautière [17] and relate their intuition with the properties of the color ellipsoids for foggy images. For this analysis, we will make the same assumption that Tarel makes where the foggy image, , has been white balanced such that the airlight component is pure white, a = (1,1,1)T.
Instead of directly estimating the transmission, Tarel and Hautière [17] chose to infer the atmospheric veiling,
(with a s = 1) which is a linear function of the transmission. Similar to the DCP, we call this term, θ T , the Tarel prior. We show that this prior is also dependent on the color ellipsoid properties.
Tarel first employs an ‘image of whiteness,’
The intuition in using the image whiteness is similar to the first step used in He’s method to obtain the DCP (30). The set of values w i within Ω i are the minimum distances from the points in the RGB cluster to either the R-G, G-B, or R-B planes. The atmospheric veiling is estimated by measuring the local average of w, μ w , and subtracting it from the local standard deviation of w, σ w .
6.3.1 Analysis without median operator
For calculating local averages, Tarel does account for depth discontinuities using a median operator. First, let us consider the simple form to see how the Tarel prior uses the color ellipsoid properties. Tarel uses the local mean and standard deviation of the image of whiteness within the patch Ω i ,
As we have done in previous sections, we will again assume that the transmission within the patch Ω is constant. The local mean at Ω i , , can then be expanded using (4),
where we assume just as Tarel does that the airlight is pure white with a magnitude 1 for each color channel. If the color in the patch is pure white, μ w,i becomes 1, hence the name image of whiteness. Moreover, if the color within Ω i at least has one color component that is zero, then the local mean is only dependent on the atmospheric veiling, μ w,i = 1 - t.
Suppose the original cluster of points (no fog) had a local average of μ i . Depending on the orientation of the color cluster, we may approximate the scalar μ w by taking the minimum component of the color ellipsoid centroid,
where is the foggy centroid of the color cluster defined in (10). This approximation is illustrated in Figure 8.

Tarel prior and color ellipsoid relationship. Graphical example of the relationship between the image whiteness and color ellipsoids on the red-green plane. Examples of ellipsoid positions and orientations that are well approximated with measuring the minimum color component of the respective centroid are the clusters with dark ellipses. The dashed blue ellipse is an example of a cluster orientation where the approximation is not valid.
Using the approximation with (63), it can be shown that θ T is dependent on the position and shape of the color ellipsoid. There are four different clusters in Figure 8 that exist from different sample patches, where three of the clusters have the true μ w,i indicated with them. One can see that these local averages of the image whiteness for each cluster are essentially the minimum component value for the cluster centroid given that the orientation of the cluster is aligned to the gray color line. Assuming that the orientation is along the gray color line is not too strong of an assumption since the image itself has been white-balanced and the dominant orientation is also along the gray color line due to shading or airlight influence. The fourth cluster, indicated with a dashed blue ellipse, is an example where this approximation is not valid due to the position and orientation of the cluster points.
Up to this point, the Tarel prior θ T is not a function of the mixture weights within the sample patch Ω i and thus will cause undesirable halo artifacts when removing fog from the image.
6.3.2 Analysis with median operator
To account for estimating properly near depth discontinuities, Tarel and Hautière [17] chose the median operator because of its edge-preserving properties in order to estimate the atmospheric veiling
The sample patch Ω i is chosen to be large (41×41) to enforce θ T to be smooth. Likewise, since the median operator works well with edge preservation [17], the edges are considered limiting halo artifacts from being present.
We will show how the Gaussian mixture weights, π g , presented in Section 4.2 are considered in the Tarel prior estimate θ T (64). Let us assume that the occlusion boundary parameters from the mixture model in Section 4.2 are deterministic but unknown and apply the min operator to each and define the values for foreground (mixture 1) as
and background (mixture 2)
with the foreground image of whiteness being strictly less than the foreground image of whiteness w i,1 < w i,2. When two distinct mixtures exist due to a depth discontinuity, θ T can be simplified to
with |Ω i | odd. In addition to θ T being dependent on the size and position of the color ellipsoid from the sample patch Ω i , we also show in (67) that the mixture weights are employed by Tarel to infer the atmospheric veiling.
A variation on the DCP was presented in [16], called the median DCP (MDCP),
This is essentially a hybrid of both the DCP θ D and the Tarel prior θ T because of the use of the median operator. In the same fashion as the previous analysis for the DCP and Tarel priors, the MDCP is also a function of the color ellipsoid properties. It also accounts for depth discontinuities by being dependent on the mixture weights π g .
7 Discussion
We have found that we can unify single image defogging methods. The unification is that all of these single image defogging methods use the prototype in (2) to estimate transmission using a dark prior. Additionally, each of these dark priors use properties of the color ellipsoids with respect to Lemmas 2 and 3.
We summarize the unification of the single image defogging methods in Table 1 by providing the equation used to measure the dark prior. The refinement step taken by each single image defogging method is also provided in Table 1.
We have discovered that the color ellipsoid framework effectively exposes how the single image defogging methods estimate the transmission when the atmospheric dichromatic model is used mathematically and empirically. Another discovery was that a new dark prior method was created using Lemma 2. A cost function was designed to minimize the average centroid position while staying within the atmospheric dichromatic model. The color ellipsoid framework was the key in the development of this new method. More results can be seen in Figure 9.

Additional examples of single image defogging methods. (a) Original house image from [8], . (b to f) Defogged images using Lemma 2, He et al. [9], Fattal [8], Tarel and Hautière [17], and Gibson and Nguyen [21], respectively. (g to k) Transmission estimates used for the above defogged images. Similarly, (l) is a original foggy image of pumpkins [8]. (m to q) Defog results. (r to v) Transmission estimates.
8 Conclusion
The development of the color ellipsoid framework is a contribution to the field of work in single image defogging because it brings a richer understanding to the problem of estimating the transmission. This article provides the tools necessary to clearly understand how transmission is estimated from a single foggy day image. We have introduced a new method that is visually more aggressive in removing fog which affords an image that is richer in color.
Future work will include the color ellipsoid framework in the development of a contrast enhancement metric. Additionally, the ambiguity problem when estimating the transmission will be addressed using the orientation of the color ellipsoid to develop a more accurate transmission mapping with respect to the depth of the scene.
We present a new way to model single image defogging methods using a color ellipsoid framework. Our discoveries are as follows:
-
We have discovered how depth cues from fog can be inferred using the color ellipsoid framework.
-
We unify single image defogging methods using the color ellipsoid framework.
-
A Gaussian mixture model is crucial to represent depth discontinuities which is a common issue in removing fog in natural scenes.
-
We discover that the ambiguity in measuring depth from fog is associated with the color ellipsoid orientation and shape.
-
A new defogging method is presented which is effective in contrast enhancement and based on the color ellipsoid properties.
This article is a contribution to the image processing community by providing strong intuition in single image defogging, particularly estimating depth from fog. This is useful in contrast enhancement, surveillance, tracking, and robotic applications.
References
Narasimhan SG, Nayar SK: Contrast restoration of weather degraded images. IEEE Trans. Pattern. Anal. Mach. Intell 2003, 25(6):713-724. 10.1109/TPAMI.2003.1201821
Summers D: Contrapposto: style and meaning in renaissance art. Art Bull 1977, 59(3):336-361. 10.2307/3049668
Koschmieder H: Luftlicht und Sichtweite. Naturwissenschaften 1938, 26(32):521-528. 10.1007/BF01774261
Middleton WEK: Vision Through the Atmosphere. Ontario: University of Toronto Press; 1952.
Duntley SQ, Boileau AR, Preisendorfer RW: Image transmission by the troposphere I. JOSA 1957, 47(6):499-506. 10.1364/JOSA.47.000499
McCartney EJ: Optics of the Atmosphere: Scattering by Molecules and Particles. New York: Wiley; 1976.
Tan RT: Visibility in bad weather from a single image, 2008. In IEEE Conference on Computer Vision and Pattern Recognition. Piscataway: IEEE; 2008:1-8.
Fattal R: Single image dehazing. ACM Trans. Graph 2008, 27: 72.
He K, Sun J, Tang X: Single image haze removal using dark channel prior, 2009. In IEEE Conference on Computer Vision and Pattern Recognition. Piscataway: IEEE; 2009:1956-1963.
Kratz L, Nishino K: Factorizing scene albedo and depth from a single foggy image, 2009. In IEEE 12th International Conference on Computer Vision. Piscataway: IEEE; 2009:1701-1708.
Fang F, Li F, Yang X, Shen C, Zhang G: Single image dehazing and denoising with variational method, 2010. In International Conference on Image Analysis and Signal Processing (IASP). Piscataway: IEEE; 2010:219-222.
Chao L, Wang M: Removal of water scattering. IEEE Comput. Eng. Technol. (ICCET) 2010, 2: V2—35.
Yoon I, Jeon J, Lee J, Paik J: Weighted image defogging method using statistical RGB channel feature extraction, 2010. In International SoC Design Conference (ISOCC). Piscataway: IEEE; 2010:34-35.
Yu J, Xiao C, Li D: Physics-based fast single image fog removal. In IEEE International Conference on Signal Processing (ICSP’10). Piscataway: IEEE; 2010:1048-1052.
Zou C, Chen J: Recovering depth from a single image using dark channel prior. In 11th ACIS International Conference on Software Engineering, Artificial Intelligence Networking and Parallel/Distributed Computing (SNPD 2010). Piscataway: IEEE; 2010:93-96.
Gibson KB, Vo DT, Nguyen TQ: An investigation of dehazing effects on image and video coding. IEEE Trans. Image Process 2012, 21(2):662-673.
Tarel JP, Hautière N: Fast visibility restoration from a single color or gray level image, 2009. In IEEE 12th International Conference on Computer Vision. Piscataway: IEEE; 2009:2201-2208.
Narasimhan SG, Nayar SK: Vision and the atmosphere. Int. J. Comput. Vis 2002, 48(3):233-254. 10.1023/A:1016328200723
Shafer SA: Using color to separate reflection components. Color Res. Appl 1985, 10(4):210-218. 10.1002/col.5080100409
Gibson KB, Nguyen TQ: On the effectiveness of the dark channel prior for single image dehazing by approximating with minimum volume ellipsoids. In IEEE International Conference on Acoustics, Speech and Signal Processing, 2011 (ICASSP). Piscataway: IEEE; 2011:1253-1256.
Gibson KB, Nguyen TQ: Hazy image modeling using color ellipsoids, 2011. In 18th IEEE International Conference on Image Processing (ICIP). Piscataway: IEEE; 2011:1861-1864.
Omer I, Werman M: Color lines: image specific color representation. Proc. 2004 IEEE Comput. Soc. Conf. Comput. Vis. Pattern Recognit 2004, 2: II-946.
Klinker GJ, Shafer SA, Kanade T: A physical approach to color image understanding. Int. J. Comput. Vis 1990, 4: 7-38. 10.1007/BF00137441
Tan T, Kittler J: Colour texture analysis using colour histogram. IEEE Proc. Vis., Image Signal Process 1994, 141: 403-412. 10.1049/ip-vis:19941420
Devaux J, Gouton P, Truchetet F: Karhunen-Loeve transform applied to region-based segmentation of color aerial images. Opt. Eng 2001, 40(7):1302-1308. 10.1117/1.1385166
Kuo WJ, Chang RF: Approximating the statistical distribution of color histogram for content-based image retrieval. Proc. 2000 IEEE Int. Conf. Acoustics, Speech, Signal Process. ICASSP’00 2000, 6: 2007-2010.
Dharanipragada S, Visweswariah K: Gaussian mixture models with covariances or precisions in shared multiple subspaces. Audio, Speech, Lang. Proc. IEEE Trans 2006, 14(4):1255-1266.
Levin A, Lischinski D, Weiss Y: A closed-form solution to natural image matting. IEEE Trans. Pattern Anal. Mach. Intell 2008, 30(2):228-242.
Acknowledgments
This work is supported in part by the Space and Naval Warfare Systems Center Pacific (SSC Pacific) and by NSF under grant CCF-1065305.
Author information
Authors and Affiliations
Corresponding author
Additional information
Competing interests
Both authors declare that they have no competing interests.
Authors’ original submitted files for images
Below are the links to the authors’ original submitted files for images.
Rights and permissions
Open Access This article is distributed under the terms of the Creative Commons Attribution 2.0 International License (https://creativecommons.org/licenses/by/2.0), which permits unrestricted use, distribution, and reproduction in any medium, provided the original work is properly cited.
About this article
Cite this article
Gibson, K.B., Nguyen, T.Q. An analysis of single image defogging methods using a color ellipsoid framework. J Image Video Proc 2013, 37 (2013). https://doi.org/10.1186/1687-5281-2013-37
Received:
Accepted:
Published:
DOI: https://doi.org/10.1186/1687-5281-2013-37