

Abstract
Background: The investigation of multimorbidity and aging is complex and highly intertwined with aging-related changes in physical and cognitive capabilities, and mental health and is known to affect psychological distress and quality of life. Under these circumstances it is important to understand how the effects of chronic conditions evolve over time relative to aging-related and end-of-life changes. The identification of periods in time where multimorbidity impacts particular outcomes such as depressive symptoms, versus periods of time where this is not the case, reduces the complexity of the phenomenon. Objective: We present the Johnson-Neyman (J-N) technique in the context of a curvilinear longitudinal model with higher-order terms to probe moderators and to identify regions of statistical significance. In essence, the J-N technique allows one to identify conditions under which moderators impact an outcome from conditions where these effects are not significant. Methods: To illustrate the use of the J-N technique in a longitudinal sample, we used data from the Health and Retirement Study. Analyses were based on time-to-death models including participants who died within the study duration of 12 years. Results: Multimorbidity differentially affects rates of change in depression. For some periods in time the effects are statistically significant while in other periods the same effects are not statistically different from zero. Conclusion: The J-N technique is useful to continuously probe moderating effects and to identify particular interactions with the model for time when certain effects are or are not statistically significant. In the context of multimorbidity this method is particularly useful for interpreting the complex interactions with differential change over time.
Introduction
In the presence of multiple chronic conditions it is important to know whether and how these conditions interact among each other and modify the effects of aging-related changes in physical and cognitive capabilities and mental health. Multimorbidity is a complex phenomenon in itself as it acknowledges the presence or co-occurrence of diseases in the same person [1]. The prevalence of multimorbidity increases throughout the adult life span and is common among older adults. In the general population over the age of 65 years approximately 65% report at least 1 and approximately 50% report 2 or more medical conditions [2,3]. In the context of family medicine the prevalence of multimorbidity for this age group rises to 97%, with an average of 7 chronic health problems. Recently, Fortin et al. [2] have found that the presence of psychological distress increased with the severity of multimorbidity. Also, in a large sample of primary care patients, Gunn et al. [4] report that the number of chronic physical problems is associated with an increase in depressive symptoms. In addition, higher levels of psychological distress were associated with lower adherence to medical treatments. Similarly, van den Akker et al. [3] speculated that psychological factors serve both as cause and consequence of multimorbidity. Recent reports of the association of multimorbidity with depressive symptoms and depression diagnosis found that depression in multimorbid older adults is underdiagnosed and undertreated [5]. These reports suggest that multimorbidity is not only a medical problem but also has psychological implications as it affects quality of life in terms of well-being (psychological distress) and may be underdiagnosed and undertreated in older adults with chronic diseases. Multimorbidity is associated with other negative consequences such as disability, functional decline and poor life quality and related to higher overall health care costs [6].
Effects of particular medical conditions, or the interaction among multiple conditions, may exhibit differential impacts on cognitive, physical and mental health outcomes at different points in time (e.g. relative to end of life). Multimorbidity creates a challenging situation, not only from a treatment perspective but also from a methodological perspective. Multimorbidity is complex as there are many components, including the severity of distinct medical conditions and related treatment [7], that impact each other differently - to different degrees in different circumstances.
The approach of identifying relevant and statistically significant conditions in changing contexts has a methodological match. The Johnson-Neyman (J-N) technique [8] identifies regions of significance of covariates in ANCOVA for nonparallel regression lines. Originally, it was developed to determine the significance of the difference between two groups on one variable while holding constant two other variables. Over the past decades the J-N technique has been sporadically applied, but recently it has received increased interest and it has been adapted for cases with continuous moderators [9,10,11,12]. In essence, the J-N technique allows the exact computation of conditions and boundary values where a moderator elicits statistically significant slopes [13]. Specifically, recent extension of the J-N technique to more complex models including polynomials with higher degrees [see [9]] makes this technique useful for research on aging and multimorbidity.
Given that multimorbidity is commonly and increasingly found among older adults, the investigation of this complex phenomenon also touches developmental issues and needs to be investigated in a life-span perspective. As such, the co-occurrence of multiple medical conditions changes in its frequency and severity over the course of the adult life span, and it is safe to assume that certain conditions interact differently and change differently at different ages and in different cohorts. In order to address and separate developmental change from cohort differences, we need to rely on longitudinal data.
In longitudinal research, linear models with quadratic time effects are frequently used. For example, ŷ = β₀ + β1time + β2time2 describes a linear model with intercept β₀, a time-based linear slope β1, and a squared time component β2. This higher-order polynomial, which now is the leading term, captures the curvature over time but it also complicates matters - not only because higher-order polynomials are difficult to interpret, but also because the linear effect is now contingent on the selection of the intercept. While parameter estimates of the leading term (here β2) will remain unaffected by shifts in the time scale, they will alter the strength and in some occasions the direction of parameter estimates of lower-order polynomials [see also [14]]. That is, the simple slope corresponds to the instantaneous rate of change at the intercept and, in terms of statistical significance, this also means that there might be occasions where the simple linear slope reaches statistical significance and other occasions where the slope is statistically not significant.
One way to identify the region of significance is to use a ‘pick-a-point' approach as proposed by Aiken and West [15], whereby the intercept is fixed to different values and the model is re-estimated for all these different conditions. Other alternative approaches have relied on a two-step approach that orthogonalizes the higher-order terms (e.g. quadratic slope) by regressing it on the lower-order terms (e.g. linear slope) prior to analysis [16,17].
A more precise way is to use the J-N technique which makes use of the first partial derivative ∂ŷ/∂ time to obtain the instantaneous rate of change at any given point along the time axis (the first partial derivative can be taken for any variable of interest). For example, if β1 = 4, β2 = -0.5 and time covers 5 years with annual measurements (0, 1, 2, 3, 4) the simple slope β1 is 4. If the intercept is placed at the last occasion (time = -4, -3, -2, -1, 0), the simple slope at the intercept is β1 = 0, indicating that one can obtain different simple slopes and different statistical significances for the same process and the same data.
The aim of this work is to highlight the J-N technique and its usefulness in the context of multimorbidity and depression in the last years of life. The technique can be used to obtain information about when and what processes are having significant impact on an outcome. In terms of the effect of multimorbidity on depression, the magnitude of the effect - its size, direction and statistical significance - can depend on other individual characteristics that change over time, indexed by how much time a person has left to live and/or the age of the person. The J-N technique can help to identify conditions and times under which multimorbidity plays a role in depression and quality of life and when such an association may require less attention or less treatment. As such, the J-N technique can bring clarity to the intricate relation between multimorbidity and important outcomes such as depressive symptoms, as it helps to identify circumstances under which such effects are strongest and when interventions might be most effective.
Methods
For the purpose of illustrating the J-N technique in a longitudinal design, we used data from the Health and Retirement Study (HRS), where we modeled change in depressive symptoms as a function of multimorbidity. In order to illustrate longitudinal change in depressive symptoms, we examined only individuals who passed away during the study. Accordingly, time represents time-to-death on an annual scale, indicating the time a person has left to live at each measurement occasion (resulting in, e.g. time-to-death = -5.5, -3.5, -1.5, where zero is time at death). We evaluated the effect of the average multimorbidity level (MMa) and changes across time in multimorbidity (MMc) on changes in depressive symptoms. Further, we show how effect sizes for MMc change relative to end of life and age-at-death.
Participants
The HRS is a nationally representative sample of middle-aged and older adults in the USA [18]. Initiated in 1992, the HRS continues to survey more than 22,000 Americans every 2 years. In the present work we used data of 2,526 participants (51% female) who died in the period between 1994 and 2006 and who were between 50 and 90 years of age at their death (average age-at-death = 76 years, SD = 9.04 years). The average age at study entry in 1994 was 69 years (SD = 9.04) and the average time-to-death was 7.9 years (SD = 2.58 years). Note that data from the Center for Epidemiological Studies Depression Scale (CES-D) tend to be skewed, which can cause regression residuals to be nonnormal. To alleviate this problem, we excluded participants (n = 330) who never reported any depressive symptoms on the CES-D.
Materials and Design
Participants were assessed at 2-year intervals via structured telephone interviews conducted by trained research staff, as well as in face-to-face interviews for selected portions of the data collection process. The current analyses focus on measures of depression, self-reported diagnosis of major health conditions [hypertension, diabetes, cardiovascular diseases (CVD), stroke and cancer] and time-to-death. In addition to the variables of interest, age-at-death was included as a covariate to permit the evaluation of age as a moderator of the effect of multimorbidity on depressive symptoms.
Depressive Symptoms
A short version of the CES-D [19,20] was used to measure depression. At each wave, participants reported experiencing up to 8 depressive symptoms during the past week (e.g. felt depressed, lonely). A sum score of the 8-item scale was computed, ranging from 0 (no depressive symptoms) to 8 (all depressive symptoms).
Multimorbidity
The health conditions of interest were hypertension, diabetes, CVD, stroke and cancer (present = 0, not present = 1). This is represented by self-reports of disease conditions garnered by a question: ‘Since your previous interview, has a doctor told you that you have (had) …?' A multimorbidity index was created for each wave by summing across health conditions (i.e. count of multiple health conditions, M = 1.4, SD = 1.1, range 0-5). This additive approach has been used previously [21]. Two multimorbidity variables were generated for the analyses: (1) MMa, reflecting an individual's MMa level across time and (2) wave-specific multimorbidity, which was person-mean centered such that values at each measurement occasion represented deviations from the individual's MMa.
Statistical Analyses
We based our analyses on a recently presented J-N technique for curvilinear polynomial models described by Miller et al. [9], where an extensive and detailed description of the technique can be found. For the present work, we applied the J-N technique to longitudinal data. A multilevel model was estimated to account for the longitudinal nature of the data and to derive fixed-effect parameter values to be used for the J-N technique. Depression served as the outcome variable and was predicted by a linear plus a quadratic time variable (coded as years-to-death), wave-specific multimorbidity (person-mean centered), MMa, and age-at-death (centered at age 70). In addition, all two- and three-way interaction terms between years-to-death (linear and quadratic), multimorbidity and age-at-death were included in the model. All analyses were conducted in R [22] using the nlme package [23] to estimate the longitudinal model and ggplot2 [24] to generate J-N plots.
Results
The basis for the J-N approach are the fixed effects values from the multilevel model reported in table 1. The lower-order parameters represent the average situation for a participant who died at the age of 70 years. Given that change over time was coded as a negative scale capturing years to death, the intercept of 2.14 represents the predicted CES-D value at the date a person passed away. The slope, or instantaneous rate of change, of CES-D at time of death is 0.22 indicating that, on average, depressive symptoms were on the rise at the end of life. The same was observed for MMc where increases of 1 medical condition over and above the person average increased CES-D by 0.39 points. The MMa, however, did not appear to significantly influence CES-D at the time of death.

The interaction terms show that the effect of time-to-death is moderated by MMa in the sense that higher MMa decreases the instantaneous rate of change in the slope of CES-D. MMc seemed to have the opposite effect, although the estimate was not statistically significant on a two-sided test. Further, the interaction between time-to-death and MMa was moderated by the age-at-death, with the result that participants who died at older ages had shallower slopes compared to participants who died at younger ages. That is, the value of the interaction between time-to-death and MMa changed as a function of the age-at-death. In addition, the effect of quadratic time is statistically significant, indicating that the instantaneous rates of change in depressive symptoms vary along the time-to-death axis.
All linear effects are interpreted as instantaneous rates of change at the point where the time axis and age-at-death are centered to zero. Hence, any change in the underlying time scale or recentering of concomitant variables must yield different results and different interpretations of these results. The right side of table 1 shows results from the same model where the center of the time scale was shifted to 5 years prior to death. Some parameters are now statistically significant (e.g. MMa) while others are not (e.g. MMc) and the effect sizes have changed as well. The instantaneous rate of change (time-to-death) 5 years prior to death is now 0.09 and as such less than half the rate of change at time of death.
In order to inspect changes in the instantaneous rate of change due to different values of multimorbidity and different points in time along the time-to-death axis, we applied the J-N technique. Figure 1 shows significance regions across time for 3 different MMa. The upper three panels illustrate instantaneous rates of change across 12 years prior to death. The gray band represents the 95% confidence interval (CI) limits. As long as the horizontal zero line is included in the band, the instantaneous rate of change cannot be discerned from zero, indicating that it is statistically not significant. The vertical hatched lines indicate the position at which the lower or higher confidence band crosses the zero line. For example, participants with, on average, 1 medical condition (upper left panel) show a small, but statistically significant increase in depressive symptoms up to 4.15 years prior to their death. After that point, the simple slope of CES-D is not statistically significant, indicating that the depressive symptoms remain stable. The slope of this positive instantaneous rate of change decreases over time and reaches zero by the end of life. The lower left panel shows the predicted values of CES-D over time. Increases in depressive symptoms accelerate up to 4.15 years prior to death when the line flattens out and the accumulation is no longer statistically significant. As the MMa increases, the curvilinear nature of CES-D across time becomes more accentuated. In the case of an average of 3 medical conditions, CES-D increases up to 6.8 years prior to death, peaks and stagnates for 3.8 years and is again statistically detectable 3 years prior to death. As the upper right panel indicates, the instantaneous rate of change is positive first but crosses the zero line and becomes negative. This indicates that participants with, on average, 3 medical conditions (and who were on average 70 years old when they passed away) showed initially strong increases in CES-D, but expressed fewer depressive symptoms as they approached death.

The upper panels show instantaneous rates of change of CES-D along the time-to-death axis (thick black lines) across 3 conditions of MMa. The gray bands represent the 95% CI that can be used to infer statistical significance. When the horizontal zero line is included in the confidence bands, the instantaneous rate of change is not statistically significant at that moment in time. The vertical hatched lines denote the points at which the upper or lower confidence bands cross the zero line and represent the boundaries between areas where the slope of CES-D is significantly different from zero versus areas where the slope is statistically not significant. The lower panels show the predicted CES-D score along the time-to-death axis across the 3 MMa conditions. CES-D scores have a possible range of 0-8.
The upper panels show instantaneous rates of change of CES-D along the time-to-death axis (thick black lines) across 3 conditions of MMa. The gray bands represent the 95% CI that can be used to infer statistical significance. When the horizontal zero line is included in the confidence bands, the instantaneous rate of change is not statistically significant at that moment in time. The vertical hatched lines denote the points at which the upper or lower confidence bands cross the zero line and represent the boundaries between areas where the slope of CES-D is significantly different from zero versus areas where the slope is statistically not significant. The lower panels show the predicted CES-D score along the time-to-death axis across the 3 MMa conditions. CES-D scores have a possible range of 0-8.
Up to this point we looked at the moderating impact of MMa on the CES-D slope. Now we inspect the effect of MMc across time and their effect on CES-D. The left panel of figure 2 shows how deviations from the MMa impact CES-D across time. The left panel is divided by the hatched line at -4.8 years which indicates that up to that point changes in MMc do not significantly moderate CES-D values. As individuals approach the end of life, each 1-unit increase in MMc above their MMa value has an increasingly larger effect, and at 4.8 years prior to death significantly, on the CES-D value. That is, reporting 1 medical condition more than on average, 4.8 years prior to death, increases CES-D by approximately 0.08 points. At the end of life, 1 additional medical condition increases the CES-D score by, on average, 0.39 points.
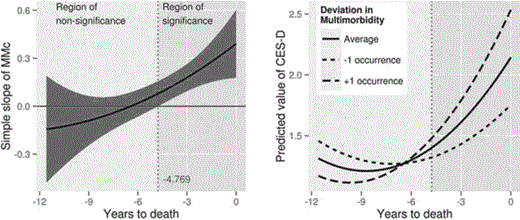
The left panel shows the differing effect of MMc on CES-D across time (thick black line). A 1-unit change in MMc impacts changes in CES-D differently. From 4.8 years prior to death these changes are significant and increase up to death. The gray bands represent the 95% CI that can be used to infer statistical significance. When the zero line is included in the confidence bands, the effect of MMc on CES-D is not significant. The vertical hatched line denotes the point at which the upper or lower confidence bands cross the zero line and also represents the boundary between the area where the slope of CES-D is not significantly different from zero versus the area where the slope is significantly different from zero. The right panel shows the average predicted value of CES-D. The 2 thick hatched lines show predicted CES-D lines for +/- 1 health condition. The simple slope in the left panel corresponds exactly to the difference in the hatched lines from the average line in the right panel. CES-D scores have a possible range of 0-8.
The left panel shows the differing effect of MMc on CES-D across time (thick black line). A 1-unit change in MMc impacts changes in CES-D differently. From 4.8 years prior to death these changes are significant and increase up to death. The gray bands represent the 95% CI that can be used to infer statistical significance. When the zero line is included in the confidence bands, the effect of MMc on CES-D is not significant. The vertical hatched line denotes the point at which the upper or lower confidence bands cross the zero line and also represents the boundary between the area where the slope of CES-D is not significantly different from zero versus the area where the slope is significantly different from zero. The right panel shows the average predicted value of CES-D. The 2 thick hatched lines show predicted CES-D lines for +/- 1 health condition. The simple slope in the left panel corresponds exactly to the difference in the hatched lines from the average line in the right panel. CES-D scores have a possible range of 0-8.
It is important to note here that we only focused on multimorbidity measures as time-moderating factors while keeping age-at-death centered at 70 years. The same J-N procedure can be applied to age-at-death or other temporal metrics. The age a person dies influences instantaneous rates of change as well (the impact of changing the centering of age-at-death is illustrated in two animations provided in the online suppl. material; see www.karger.com/doi/10.1159/000358757 for all online suppl. material).
Discussion
Quality of life in the context of multimorbidity becomes increasingly relevant as people age because the occurrence of multiple diseases increases and the threats to quality of life become more numerous. In order to shed light on the relationship between development, multimorbidity and depression or quality of life, we utilized the J-N technique in a longitudinal analysis. The J-N technique has been used previously for curvilinear polynomial models, but has focused exclusively on cross-sectional data [9]. By extending the J-N technique to longitudinal data, we were able to identify periods in time when MMc across time and MMa were significant moderators of changes in depressive symptoms.
The J-N technique for longitudinal analyses was demonstrated using the example of how multimorbidity affects depression as one approaches death. Both MMa and MMc accounted for depression, although in different ways. MMa was directly related to depression in the years prior to death (i.e. statistically significant 5 years prior to death), but not related to depression at time of death. Conversely, MMc did not show an effect on depression until the final years of life.
The interactions between multimorbidity level and time-to-death indicate that multimorbidity impacted depression differentially across the time course. Individuals who on average reported more medical conditions experienced greater increases in depression in the years most removed from death than individuals with fewer medical conditions. However, as death approached, the rate of change in depressive symptoms decreased more rapidly for those with more medical conditions, such that depression levels levelled off sooner, and even declined at end of life. These results suggest that individuals consistently living with multiple medical conditions appear to experience stable or decreasing depressive symptoms towards the end of life relative to individuals with fewer medical conditions whose depression levels are not influenced by the multimorbidity previously.
The effect of MMc on levels of depression also depended on when these changes occurred. MMc that occurred more than 4.8 years prior to death did not affect depressive symptoms. However, if an individual experienced additional medical conditions after this point, their depressive symptoms increased. Furthermore, the effect continued to increase relative to the proximity to death. Thus, additional health conditions that manifested near the end of life had the greatest impact on increases in depressive symptoms.
These interpretations all represent merely a snapshot for all lower-order terms such as main effects and two- and three-way interactions. An important point to note is that not only are the main effects contingent upon the point in time, but so too are the lower-order interactions (e.g. time-to-death × MMc). Only the highest-order interaction will not be affected, thus it may be crucial to examine the lower-order effects even in the absence of statistically significant results. The J-N technique presents a broader picture of the differential effects and improves the interpretability of complex relationships.
Clearly, the complexity of multimorbidity and its effects on other outcomes such as depressive symptoms is complicated by other co-occurring effects. The influence of multimorbidity on depression is complex because it is most likely nonlinear and contingent on a number of other variables such as, for example, birth cohort, age, age-at-death and MMc. Also, the examination of changes in depressive symptoms at the end of life coincides with negative effects in well-being and life satisfaction that are attributed to terminal decline. Terminal decline may be articulated as mortality-related development that ends in death and impacts a number of psychological domains ranging from cognitive, over health-related aspects, to affect and well-being [25,26,27].
Under these circumstances it is important to understand how these dynamics evolve over time and when they affect depressive symptoms or quality of life relative to the presence of other factors. In order to identify critical conditions and times when multimorbidity impacts depression, the J-N technique is a useful tool which allows one to compute regions of significance. This approach can help in understanding the complex phenomenon as it identifies times when multimorbidity impacts depression versus times when multimorbidity has no effect. Knowing about this temporal dependency can, for example, help focus on the precedence in treating either depressive symptoms or medical conditions.
These results may also give an account for the contrary findings on whether the severity of diseases or the number of diseases influences psychological distress [7]. Consider the differential impact of MMa and MMc on depression in the last years of life in the current study. Similarly, it is imaginable that the impact of the number or severity of medical conditions on depression changes differentially as a function of the age or proximity to death of the participant.
Also, our results represent the situation where age-at-death was centered at 70 years. Age-at-death also alters the interpretation of the instantaneous rates of change in this complex interaction. This further illustrates how seemingly contradictory conclusions can result from the same data and same type of model if alternate decisions are taken with respect to, for example, centering of time. As we demonstrate, failing to investigate the range of simple linear effects at different temporal points in the change trajectory may lead to inconsistent conclusions.
Acknowledgment
Research reported in this publication was conducted as part of the Integrative Analysis of Longitudinal Studies of Aging (IALSA) network and was supported by the National Institute on Aging, National Institutes of Health under award number P01AG043362. The content is solely the responsibility of the authors and does not necessarily represent the official views of the National Institutes of Health.
