


Abstract
Purpose: The American Cancer Society estimates that in 2006, 212,920 women will be diagnosed with breast cancer and that 40,970 women will die from the disease. The development of more efficacious chemotherapies has improved outcomes, but the rapid assessment of clinical benefit from these agents remains challenging. In breast cancer patients receiving neoadjuvant chemotherapy, treatment response is traditionally assessed by physical examination and volumetric-based measurements, which are subjective and require macroscopic changes in tumor morphology. In this study, we evaluate the feasibility of using diffusion magnetic resonance imaging (MRI) as a reliable and quantitative measure for the early assessment of response in a breast cancer model.
Experimental Design: Mice implanted with human breast cancer (MX-1) were treated with cyclophosphamide and evaluated using diffusion MRI and growth kinetics. Histologic analyses using terminal nucleotidyl transferase–mediated nick end labeling and H&E were done on tumor samples for correlation with imaging results.
Results: Cyclophosphamide treatment resulted in a significant reduction in tumor volumes compared with controls. The mean apparent diffusion change for treated tumors at days 4 and 7 posttreatment was 44 ± 5% and 94 ± 7%, respectively, which was statistically greater (P < 0.05) than the control tumors at the same time intervals. The median time-to-progression for control and treated groups was 11 and 32 days, respectively (P < 0.05).
Conclusion: Diffusion MRI was shown to detect early changes in the tumor microenvironment, which correlated with standard measures of tumor response as well as overall outcome. Moreover, these findings show the feasibility of using diffusion MRI for assessing treatment response of a breast tumor model in a neoadjuvant setting.
An integral part of the multidisciplinary treatment of primary breast cancer is the use of systemic therapy, which results in a significant reduction in the risk of recurrence and death (1–3). In recent years, the use of neoadjuvant therapy versus adjuvant therapy has been of great interest and the subject of a multitude of clinical trials (4–6). When initially proposed, the use of neoadjuvant therapy offered several prospective advantages such as early assault on potential systemic disease, safeguard against dissemination of loose cells after surgical resection, and decreasing tumor bulk thereby reducing the extent of surgery. However, in those same studies and in several smaller studies (7–9), little evidence was found to support enhanced survival benefit using neoadjuvant chemotherapy as compared with adjuvant regimens. Even so, preoperative therapy is still preferentially administered as it can potentially downstage the primary tumor in a majority of women leading to improved rates for breast-conserving surgery. Moreover, preoperative therapy regimens also allow for the assessment of in vivo tumor response to a particular drug prior to invasive perturbation of the mass. Studies have shown that the ability of chemotherapy regimens to elicit a pathologic complete response (CR) correlates with enhanced long-term disease survival (10–13). Currently, standards for evaluating systemic preoperative therapies rely on postsurgical assessment of removed tissue, leaving little opportunity to tailor and optimize therapy. Because pathologic CR serves as a powerful measure of long-term disease-free survival, the ability to assess CR noninvasively in a rapid fashion would be of exceptional value by allowing for the customization of neoadjuvant chemotherapy regimens to optimize tumor response prior to surgery.
The use of imaging technologies has been explored as a means to noninvasively predict pathologic CR in patients with breast cancer following neoadjuvant chemotherapy. These techniques have included mammography, ultrasound, and anatomic magnetic resonance imaging (MRI). However, in a recent study comparing these imaging modalities along with clinical examination, it was revealed that the accuracy of applying these current imaging techniques was insufficient to determine pathologic CR (14). Recently, diffusion MRI has been shown to be a sensitive approach for detecting treatment response and offers interesting possibilities for making progress towards the goal of predicting treatment response using imaging. The initial application of diffusion MRI for detecting early tumor treatment response was reported using a rodent glioma model (15). Further validation studies have expanded significantly on these initial results using a variety of tumor models and therapeutic agents (16–19).
Diffusion of water within tissues is a complex process mediated by water mobility in intracellular and extracellular spaces, the relative volume of these spaces, and cellular membrane integrity and permeability. In relation to tumors, quantitative diffusion values are strongly affected by tissue cellularity and extracellular volume. Early application of diffusion characterization in central nervous system tumors revealed high apparent diffusion coefficient (ADC) values within necrotic regions of tumors (20–22). These observations were confirmed in subsequent diffusion studies on human and animal tumors (17, 23–26), and suggest that diffusion has the potential to aid the distinction of necrosis from viable tumor. Given that diffusion MRI is sensitive to structure at the cellular level, it has the potential to detect and quantify cellular changes that occur in response to successful therapeutic intervention (27). Moreover, it is reasonable to expect that such changes would be measurable prior to macroscopic changes in mass, size, or morphology because removal of cellular debris occurs relatively slowly. The consistent observation of high diffusion in necrotic tissue relative to solid tumor suggests that a positive therapeutic effect should register as an increase in diffusion values relative to untreated tumor. Indeed, this has been the pattern observed by several groups using a variety of tumor models and anticancer treatments (16, 18, 28). In our experiments with an intracranial rat glioma model, we observed significant increases in tumor diffusion values following treatment with a clinical chemotherapeutic, 1,3-bis(2-chloroethyl)-1-nitrosourea (16, 19, 29). Changes were measurable as early as 2 days posttherapy, peaked within 6 to 8 days, and persisted until tumor regrowth shifted ADC back to pretreatment levels. Qualitatively similar findings have been reported using multiple murine tumor models including breast tumors (28, 30) and different therapeutic approaches (29, 31, 32). The results of these works suggest that quantitative diffusion MRI offers significant potential in the early assessment of antineoplastic treatment response.
Overall, these studies have shown that diffusion MRI can serve as a sensitive imaging biomarker for the detection of early cellular changes in treated tumors which precede macroscopic volumetric response in preclinical models. More importantly, recent work has led to the translation of diffusion MRI into the clinical arena with brain tumor clinical trials having been accomplished (33, 34). Diffusion measures were shown to be strongly correlated with overall clinical response based on the WHO response criteria, and was found to be able to stratify patients with grade 3/4 gliomas as responsive or nonresponsive to therapy as early as 3 weeks into fractionated therapy schedules. Thus, diffusion MRI is emerging as an important predictive biomarker for the early stratification of tumor response in patients with primary brain tumors.
The overall purpose of this current study was to evaluate the potential feasibility of detecting early treatment effects in a breast tumor model by using diffusion MRI. Using the human MX-1 breast tumor model, we used diffusion MRI to evaluate tumor response following cyclophosphamide therapy. In conjunction with the MRI studies, we also employed a previously described in vivo apoptosis reporter (ERLucER) detectable using bioluminescence imaging (BLI) to further elucidate MX-1 tumor response to therapy (35). Our results showed that treatment of MX-1 tumors with cyclophosphamide elicited a detectable apoptotic response within the first day posttreatment. Moreover, tumor diffusion changes could be detected early and were later positively correlated with traditional treatment outcome measures such as tumor growth kinetics and histology. Taken together, these results show that diffusion MRI was indeed capable of detecting early changes in tumor ADC as a result of therapeutic intervention consistent with previous reports. Moreover, this study suggests that future studies are warranted to further characterize the use of diffusion MRI for assessing tumor response during neoadjuvant therapy in a breast cancer model.
Materials and Methods
Cell lines. The MX-1 cell line was obtained from NCI and maintained in RPMI supplemented with 1% glutamine and 10% FCS. The MX-1/ERLucER clonal line expressing the ERLucER apoptosis reporter molecule was generated similar to a previous report (35). In brief, MX-1 cells in log phase were plated in six-well dishes until 80% confluence. Subsequently, cells were transfected using Fugene HD (Roche Diagnostics, Basel, Switzerland) reagent according to the manufacturer's protocol and incorporated with 2 μg of the ERLucER expression plasmid for 24 h. The cells were then trypsinized and plated into a 150 mm dish. After 48 h, 400 μg/mL of G418 (Invitrogen, Carlsbad, CA) was added into the growth medium for selection and maintenance. After several days of incubation, colonies were picked and expanded for screening by Western blotting for expression of luciferase reporter protein. Specific clones were identified and selected for further study based on the expression levels and activity of the recombinant protein.
Orthotopic tumor implantation. All of the animal work was accomplished in accordance within the University Committee on the Use and Care of Animals guidelines. Human MX-1 and MX-1/ERLucER cells were grown in their respective growth media until 90% confluence, to which they were then trypsinized, washed in PBS, counted, and suspended at a concentration of 1 × 10⁸ cells/mL in a 1:1 serum-free medium/Matrigel mixture. Approximately 100 μL of this cell suspension was injected into the mammary fat pad of severe combined immunodeficiency mice (6-8 weeks; Charles River Laboratories, Wilmington, MA).
In vivo MRI studies. A Varian Unity Inova MRI system (Varian Instruments, Fremont, CA) equipped with a 7 T, 18.3 cm horizontal bore magnet (Oxford Instruments, Oxford, United Kingdom) was used for all mouse MR image acquisitions. During all MRI procedures, animals were anesthetized using 1.25% isoflurane and body temperature was maintained at 37°C using a heated water recirculating pad. For anatomic imaging, a “fast-spin echo multislice” MRI sequence (TR/TE, 4,000/60 ms; number of transients, 4; number of echoes, 8; field of view, 30 × 30 mm; image matrix, 128 × 128; slice thickness, 1 mm) was used to collect 13 contiguous T2-weighted images.
For the MRI study (n = 14), when tumor volumes reached 50 to 100 μL, animals implanted with MX-1 tumors were divided into two groups. Group 1 was for controls, which received 0.1 mL of the drug vehicle (saline), whereas group 2 received a single i.p. dose of cyclophosphamide (120 mg/kg, n = 7). T2-weighted and diffusion MRI was done every 2 to 3 days (n = 7 per each group) to measure tumor water diffusion changes. Volumetric tumor measurements were accomplished through region of interest analysis of T2-weighted images, which were acquired every 2 to 3 days. Tumor volumes were used to determine time-to-progression (TTP) values defined as the time for tumor volumes to reach 400% of their baseline pretreatment volumes.
Maps of tumor ADC values were acquired using a recently described method (19), every 2 to 3 days posttherapy. Briefly, a trace diffusion weighted multislice spin echo sequence (with motion compensation and a navigator echo) was used to acquire 13 slices with two different diffusion weightings (b1 = 100 and b2 = 1,248 s/mm2). The image slice thickness was 1 mm; image matrix, 128 × 128 (zero filled to 256); field of view, 30 × 30 mm; and echo time, 60 ms. The images acquired with b1 were essentially T2-weighted images and these were used to segment the tumor from nontumor tissue for volumetric analysis using an “in-house” region drawing tool developed in MATLAB.
BLI. A cryogenically cooled CCD camera system (Xenogen, Alameda, CA) was used for image acquisition. Mice were anesthetized with a 2% isoflurane/air mixture and given a single i.p. dose of 150 mg/kg d-luciferin (Promega, Madison, WI) in normal saline. Anesthesia was maintained using a nose cone isoflurane delivery system and a heated stage was used for maintaining core body temperature.
The variables used for luminescence imaging were: f-stop, 1; bin, 2; field of view, 10 cm; and time, 30 s. Images were acquired ∼10 to 12 min post-administration of d-luciferin. Results were analyzed using Living Image software provided with the Xenogen imaging system. A grayscale body image was collected followed by luminescence acquisition, which was overlaid as a pseudo–color image representing the spatial distribution of the detected photons emitted from the tumor. Signal intensity was quantified as the sum of all detected photon counts within a uniform region of interest manually placed over the tumor site during data postprocessing.
In the BLI study, animals were implanted with 1 × 10⁷ of MX-1/ERLucER cells. For controls, animals were injected with 0.1 mL of drug vehicle (saline) when tumors (n = 10) reached ∼50 to 100 μL and were imaged every 6 h for 3 consecutive days to obtain baseline luminescence signal. For the treated group, imaging of the tumors (n = 5) was initiated after treatment with cyclophosphamide (120 mg/kg), and then re-imaged every 6 h for an additional 3 days. The maximum change in BLI signal achieved within each day of imaging in control and treated groups was used for analyses.
Histologic assessment. A separate group of animals with MX-1 tumors were prepared (n = 24) and divided into control and cyclophosphamide-treated (120 mg/kg, i.p.) groups. Animals were treated identically to those entered into the imaging studies above except that at days 0, 2, 4, 7, 14, and 22, animals (n = 2 per time point) from the control and treated groups were sacrificed and tumors were excised. Tumors were placed in buffered formalin overnight, dehydrated in 70% ethanol, and subsequently embedded in paraffin. Paraffin sections (5 μmol/L thickness) were cut on a microtome and heated for 20 min at 65°C. Slides were deparaffinized in xylene with three changes for 2 min each, then rehydrated through an alcohol gradient for 2 min each (100% alcohol, 95% alcohol, 70% alcohol). Antigen retrieval was done by heating the slides in citrate buffer pH ≈ 6.0 for 10 min in a microwave oven. Tissues were then blocked in PBS-T supplemented with 5% normal donkey serum for 1 hour. Tissue sections were prepared for histologic processing by routine techniques. Representative sections were stained using H&E and TUNEL (ApopTag) from Chemicon, Inc. (Temecula, CA) as per the manufacturer's instructions. Activation of caspase-3 was monitored using an antibody specific for the cleaved form of caspase-3 (Cell Signaling Technology, Beverly, MA) at 1:100 dilution. A cy3 coupled anti-rabbit secondary antibody was used at a dilution of 1:400 (Jackson Immunoresearch, West Grove, PA). The slides were then mounted and visualized under a fluorescence confocal microscope Nikon Eclipse TE2000-U (Melville, NY). Fluorescence images were acquired using Metamorph software (Molecular Devices Corporation, Sunnyvale, CA) using the same exposure times and images were exported as TIFF files.
Statistical analysis. A two-tailed t test was used to compare data between groups. For comparison of animal TTP, a log-rank test was done. For both of these tests, P = 0.05 was considered to be statistically significant.
Results
Diffusion MRI analysis reveals tumor response to therapy. Diffusion MRI was used to quantify the temporal treatment-induced alterations in breast tumor microenvironment in animals implanted with MX-1 tumors treated with cyclophosphamide. Pseudo-color ADC maps of representative animals are shown in Fig. 1 to provide a visual comparison of progressive changes in ADC between the control and treated groups. As seen in Fig. 1 (top), ADC values remained fairly constant over time for the control tumor although a gradual increase in ADC was observed over time with the appearance of small regions of high ADC (red) due to regional spontaneous necrosis as tumors become large. However, treated tumors (bottom) displayed a significant increase in ADC values, compared with controls, in which a greater proportion of the tumor exhibited high ADC at days 4 and 7. To further investigate therapy-induced changes in diffusion, the mean percent change in ADC was calculated for each group and plotted in Fig. 2. The control group was found to have a baseline mean ADC change of 10 ± 8% and 17 ± 9% on days 4 and 7, respectively, which were not statistically different (P > 0.05) from baseline. In contrast, treated tumors achieved a mean ADC change of 44 ± 5% on day 4, which increased to 94 ± 7% on day 7 (P < 0.001). On a day to day comparison between control and treated groups, statistical significance was achieved on day 4 (P < 0.01) and day 7 (P < 0.001), suggesting that early tumor response to treatment could be detected using diffusion MRI.

Representative ADC maps. Examples of MX-1 tumor ADC maps shown as color overlays (×10−11 m2/s) on T2-weighted anatomic MR images for (A) control and (B) cyclophosphamide-treated animals. These images were acquired on day 0 (pretreatment), day 4, and day 7.
Representative ADC maps. Examples of MX-1 tumor ADC maps shown as color overlays (×10−11 m2/s) on T2-weighted anatomic MR images for (A) control and (B) cyclophosphamide-treated animals. These images were acquired on day 0 (pretreatment), day 4, and day 7.
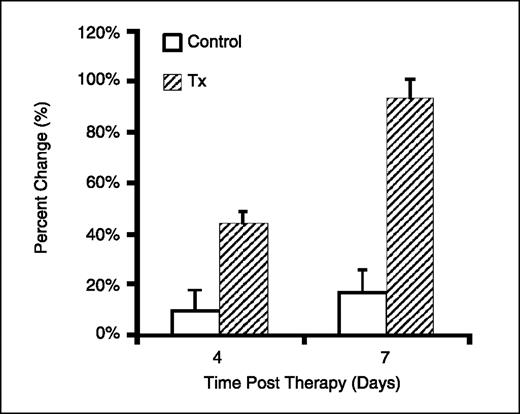
In vivo tumor ADC response to therapy. Normalized mean change in tumor ADC for untreated animals (control) and treated (120 mg/kg). The mean ADC change for the treated tumors 4 d (44 ± 5%) and 7 d (94 ± 7%) posttreatment was statistically greater (P < 0.05 and P = 5.9 × 10⁻⁵, respectively) than that of the control tumors at the same times (10 ± 8% and 17 ± 9%, respectively).
In vivo tumor ADC response to therapy. Normalized mean change in tumor ADC for untreated animals (control) and treated (120 mg/kg). The mean ADC change for the treated tumors 4 d (44 ± 5%) and 7 d (94 ± 7%) posttreatment was statistically greater (P < 0.05 and P = 5.9 × 10⁻⁵, respectively) than that of the control tumors at the same times (10 ± 8% and 17 ± 9%, respectively).
Treatment with cyclophosphamide leads to early response detectable by BLI. The ERLucER reporter construct has been previously shown to allow for real-time monitoring of apoptosis activity in vivo (35). This reporter system provides an opportunity to link the biological mechanism of treatment-induced tumor cell death with changes in diffusion MRI signals. In this study, we used this molecular imaging reporter system to evaluate if induction of apoptosis occurred in MX-1/ERLucER tumors following treatment with cyclophosphamide as well as to evaluate the temporal response of each imaging marker. In Fig. 3A, serial BLI images from a representative animal are shown to demonstrate an observable increase in signal when tumors were treated with cyclophosphamide. In contrast, prior to treatment, BLI signals from the control group remained relatively constant within the same time frame as the treated group, thereby showing that treatment with cyclophosphamide elicited an apoptotic response. Quantification of BLI revealed that at day 1, cyclophosphamide-treated tumors had a signal increase of 74%, which was statistically different (P < 0.05) from control tumors (2%). On day 2, cyclophosphamide-treated tumors had a much greater apoptotic response as compared with controls (P < 0.05) in which increases in signal were found to be 111% and 26%, respectively. In addition, BLI signals in the treated group further increased from days 1 to 2, suggesting an even greater apoptotic response on day 2, which was found to be statistically significant (P < 0.05). However, in the control group, BLI remained relatively constant as there was no statistical difference in signal between days 1 and 2 (P > 0.05). For further validation, tumor sections were stained to assess the level of caspase-3 activation for validation with BLI findings showing apoptotic activity in the treatment group. As shown in Fig. 3C, control tumors revealed minimal staining for active caspase-3 prior to treatment as well as on day 2. However, treated tumors revealed a dramatic increase in caspase-3 activation on day 2, as compared with pretreatment and controls, which correlates with the BLI data showing a significant increase in apoptotic activity due to cyclophosphamide treatment.

BLI detects activation of apoptosis. A, examples of MX-1 tumor bioluminescence images from control (n = 10) and treated tumors (n = 5) on days 1 and 2. B, the mean change in signal intensity from each group. C, tumor sections were stained to assess the level of caspase-3 activation.
BLI detects activation of apoptosis. A, examples of MX-1 tumor bioluminescence images from control (n = 10) and treated tumors (n = 5) on days 1 and 2. B, the mean change in signal intensity from each group. C, tumor sections were stained to assess the level of caspase-3 activation.
Histologic assessment of therapeutic response. To correlate treatment-induced changes in diffusion and activation of apoptosis, pathologic analyses were done on isolated tumor samples. In Fig. 4A, H&E-stained tumor sections from the control group revealed a dense pattern of cellular aggregation that remained consistent from days 0 to 14. In the treated tumors, treatment with cyclophosphamide resulted in a gradual loss in cellularity marked with the presence of amorphous giant cells by day 4; however, an increase in cell density was observed by day 14 due to repopulation of the tumor. Furthermore, tumor sections were analyzed using a terminal nucleotidyl transferase–mediated nick end labeling (TUNEL) assay (Fig. 4B) to stain for apoptotic cells by detecting 3′ DNA strand breaks, which are a biochemical hallmark of apoptosis. Staining of tumor samples from the control group did not reveal any detectable evidence of apoptotic events throughout the course of the experiment. However, in the treated group, a marked increase in TUNEL-positive cells were detected on day 4, which quickly dissipated by day 7.

Histologic assessment of tumor response. Tumor samples treated with cyclophosphamide (120 mg/kg) or saline were harvested for histologic analyses on days 0, 2, 4, 7, and 14. Tumor samples were sectioned and subsequently stained with (A) H&E or (B) TUNEL costained with hematoxylin.
Histologic assessment of tumor response. Tumor samples treated with cyclophosphamide (120 mg/kg) or saline were harvested for histologic analyses on days 0, 2, 4, 7, and 14. Tumor samples were sectioned and subsequently stained with (A) H&E or (B) TUNEL costained with hematoxylin.
Cyclophosphamide enhances tumor control. Determination of therapeutic efficacy is traditionally achieved through analysis of growth kinetics using tumor volumetric measurements. For correlation with the findings from BLI and MRI studies, tumor volumes from each group were measured every 2 to 3 days using MRI-based measurements. In Fig. 5A, a growth curve plot is shown which reveals a marked difference in growth kinetics between control and treated tumors. After administration with drug-vehicle, control tumors continued to grow exponentially until approximately day 13, at which point, animals were euthanized due to a large tumor burden. However, administration of cyclophosphamide in the treated group revealed a rapid regression in tumor volume on day 4 and continued to decrease until day 14. Using a previously reported methodology for determining log cell kill using MRI (36), the log cell kill due to cyclophosphamide treatment was determined to be 2.1 ± 0.4. Further analysis of volumetric data revealed interesting results shown in Fig. 4B as a Kaplan-Meier plot of TTP, which was defined as the time for tumor volumes to reach 400% of their pretreatment volume. The median TTP for the control group was 11 days, whereas treatment with cyclophosphamide led to a TTP of 32 days, which was statistically significant in the control group (P < 0.0001).

Growth response to therapy. A, normalized mean tumor volumes for untreated (control, n = 7) and treated (120 mg/kg, n = 7) animals. For the treated group, the mean log cell kill was 2.1 ± 0.4. B, normalized progression-free survival for untreated (control, n = 7) and cyclophosphamide-treated (120 mg/kg, n = 7) animals. The median TTP for the control and treated groups were 11 and 32 d, respectively. These survival curves were statistically different (P < 0.05). TTP was defined as the time for tumor volumes to reach 400% of their baseline pretreatment volume.
Growth response to therapy. A, normalized mean tumor volumes for untreated (control, n = 7) and treated (120 mg/kg, n = 7) animals. For the treated group, the mean log cell kill was 2.1 ± 0.4. B, normalized progression-free survival for untreated (control, n = 7) and cyclophosphamide-treated (120 mg/kg, n = 7) animals. The median TTP for the control and treated groups were 11 and 32 d, respectively. These survival curves were statistically different (P < 0.05). TTP was defined as the time for tumor volumes to reach 400% of their baseline pretreatment volume.
Discussion
Treatment of primary breast cancer has evolved into a multimodal approach involving a myriad of interventional strategies. The goal of multimodality therapy is to judiciously use each of these treatments in a manner which maximizes patient outcome, whereas limiting adverse consequences. The inclusion of chemotherapeutics into breast cancer care has yielded significant results in reducing the rate of recurrence and death, although questions still remain regarding its optimal integration into the multidisciplinary treatment of breast cancer. Patients highly responsive to neoadjuvant chemotherapy, in which tumors exhibit a pathologic CR, have improved long-term disease-free survival (10–13); however, the assessment of pathologic CR requires invasive removal of tumor tissue. The ability to predict pathologic CR noninvasively could provide huge gains in breast cancer care by defining a subset of patients who do not require a surgical procedure subsequent to neoadjuvant therapy. Moreover, rapid assessment of pathologic CR in the breast could aid in treatment planning by identifying instances of failed response to chemotherapy, thereby allowing for an opportunity to adjust and optimize alternative therapeutic regimens before resorting to surgical intervention. This is especially important where a myriad of chemotherapeutics are available in instances in which initial therapy fails.
Diffusion MRI has been repeatedly shown to provide for rapid noninvasive assessment of therapeutic response in variety of tumor models as well as therapeutic strategies (19, 28–32, 37, 38). Moreover, the sensitivity of diffusion MRI has been further highlighted by the high temporal resolution of this approach in which our previous studies have shown the ability of diffusion MRI to detect the emergence of drug resistance during the course of therapy (37, 39). More importantly, the use of diffusion MRI in clinical oncology has been substantiated with recent studies showing the ability for early stratification of brain tumor response in patients (33, 34). In patients with primary central nervous system malignancies, temporal comparison using diffusion MRI both prior to and 3 weeks after the start of treatment has been shown to predict eventual radiographic response at 10 weeks with both high sensitivity and specificity. In addition, in a subset of patients with high-grade malignant glioma, diffusion MRI as early as 3 weeks after the start of a course of fractionated radiation therapy also predicted not only radiographic response but also TTP and overall survival. With diffusion MRI clearly showing a prognostic potential in clinical neuro-oncology, the extension of this imaging technique into other arenas in oncology is merited.
The ability to rapidly and reliably assess tumor response during therapeutic intervention provides validation of treatment efficacy as well as providing a window to peer into the temporal dynamics of drug action. In the current study, we employed diffusion MRI in a preclinical model of breast cancer to determine the feasibility of using diffusion MRI for detecting treatment-induced changes in tumor ADC. The model system used incorporated a rapidly growing MX-1 human breast cancer line, which upon initiation of cyclophosphamide therapy, led to detectable changes using diffusion MRI. As shown in Figs. 1 and 2, treatment with cyclophosphamide led to early quantifiable changes in ADC as early as day 4, which is consistent with our previous studies indicating a drug-induced tumor response. This was further correlated with tumor growth kinetics, which revealed that cyclophosphamide treatment resulted in marked tumor regression and a marked increase in TTP. More importantly, diffusion MRI findings correlated temporally with histologic analysis of tumor samples in which a major loss in cellularity and the presence of apoptotic events were observed on day 4 as well. However, dependence on cellular markers of response such as TUNEL may, in some cases, be misleading. In this study, its effectiveness was limited to a narrow temporal window as shown by the loss of TUNEL-positive staining by day 7, despite volumetric measurements revealing that tumors regressed until day 14 due to treatment. Taken together, these results show that diffusion MRI is a feasible approach for monitoring tumor response. However, further studies are merited to fully elucidate the use of diffusion MRI as an imaging surrogate for predicting pathologic CR within the context of breast cancer in a neoadjuvant setting.
On a side note, previous reports had suggested apoptosis as the mechanism of cellular death induced by cyclophosphamide treatment as evidenced by the presence of histologic features consistent with programmed cell death such as membrane blebbing and DNA fragmentation (40–42). Consistent with these findings, we showed that cyclophosphamide did indeed lead to the activation of caspase-3 in MX-1 tumors in vivo as observed using our noninvasive apoptosis imaging platform (35). In conjunction with findings from histologic analysis of caspase-3 activation, this further supports that therapeutic action of cyclophosphamide is in part mediated through the apoptotic machinery. Using another standard histologic assessment of apoptosis (TUNEL), the presence of apoptotic bodies was not observed until day 4, which further highlights the remarkable sensitivity of the apoptosis imaging platform for early detection of treatment response. Moreover, histologic analyses only provide static snapshots in time, whereas noninvasive imaging provides the advantage of dynamically monitoring tumor response throughout the experiment. Although BLI is not clinically translatable, this study shows its potential use for the arena of drug development due to its sensitivity and noninvasive nature, where it can provide dynamic assessment of apoptotic events induced from various therapies.
Grant support: NIH grants P01CA85878, P50CA93990, and R24CA83099.
The costs of publication of this article were defrayed in part by the payment of page charges. This article must therefore be hereby marked advertisement in accordance with 18 U.S.C. Section 1734 solely to indicate this fact.
Conflict of interest: A. Rehemtulla, T.L. Chenevert, and B.D. Ross have a financial interest in the use of the underlying technologies.
Acknowledgments
We thank Dr. Mahaveer S. Bhojani for his technical assistance and Dr. Savita Nikam and Richard Lister of Molecular Imaging Research Inc. for assistance with producing the MX-1/ERLucER cell line and mouse implants.