


Abstract
Mammalian target of rapamycin (mTOR) is increasingly recognized as a master regulator of fundamental cellular functions, whose deregulation may underlie neoplastic transformation and progression. Hence, mTOR has recently emerged as a promising target for therapeutic anticancer interventions in several human tumors, including breast cancer. Here, we investigated the antiangiogenic potential of temsirolimus (also known as CCI-779), a novel mTOR inhibitor currently in clinical development for the treatment of breast cancer and other solid tumors. Consistent with previous reports, sensitivity to temsirolimus-mediated growth inhibition varied widely among different breast cancer cell lines and was primarily due to inhibition of proliferation with little, if any, effect on apoptosis induction. In the HER-2 gene–amplified breast cancer cell line BT474, temsirolimus inhibited vascular endothelial growth factor (VEGF) production in vitro under both normoxic and hypoxic conditions through inhibition of hypoxia-stimulated hypoxia-inducible factor (HIF)-1α expression and transcriptional activation. Interestingly, these effects were also observed in the MDA-MB-231 cell line, independent of its inherent sensitivity to the growth-inhibitory effects of temsirolimus. A central role for mTOR (and the critical regulator of cap-dependent protein translation, eIF4E) in the regulation of VEGF production by BT474 cells was further confirmed using a small interfering RNA approach to silence mTOR and eIF4E protein expression. In addition to its effect on HIF-1α–mediated VEGF production, temsirolimus also directly inhibited serum- and/or VEGF-driven endothelial cell proliferation and morphogenesis in vitro and vessel formation in a Matrigel assay in vivo. Overall, these results suggest that antiangiogenic effects may substantially contribute to the antitumor activity observed with temsirolimus in breast cancer. (Cancer Res 2006; 66(11): 5549-54)
Introduction
Mammalian target of rapamycin (mTOR) is a 289-kDa serine/threonine kinase belonging to the phosphoinositide kinase-related kinase family (1, 2). Through the formation of multimolecular complexes, the evolutionary conserved TOR pathway controls an array of fundamental cell functions, such as translation initiation, protein stability, transcription of ribosome and stress response genes, ribosomal biogenesis, and tRNA synthesis, thereby playing a central role in the regulation of cell growth, proliferation, and survival (2). The regulation of mTOR is not fully understood: upstream activators include, but are not limited to, the phosphatidylinositol 3-kinase (PI3K)/AKT signaling cascade, which possibly acts through phosphorylation and inactivation of the TOR-inhibitory tuberous sclerosis (TSC) complex formed by hamartin (TSC1) and tuberin (TSC2; ref. 2). TOR activation, in turn, regulates translation initiation through at least two distinct pathways: activation of ribosomal S6K1, which enhances translation of mRNAs that bear a 5′-terminal oligopyrimidine tract, and inactivation of 4E-BP1 suppressor protein, which leads to its dissociation from the RNA cap-binding protein eIF4E and allows cap-dependent mRNA translation through the formation of the eIF4F complex (2, 3). Although neither mTOR mutations nor its overexpression has been reported in human tumors, signaling pathways that are upstream or downstream of mTOR are frequently deregulated in human cancers, including breast cancer (2). As a consequence, rapamycin, the prototype of mTOR inhibitors, inhibits tumor growth in a wide range of experimental malignancies (2, 4). Temsirolimus (also known as CCI-779) is a recently developed mTOR inhibitor, with improved aqueous solubility and more favorable pharmaceutical properties compared with the parent compound rapamycin. Temsirolimus has shown promising preclinical and early clinical antitumor activity and is currently in phase III clinical development for the treatment of different solid tumors, including breast cancer (4). Because mTOR inhibition by rapamycin has been shown to exert antitumor effects, at least in part, by inhibiting angiogenesis (5–7), we have investigated the antiangiogenic potential of temsirolimus in breast cancer.
Materials and Methods
Cell cultures and in vitro treatment. Nine human breast cancer cell lines [BT474, SKBr3, T47D, MCF7, Adriamycin-resistant MCF7 (MCF7 ADR), Bcl-2-overexpressing MCF7 (MAB27), CG5, ZR 75-1, and MDA-MB-231], human umbilical vein endothelial cells (HUVEC), and immortalized endothelial cells (EA.hy926, ref. 8) were used. Temsirolimus, synthesized at Wyeth-Ayerst Research (Pearl River, NY), was dissolved in ethanol (100%) and adjusted to the final concentration with culture medium. The cells were exposed to normoxia or hypoxia (9) in the presence or absence of different doses of temsirolimus. Cells and conditioned medium were differentially processed according to the analysis to be done.
Cell proliferation. To calculate the dose of drug that causes 50% of cell growth inhibition (IC50), exponentially growing breast cancer cells were exposed to doses of temsirolimus ranging from 0.05 nmol/L to 50 μmol/L. At the end of treatment, cells were washed, assayed for cell viability (by trypan blue exclusion test), and counted using a Coulter Counter (Kontron Instruments, Milan, Italy). Results were analyzed using the Calcusyn software (Biosoft, Cambridge, United Kingdom), and IC50s were appropriately derived.
Exponentially-growing HUVEC were seeded (7 × 10³ per well) and incubated for 24 hours in complete medium. Next, cells were starved for 24 hours in serum-free medium and then incubated in either serum-free or complete medium in the presence or absence of temsirolimus. Cell proliferation was evaluated after 72 hours by a colorimetric assay as described previously (8).
ELISA and reverse transcription-PCR. To determine the amount of vascular endothelial growth factor (VEGF) protein, ELISA kit (R&D Systems, Minneapolis, MN) was used according to the manufacturer's instructions (9). The levels of VEGF mRNA were determined by reverse transcription-PCR (RT-PCR) as described previously (10). cDNA encoding VEGF was amplified for 25 cycles (95°C, 60°C, and 72°C for 30 seconds) using the following primers: 5′-GGCTCTAGATCGGGCCTCCGAAACCAT-3′ (forward, base −16 to +2 in exon 1) and 5′-GGCTCTAGAGCGCAGAGTCTCCTCTTC-3′ (reverse, bases 804-821 in the 3′-untranslated region). Expression of β-actin was used as an internal standard for RNA loading. Experiments were repeated at least thrice.
Western blot analysis. Total or nuclear extracts were fractionated by SDS-PAGE, transferred to a nitrocellulose filter, and subjected to immunoblot assays. Antibodies against hypoxia-inducible factor (HIF)-1α and HIF-1β/aryl hydrocarbon receptor nuclear translocator 1 (BD Biosciences, San Jose, CA) were used at 1:500 dilution, and antibodies specific for total and phosphorylated p70S6K, 4E-BP1, eIF4E, and mTOR (Cell Signaling Technology, Inc., Beverly, MA) were used at 1:1,000 dilution. Heat-shock protein (HSP) and β-actin were used as loading and blotting controls and detected by anti-human HSP 72/73 mAb (Ab-1, clone W27, Calbiochem, Cambridge, MA) and anti-human β-actin (clone AC-15, Sigma, Saint Louis, MS), respectively.
Small interfering RNA experiments. mTOR and eIF4E expression was specifically silenced using a small interfering RNA (siRNA) duplex (Cell Signaling Technology). p70S6K-specific siRNA was purchased from Santa Cruz Biotechnology (Santa Cruz, CA). The cells were exposed to 100 nmol/L siRNA in the presence of Lipofectamine 2000 (Invitrogen, Carlsbad, CA) for 48 hours and then exposed to hypoxic conditions for 24 hours in serum-free medium. Control experiments were done using siRNA directed against unrelated mRNA.
Promoter activity. For transient transfection, 3 × 10⁵ cells were seeded into 60-mm dishes, and 24 hours later, each dish was transfected with 1.5 μg plasmids ligates to luciferase (9) using Lipofectamine according to the manufacturer's instructions. Twenty-four hours later, half of the dishes were subjected to hypoxia, and the other half was kept under normoxic conditions in the presence or absence of temsirolimus.
Cell cycle and apoptosis analysis. Cell cycle distribution and apoptosis were analyzed by flow cytometry as reported previously (11).
Morphogenesis assay on Matrigel. Morphogenesis on Matrigel of endothelial cells was evaluated as reported previously (8). Cells were plated (2 × 10⁵ per well) on polymerized Matrigel (Becton Dickinson, Bedford, MA) in 1 mL serum-free medium containing 50 ng/mL VEGF (R&D Systems) in the presence or absence (positive control) of temsirolimus (50 nmol/L). Cells plated in serum-free medium served as the negative control. Experiments were repeated at least thrice, and each dose was tested in triplicate.
In vivo Matrigel assay. An in vivo Matrigel assay was used to evaluate the ability of temsirolimus to modulate neovascularization (8). Matrigel plugs containing heparin alone (negative control), heparin plus VEGF (positive control), or heparin plus VEGF and temsirolimus were injected s.c. into the flank of 8-week-old C57BL/6 mice (eight mice per group, furnished by the Animal Care Unit of the Regina Elena Cancer Institute, Rome, Italy), and hemoglobin (Hb) content was evaluated after 5 days (8).
Results and Discussion
Among the nine human breast cancer cell lines tested for sensitivity to the growth-inhibitory effects of temsirolimus, HER-2 gene–amplified cells (SKBr3 and BT474) were strikingly sensitive (IC50, 1.6 and 4.3 nmol/L, respectively; Fig. 1A), whereas the HER-2-negative cell line MDA-MB-231 was relatively resistant (IC50, 15 μmol/L) in agreement with previous findings (12). Consistent with its ability to inhibit mTOR, temsirolimus dose dependently inhibited the phosphorylation of p70S6K and 4E-BP1 in both sensitive (BT474; Fig. 1B) and resistant (MDA-MB-231; data not shown) cell lines as well as in spontaneously immortalized, untransformed, breast epithelial cells (MCF10A; data not shown). Temsirolimus effects were similar under both normoxic (Fig. 1B) and hypoxic (data not shown) conditions, although the basal state of phosphorylation of p70S6K and 4E-BP1 was decreased after exposure to hypoxia (data not shown). In BT474 cells, temsirolimus also dose dependently inhibited eIF4E phosphorylation (Fig. 1B). This observation was quite unexpected because eIF4E phosphorylation is controlled by the mitogen-activated protein kinase–dependent, mTOR-independent activity of Mnk1, and temsirolimus parent compound, rapamycin, has been reported to have no effect or even to increase eIF4E phosphorylation in different cellular models (13, 14). The reason for this apparent discrepancy is currently under investigation and could be related to HER-2 overexpression in our model system (BT474). As shown in Fig. 1C, temsirolimus-induced growth inhibition was primarily due to the inhibition of proliferation, with relative depletion of cells in the S phase of the cell cycle and accumulation in G0-G1, rather than to the induction of apoptotic cell death (Fig. 1C).
![Figure 1. Effects of temsirolimus on cell proliferation, mTOR signaling, and VEGF production in breast cancer cell lines. A, two HER-2-positive (BT474 and SKBr3) and seven HER-2-negative (T47D, MCF7, MCF7 ADR, MAB27, CG5, ZR 75-1, and MDA-MB-231) human breast cancer cell lines were exposed to doses of temsirolimus ranging from 0.05 nmol/L to 50 μmol/L, and the dose of drug that caused 50% of cell growth inhibition (IC50) was calculated. B, Western blot analysis of p70S6K, 4E-BP1, and eIF4E protein expression and phosphorylation in BT474 cells in the presence or absence of temsirolimus at the indicated concentrations. β-Actin expression is protein loading and blotting control. Representative of one of three experiments done with superimposable results. C, exponentially-growing BT474 cells were exposed to temsirolimus at the indicated concentrations and then assessed for cell cycle distribution [propidium iodide (PI) staining, top] and apoptosis (Annexin V/PI staining, bottom) by flow cytometry. Percentages of cells in the G0-G1 phase of the cell cycle (as calculated using the ModFit software). Representative of one of three experiments done with superimposable results. D, VEGF protein expression was evaluated by ELISA in conditioned medium of BT474 (white columns) and MDA-MB-231 (black columns) cells after exposure to normoxia or hypoxia for 24 hours in the presence or absence of temsirolimus at the indicated concentrations. Results are pg VEGF/106 cells/24 h. Normoxia and hypoxia controls (**, P = 0.01, BT474; **, P ≤ 0.01, MDA-MB-231, respectively) as well as untreated and temsirolimus-treated samples (*, P ≤ 0.01, BT474; *, P ≤ 0.02, MDA-MB-231, respectively) were compared using a two-tailed Student's t test for paired samples.](https://aacr.silverchair-cdn.com/aacr/content_public/journal/cancerres/66/11/10.1158_0008-5472.can-05-2825/3/m_5549fig01g.jpeg?Expires=1716465729&Signature=WG6QHgJhdr-i-Ix5JlvbAHbpOXICwXzHyV~2pZBuxtFZzILagoQzCIedLD1WN8iCAyfSUJiSENNQkxPqqaUK2Q6QMvgzIOym3LpCGEsV~NrRT8ygY0J6kTK8zJw5esCVKL6Ur5H7YqgbAL6HoOuqzwufgPniIbdRBm9ctFQ2JCR5-hiNjOsc0pwMydATPAzVIkDCoCqeQG9S9qhAYlGNiQP1KcB69E6yr6m0pfgbaLOHOpWdfPbWj8O7HCLdUyh~T1MtlPi4Px6tOSrv4WkairOfSm3C3~O8lHMaQ-bTogPcnkexT7eRe9LxtQZn7C-c42kPcRetF-ei7pdjTjc17w__&Key-Pair-Id=APKAIE5G5CRDK6RD3PGA)
Effects of temsirolimus on cell proliferation, mTOR signaling, and VEGF production in breast cancer cell lines. A, two HER-2-positive (BT474 and SKBr3) and seven HER-2-negative (T47D, MCF7, MCF7 ADR, MAB27, CG5, ZR 75-1, and MDA-MB-231) human breast cancer cell lines were exposed to doses of temsirolimus ranging from 0.05 nmol/L to 50 μmol/L, and the dose of drug that caused 50% of cell growth inhibition (IC50) was calculated. B, Western blot analysis of p70S6K, 4E-BP1, and eIF4E protein expression and phosphorylation in BT474 cells in the presence or absence of temsirolimus at the indicated concentrations. β-Actin expression is protein loading and blotting control. Representative of one of three experiments done with superimposable results. C, exponentially-growing BT474 cells were exposed to temsirolimus at the indicated concentrations and then assessed for cell cycle distribution [propidium iodide (PI) staining, top] and apoptosis (Annexin V/PI staining, bottom) by flow cytometry. Percentages of cells in the G0-G1 phase of the cell cycle (as calculated using the ModFit software). Representative of one of three experiments done with superimposable results. D, VEGF protein expression was evaluated by ELISA in conditioned medium of BT474 (white columns) and MDA-MB-231 (black columns) cells after exposure to normoxia or hypoxia for 24 hours in the presence or absence of temsirolimus at the indicated concentrations. Results are pg VEGF/106 cells/24 h. Normoxia and hypoxia controls (**, P = 0.01, BT474; **, P ≤ 0.01, MDA-MB-231, respectively) as well as untreated and temsirolimus-treated samples (*, P ≤ 0.01, BT474; *, P ≤ 0.02, MDA-MB-231, respectively) were compared using a two-tailed Student's t test for paired samples.
Effects of temsirolimus on cell proliferation, mTOR signaling, and VEGF production in breast cancer cell lines. A, two HER-2-positive (BT474 and SKBr3) and seven HER-2-negative (T47D, MCF7, MCF7 ADR, MAB27, CG5, ZR 75-1, and MDA-MB-231) human breast cancer cell lines were exposed to doses of temsirolimus ranging from 0.05 nmol/L to 50 μmol/L, and the dose of drug that caused 50% of cell growth inhibition (IC50) was calculated. B, Western blot analysis of p70S6K, 4E-BP1, and eIF4E protein expression and phosphorylation in BT474 cells in the presence or absence of temsirolimus at the indicated concentrations. β-Actin expression is protein loading and blotting control. Representative of one of three experiments done with superimposable results. C, exponentially-growing BT474 cells were exposed to temsirolimus at the indicated concentrations and then assessed for cell cycle distribution [propidium iodide (PI) staining, top] and apoptosis (Annexin V/PI staining, bottom) by flow cytometry. Percentages of cells in the G0-G1 phase of the cell cycle (as calculated using the ModFit software). Representative of one of three experiments done with superimposable results. D, VEGF protein expression was evaluated by ELISA in conditioned medium of BT474 (white columns) and MDA-MB-231 (black columns) cells after exposure to normoxia or hypoxia for 24 hours in the presence or absence of temsirolimus at the indicated concentrations. Results are pg VEGF/106 cells/24 h. Normoxia and hypoxia controls (**, P = 0.01, BT474; **, P ≤ 0.01, MDA-MB-231, respectively) as well as untreated and temsirolimus-treated samples (*, P ≤ 0.01, BT474; *, P ≤ 0.02, MDA-MB-231, respectively) were compared using a two-tailed Student's t test for paired samples.
We next examined the effects of temsirolimus on VEGF production. VEGF release in culture conditioned medium was measured by ELISA after exposure to either normoxic or hypoxic conditions for 24 hours in the presence or absence of increasing concentrations of temsirolimus (0.5 to 50 nmol/L). Under both conditions, temsirolimus significantly (P ≤ 0.01) inhibited VEGF production by BT474 cells in a dose-dependent manner (Fig. 1D). Interestingly, temsirolimus also reduced VEGF production by MDA-MB-231 cells, which were otherwise resistant to its growth-inhibitory effects (Fig. 1D). Consistent with its effect on VEGF protein release in culture conditioned medium, temsirolimus (50 nmol/L) also strikingly decreased VEGF mRNA levels as evaluated by RT-PCR in BT474 cells (Fig. 2A). Using BT474 as a model, we next analyzed whether temsirolimus-mediated down-regulation of VEGF production might involve the transcription complex HIF-1, an essential, O2-regulated, transcriptional activator of the VEGF gene (15). As shown in Fig. 2B, in BT474 cells, temsirolimus strikingly reduced HIF-1α protein levels under both normoxic and hypoxic conditions at all concentrations tested (0.5-50 nmol/L); conversely, a modest reduction in the HIF-1β subunit was only observed in response to the highest dose (50 nmol/L). We further confirmed that mTOR inhibition by temsirolimus had indeed HIF-1–dependent transcriptional effects using BT474 cells transiently transfected with hypoxia-responsive elements (HRE)-, complete human VEGF promoter (VEGF-1151)-, or 385-bp human VEGF promoter (VEGF-385, containing only the HIF-1-binding sites)-luciferase reporter constructs (9). Consistent with the observed reduction in HIF-1α expression, temsirolimus significantly (P < 0.05) and dose dependently inhibited hypoxia-induced luciferase activity in cells transfected with each of the three reporter constructs (Fig. 2C and D), although it did not affect the activity of a negative-control construct containing mutated HRE (data not shown).
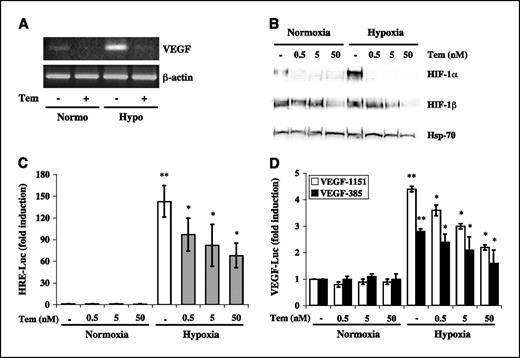
Effects of temsirolimus on VEGF mRNA levels, HIF-1α expression, and VEGF promoter activity in breast cancer cell lines. A, BT474 cells were exposed to temsirolimus (50 nmol/L) for 24 hours under normoxic and hypoxic conditions. Equal amounts of mRNA were then subjected to RT-PCR using VEGF-specific primers. Expression of β-actin was used as an internal standard for RNA loading. Representative of one of three experiments done with superimposable results. B, Western blot analysis of HIF-1α and HIF-1β protein expression in nuclear extracts of BT474 cells exposed to normoxia or hypoxia for 24 hours in the presence or absence of temsirolimus at the indicated concentrations. HSP-70 expression is protein loading and blotting control. Representative of one of three experiments done with superimposable results. BT474 cells were transfected with HRE-Luc (C), VEGF-1151-Luc (D, white columns), or VEGF-385-Luc (D, black columns) reporter plasmids and exposed to normoxia or hypoxia for 24 hours in the presence or absence of temsirolimus at the indicated concentrations before assaying for luciferase activity. Luciferase values were normalized for transfection efficiency (luciferase/β-galactosidase ratios). Results are luciferase activity fold induction relative to the activity observed in untreated cells under normoxia. Columns, mean of three independent experiments for each reporter construct; bars, SD. Normoxia and hypoxia controls (**, P = 0.01, HRE-Luc; **, P ≤ 0.05, VEGF-1151-Luc and VEGF-385-Luc reporter constructs, respectively) as well as untreated and temsirolimus-treated samples (*, P ≤ 0.02, HRE-Luc; *, P ≤ 0.05, VEGF-1151-Luc and VEGF-385-Luc reporter constructs, respectively) were compared using a two-tailed Student's t test for paired samples.
Effects of temsirolimus on VEGF mRNA levels, HIF-1α expression, and VEGF promoter activity in breast cancer cell lines. A, BT474 cells were exposed to temsirolimus (50 nmol/L) for 24 hours under normoxic and hypoxic conditions. Equal amounts of mRNA were then subjected to RT-PCR using VEGF-specific primers. Expression of β-actin was used as an internal standard for RNA loading. Representative of one of three experiments done with superimposable results. B, Western blot analysis of HIF-1α and HIF-1β protein expression in nuclear extracts of BT474 cells exposed to normoxia or hypoxia for 24 hours in the presence or absence of temsirolimus at the indicated concentrations. HSP-70 expression is protein loading and blotting control. Representative of one of three experiments done with superimposable results. BT474 cells were transfected with HRE-Luc (C), VEGF-1151-Luc (D, white columns), or VEGF-385-Luc (D, black columns) reporter plasmids and exposed to normoxia or hypoxia for 24 hours in the presence or absence of temsirolimus at the indicated concentrations before assaying for luciferase activity. Luciferase values were normalized for transfection efficiency (luciferase/β-galactosidase ratios). Results are luciferase activity fold induction relative to the activity observed in untreated cells under normoxia. Columns, mean of three independent experiments for each reporter construct; bars, SD. Normoxia and hypoxia controls (**, P = 0.01, HRE-Luc; **, P ≤ 0.05, VEGF-1151-Luc and VEGF-385-Luc reporter constructs, respectively) as well as untreated and temsirolimus-treated samples (*, P ≤ 0.02, HRE-Luc; *, P ≤ 0.05, VEGF-1151-Luc and VEGF-385-Luc reporter constructs, respectively) were compared using a two-tailed Student's t test for paired samples.
To our knowledge, this is the first demonstration that temsirolimus directly affects VEGF production in breast cancer cells, both sensitive (BT474) and resistant (MDA-MB-231) to temsirolimus-mediated growth inhibition. In the HER-2 gene–amplified cell line BT474, this effect was mediated by inhibition of hypoxia-induced, HIF-1–dependent, VEGF gene transcription. These results agree with the proposed role of the PI3K/AKT/mTOR signaling pathway in the control of HIF-1α expression, HIF-1 transactivating function, and VEGF transcription (16) and are consistent with the ability of temsirolimus parent compound, rapamycin, to inhibit VEGF production by a variety of human cancer cells (5, 7, 17). Although temsirolimus reduced VEGF production and HIF-1α protein expression under normoxic as well as under hypoxic conditions (Figs. 1D and 2B), we could not ascribe the effect observed in normoxia to reduced HIF-1–dependent transcription (Fig. 2C and D). One possible explanation for these findings is that mTOR affects VEGF production at multiple levels, with distinct mechanisms operating under normoxic and hypoxic conditions. Two lines of evidence support this hypothesis: (a) HIF-1α itself is regulated by mTOR through distinct mechanisms (i.e., increase in protein synthesis under normoxic conditions in HER-2 gene–amplified cells (18) and increased protein stability and half-life under hypoxic stimulation; ref. 17) and (b) recent data indicate that constitutive AKT activation, but not hypoxia, may increase VEGF gene transcription through a Sp1-dependent, HIF-1–independent mechanism (19).
To further confirm the role of mTOR signaling in the regulation of VEGF production, we next analyzed the effects of siRNA-mediated silencing of mTOR protein expression. As shown in Fig. 3A, transfection of BT474 cells with a siRNA directed against mTOR under normoxic conditions effectively reduced mTOR expression and phosphorylation of its downstream targets p70S6K and 4E-BP1; phosphorylation of eIF4E was also strikingly reduced, further supporting the hypothesis that, in the BT474 model, mTOR signaling regulates eIF4E phosphorylation. As a consequence of mTOR silencing, ∼50% reduction in VEGF production was observed (Fig. 3B). Similarly, transfection of BT474 cells with a siRNA directed against eIF4E effectively reduced the expression of both phosphorylated and total eIF4E and resulted in a 45% reduction in VEGF production under normoxic conditions (Fig. 3C and D). Conversely, siRNA-mediated silencing of p70S6K had only a modest (19 ± 8% reduction) effect on VEGF production (data not shown). Altogether, these findings support the notion that mTOR plays a pivotal role in the regulation of VEGF production in breast cancer cells and identify the cap-binding protein eIF4E as a relevant downstream mediator of such potentially antiangiogenic effect, consistent with recent evidence that antisense oligonucleotide-mediated down-regulation of eIF4E decreases the expression of angiogenic factors, such as VEGF, in other cellular models (20).
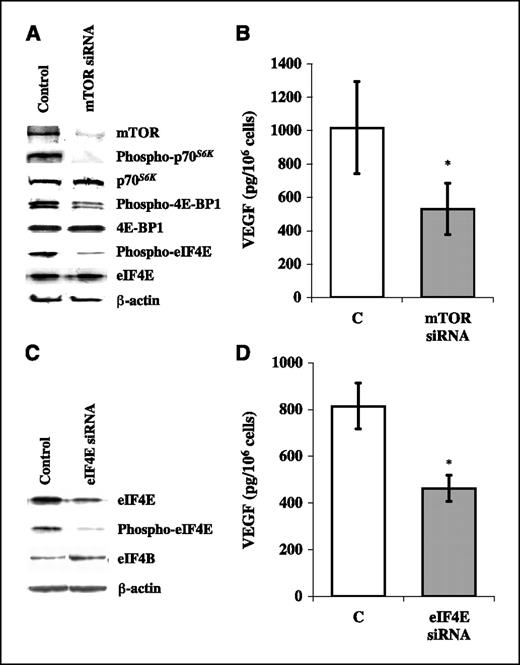
Effects of the siRNA-mediated silencing of mTOR and eIF4E protein expression on VEGF protein expression in BT474 breast cancer cell line. A, Western blot analysis of mTOR, p70S6K, 4E-BP1, eIF4E protein expression and phosphorylation. B, VEGF protein expression evaluated by ELISA in conditioned medium of BT474 cells transfected with siRNA directed against mTOR C. Western blot analysis of eIF4E protein expression and phosphorylation (immunoblot for eIF4B is a control of the specificity of siRNA-mediated silencing). D, VEGF protein expression evaluated by ELISA in conditioned medium of BT474 cells transfected with siRNA directed against eIF4E. A and C, results from one of three experiments done with superimposable results. β-Actin expression is protein loading and blotting control. B and D, results are pg VEGF/106 cells/24 h. Columns, mean of three independent experiments; bars, SD. Control cells were transfected with siRNA directed against unrelated mRNA (C). mTOR or eIF4E siRNA and control (unrelated siRNA) were compared using a two-tailed Student's t test for paired samples. *, P < 0.01.
Effects of the siRNA-mediated silencing of mTOR and eIF4E protein expression on VEGF protein expression in BT474 breast cancer cell line. A, Western blot analysis of mTOR, p70S6K, 4E-BP1, eIF4E protein expression and phosphorylation. B, VEGF protein expression evaluated by ELISA in conditioned medium of BT474 cells transfected with siRNA directed against mTOR C. Western blot analysis of eIF4E protein expression and phosphorylation (immunoblot for eIF4B is a control of the specificity of siRNA-mediated silencing). D, VEGF protein expression evaluated by ELISA in conditioned medium of BT474 cells transfected with siRNA directed against eIF4E. A and C, results from one of three experiments done with superimposable results. β-Actin expression is protein loading and blotting control. B and D, results are pg VEGF/106 cells/24 h. Columns, mean of three independent experiments; bars, SD. Control cells were transfected with siRNA directed against unrelated mRNA (C). mTOR or eIF4E siRNA and control (unrelated siRNA) were compared using a two-tailed Student's t test for paired samples. *, P < 0.01.
Consistent with the observed reduction in VEGF production, exposure of HUVEC to the conditioned medium of temsirolimus-treated BT474 cells resulted in a dose-dependent reduction in cell proliferation compared with untreated BT474 cells (data not shown). To assess whether temsirolimus also directly inhibits endothelial cell functions involved in angiogenesis, we next investigated its effects on endothelial cell proliferation, apoptosis, and morphogenesis in vitro and vessel formation in a Matrigel plug assay in vivo. As shown in Fig. 4A, temsirolimus significantly (P < 0.05) and dose dependently inhibited the proliferation of serum-stimulated HUVEC; similar results were obtained using the human endothelial cell line EA.hy926 (data not shown). Temsirolimus caused accumulation of HUVEC in the G1 phase of the cell cycle, with concomitant depletion of S-phase cells, while inducing little or no apoptosis (data not shown). When plated on Matrigel and stimulated with VEGF, HUVEC aligned with one another and formed tube-like structures resembling a capillary plexus; conversely, the addition of temsirolimus (50 nmol/L) severely impaired alignment and tube formation, resulting in isolated and rounded endothelial cells, closely resembling control cells (Fig. 4B). Moreover, the addition of temsirolimus (50 nmol/L) to Matrigel plugs completely inhibited VEGF-stimulated vessel formation in vivo, as assessed qualitatively by macroscopic analysis (Fig. 4C) and quantitatively by measuring the Hb content of the excised Matrigel plugs (Fig. 4D).
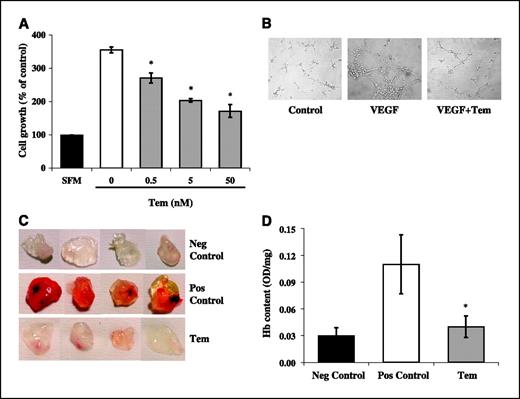
Effects of temsirolimus on in vitro endothelial cell proliferation and morphogenesis and in vivo vessel formation in a Matrigel assay. A, exponentially-growing HUVEC were seeded and incubated for 24 hours in complete medium. Next, cells were starved for 24 hours in serum-free medium and then incubated in either serum-free (black column) or complete medium in the presence (gray columns) or absence (white column) of temsirolimus at the indicated concentrations. Cell proliferation was evaluated after 72 hours by crystal violet reduction assay. Results are percentage of cell growth relative to serum-free medium negative control (SFM, 100%). Columns, mean of three independent experimentas; bars, SD. Untreated and temsirolimus-treated samples were compared using a two-tailed Student's t test for paired samples (*, P ≤ 0.02). B, HUVEC were plated in Matrigel-coated wells and incubated for 8 hours in serum-free medium (control), in medium supplemented with 50 ng/mL VEGF165, or in medium containing VEGF and 50 nmol/L temsirolimus (VEGF+Tem). Cells were then photographed using an inverted phase-contrast photomicroscope (×10 magnification). Representative of one of three experiments done with superimposable results. Each condition was tested in triplicates for each individual experiment. In vivo vessel formation was assessed after injection of C57BL/6 mice with Matrigel plugs containing (Pos Control) or not containing (Neg Control) VEGF165 at the concentration of 60 ng/mL, or containing VEGF and temsirolimus at the concentration of 50 nmol/L (Tem). After 5 days, mice were sacrificed, and neovascularization and Hb content of Matrigel plugs were evaluated by macroscopic analysis (C) and measurement of Hb content (D) of Matrigel plugs, respectively. Representative of one of three experiments done with superimposable results. Hb content is expressed as absorbance (OD)/100 mg Matrigel plug. *, P = 0.02, positive control versus temsirolimus (Student's t test).
Effects of temsirolimus on in vitro endothelial cell proliferation and morphogenesis and in vivo vessel formation in a Matrigel assay. A, exponentially-growing HUVEC were seeded and incubated for 24 hours in complete medium. Next, cells were starved for 24 hours in serum-free medium and then incubated in either serum-free (black column) or complete medium in the presence (gray columns) or absence (white column) of temsirolimus at the indicated concentrations. Cell proliferation was evaluated after 72 hours by crystal violet reduction assay. Results are percentage of cell growth relative to serum-free medium negative control (SFM, 100%). Columns, mean of three independent experimentas; bars, SD. Untreated and temsirolimus-treated samples were compared using a two-tailed Student's t test for paired samples (*, P ≤ 0.02). B, HUVEC were plated in Matrigel-coated wells and incubated for 8 hours in serum-free medium (control), in medium supplemented with 50 ng/mL VEGF165, or in medium containing VEGF and 50 nmol/L temsirolimus (VEGF+Tem). Cells were then photographed using an inverted phase-contrast photomicroscope (×10 magnification). Representative of one of three experiments done with superimposable results. Each condition was tested in triplicates for each individual experiment. In vivo vessel formation was assessed after injection of C57BL/6 mice with Matrigel plugs containing (Pos Control) or not containing (Neg Control) VEGF165 at the concentration of 60 ng/mL, or containing VEGF and temsirolimus at the concentration of 50 nmol/L (Tem). After 5 days, mice were sacrificed, and neovascularization and Hb content of Matrigel plugs were evaluated by macroscopic analysis (C) and measurement of Hb content (D) of Matrigel plugs, respectively. Representative of one of three experiments done with superimposable results. Hb content is expressed as absorbance (OD)/100 mg Matrigel plug. *, P = 0.02, positive control versus temsirolimus (Student's t test).
Our data show that temsirolimus exerts antiangiogenic effects, at least in part, by directly inhibiting endothelial cell functions, such as proliferation and morphogenesis. These results are consistent with previous reports indicating that temsirolimus parent compound, rapamycin, inhibits VEGF-stimulated endothelial cell proliferation and tube formation (5). However, temsirolimus inhibitory effects on serum- and VEGF-stimulated endothelial cell functions were already detectable in normoxic conditions, whereas previous reports have suggested that rapamycin may selectively abrogate hypoxia-mediated amplification of growth factor–stimulated vascular cell proliferation, with no effect on proliferation under normoxia (6).
Overall, our results indicate that temsirolimus may potently inhibit angiogenesis by multiple mechanisms: (a) indirectly, through transcriptional inhibition of hypoxia-stimulated, HIF-1α–dependent VEGF production by breast cancer cells and (b) directly, through inhibition of endothelial cell functions involved in neoangiogenesis, such as growth factor–stimulated proliferation and morphogenesis. In agreement with recent evidence indicating that mTOR inhibition by temsirolimus impairs tumor-driven angiogenesis in myeloma models in vivo (21), these data strongly suggest that temsirolimus antiangiogenic properties may also importantly contribute to the antitumor activity observed with this compound in preclinical models of breast cancer as well as in breast cancer patients in the clinical setting (4).
Acknowledgments
Grant support: Italian Ministry of Health (D. Del Bufalo and M. Milella), Italian Association for Cancer Research (D. Del Bufalo and M. Milella); and fellowship from the Italian Foundation for Cancer Research (L. Ciuffreda and D. Trisciuoglio).
The costs of publication of this article were defrayed in part by the payment of page charges. This article must therefore be hereby marked advertisement in accordance with 18 U.S.C. Section 1734 solely to indicate this fact.
We thank Wyeth-Ayerst Research for kindly providing temsirolimus (CCI-779), Dr. Amato J. Giaccia (Stanford University, Stanford, CA) for kindly providing the VEGF promoter constructs, and Dr. Cora J. Eagell (University of North Carolina at Chapel Hill, Chapel Hill, NC) for kindly providing EA.hy926 cells.