Abstract
Lithium (Li) batteries comprising multivalent positive active materials such as copper vanadium oxide have high theoretical capacity. These batteries with a conventional liquid electrolyte exhibit limited cycle life because of copper dissolution into the electrolyte. We report here on the characterization of solid-state Li metal batteries with a positive electrode based on α-Cu6.9V6O18.9 (α-CuVO3). We replaced the liquid electrolyte by a nanostructured solid block copolymer electrolyte comprising of a mixture of polystyrene-b-poly(ethylene oxide) (SEO) and lithium bis(trifluoromethanesulfonyl)imide (LiTFSI) salt. In situ X-ray diffraction was used to follow the Li insertion/de-insertion mechanism into the α-CuVO3 host material and its reversibility. In situ X-ray scattering revealed that the multistep electrochemical reactions involved are similar in the presence of liquid or solid electrolyte. The capacity fade of the solid-state batteries is less rapid than that of α-CuVO3–Li metal batteries with a conventional liquid electrolyte. Hard X-ray microtomography revealed that upon cycling, voids and Cu-rich agglomerates were formed at the interface between the Li metal and the SEO electrolyte. The void volume and the volume occupied by the Cu-rich agglomerates were independent of C-rate and cycle number.
Export citation and abstract BibTeX RIS

This is an open access article distributed under the terms of the Creative Commons Attribution 4.0 License (CC BY, http://creativecommons.org/licenses/by/4.0/), which permits unrestricted reuse of the work in any medium, provided the original work is properly cited.
There is considerable interest in copper vanadium oxide (CuVO) positive electrodes for rechargeable lithium (Li) batteries. In principle, this material can exhibit high capacity due to multistep electrochemical reactions with Li+ ions. In pioneering work, Yamaki and coworkers reported on reversible Li insertion and removal in CuVO compounds.1–3 They showed that a battery comprising a Li metal negative electrode, β-Cu2V2O7 positive electrode, and a conventional liquid electrolyte (a mixture of LiClO4 in propylene carbonate and dimethoxyethane) could be cycled 100 times at 0.5 mA/cm2, with an average delivered capacity of 260 mAh/g. The battery failed abruptly due to a short which was attributed to the deposition of Cu metal on the Li electrode. These studies spark considerable interest in CuVO electrodes.4–17
In a more recent study, Morcrette et al. showed reversible insertion of 6 Li into Cu2.33V4O11 through a reversible Cu extrusion–insertion process.18 During the discharge step, the Li+ ions enter the host material and the copper ions are pushed to the material edges where they are reduced, forming Cu metal dendrites. During the charge step, Cu metal is oxidized, producing copper ions that re-enter the host material. This original study opened a new class of CuVO materials.19–21 However, for practical applications, battery failure due to dissolution of Cu into the liquid electrolyte and subsequent plating on the Li electrode needs to be addressed.
The potential to use poly(ethylene oxide) (PEO) as an electrolyte in Li batteries was demonstrated by Fenton et al.22 and Armand et al.23,24 While most of the studies on PEO-based electrolytes employ univalent Li salts,25–27 some researchers have also explored multivalent salts with Cu2+ cations.28–32 Mixtures of Cu salts and PEO exhibit reasonable conductivities, but very low cation transference numbers. The problem of Cu dissolution and migration in CuVO-containing batteries may be mitigated by using PEO-based electrolytes. We note in passing that Morcrette et al. used a solid polymer electrolyte (probably PEO-based) to study the reversible formation of Cu dendrites in a CuVO electrode by in situ scanning electron microscopy.18
Another problem with batteries containing a Li metal negative electrode is the formation of Li dendrites.33,34 This can be mitigated by using high modulus solid electrolytes. Li metal batteries containing PEO-based electrolytes are usually operated at temperature above the PEO melting temperature; the conductivity of crystalline PEO electrolyte is too low for practical applications. Unfortunately the modulus of rubbery PEO is too low for suppression of Li metal formation.35–37 One approach to resolve this problem is the use of a nanostructured block copolymer electrolyte with rigid non-conducting domains and rubbery-conducting domains.37–42
This study reports on the characterization of batteries comprising a Li metal negative electrode, a nanostructured block copolymer electrolyte film made by mixing polystyrene-b-poly(ethylene oxide) (SEO) and lithium bis(trifluoromethanesulfonyl)imide (LiTFSI), and α-Cu6.9V6O18.9 (α-CuVO3 for simplicity) as positive active material. The composite positive electrode contains α-CuVO3 mixed with SEO electrolyte and carbon black. Crystallographic changes in α-CuVO3 during the lithiation/de-lithiation processes were monitored by in situ synchrotron X-ray diffraction. Battery cycle life was studied as a function of current density. We compared capacity fade of our all-solid α-CuVO3 batteries with α-CuVO3 batteries made with a conventional liquid electrolyte. After cycling, the use of hard X-ray microtomography enables direct identification of battery failure modes.
Experimental
Electrolyte preparation
The polystyrene-b-poly(ethylene oxide) (SEO) block copolymer was synthesized by sequential anionic polymerization as described previously.43,44 The number-averaged molecular weights of the polystyrene and poly(ethylene oxide) are 240 and 260 kg/mol, respectively, with an overall dispersity index of 1.23. Inside an argon filled MBraun glove box with ultralow concentrations of water and oxygen, the SEO copolymer was dried in the antechamber under vacuum at 90°C for a day, while the lithium bis(trifluoromethanesulfonyl)imide (LiTFSI, Novolyte) was dried in the same manner at 120°C for three days. A mixture of SEO and LiTFSI was dissolved in N-methyl-2-pyrrolidone (NMP 99.5% under argon, EMD Millipore) and stirred at 90°C for several hours. The molar ratio (r) of Li+ to ethylene oxide moieties in the electrolyte was 0.085.44 After homogenization, the solution was cast on a nickel (Ni) foil (All Foils, Inc.) using a doctor blade (Gardco) and a home-built casting device in the glove box. An electrolyte film was obtained by drying at 65°C for 12 h. The membrane was then peeled off from the Ni foil and dried overnight in the glove box antechamber under vacuum at 90°C. In spite of using the same process, electrolyte films obtained on different days varied in thickness (lSEO) from 12 to 44 μm. Small changes in the leveling of the casting apparatus, fluctuation in room temperature, and other factors seems to affect the final film thickness that we obtained.
Synthesis of the α-CuVO3 material
Solid state chemistry was used to synthesize the pure phase α-Cu6.9V6O18.9 (α-CuVO3 for simplicity). A mixture of Cu2O and V2O5 (99.9%, Sigma Aldrich) in a 1.0: 0.9 molar ratio was ball milled for 30 minutes in a planetary ball mill device (LC-106A, Gilson) at 300 rpm. The resulting powder was pressed at 5 GPa forming a 10 mm diameter pellet and sintered at 250°C for several hours under Argon atmosphere. The pellet was cooled down to room temperature and ground in a mortar. A final heat-treatment was performed by annealing the sample at 495°C under Argon atmosphere for 8 hours prior cooling it down to room temperature. The as-synthesized α-CuVO3 sample was ball milled for two hours to decrease its particle size. α-CuVO3 has a rhombohedral crystal structure (space group: R-3 (148)), with lattice parameters of a = 12.855 Å and c = 7.194 Å. This is in good agreement with established crystallographic data on α-CuVO3 and very close to that of Cu7V6O19 based materials.45,46 In addition, the material has a gravimetric density of 5.07 g/cm3 while the unit cell volume of α-CuVO3 and lithiated α-CuVO3 are 1033 and 1060 Å3, respectively. Note, for the latter volume the Cu metal is not included. The α-CuVO3 thus has a 2.6% volume expansion upon lithiation.
Electrode preparation and battery assembly
The α-CuVO3 powder was dried for three days in the glove box antechamber at 120°C prior use. Inside the glove box an SEO/LiTFSI solution with r = 0.085 in NMP solvent was stirred at 90°C with α-CuVO3 and carbon black (Denka). The formulation of the positive electrode was 70 wt% α-CuVO3, 25 wt% SEO/LiTFSI (r = 0.085), and 5 wt% carbon black. The resulting slurry was then thoroughly mixed in a homogenizer (Kinematica) at 19,000 rpm. The slurry was cast on a 20 μm thick electrochemical grade aluminum (Al) foil using a doctor blade and the home-built caster. The electrode was dried overnight at 60°C, followed by further drying at 90°C in the glove box antechamber under vacuum for 12 h. Inside the glove box, a 1.1 cm diameter disk was punched from the positive electrode and pressed at 90°C and 29,000 psi several times to reduce its porosity. The α-CuVO3 loading was, on average, 2.4 ± 0.4 mg/cm2, with an average electrode thickness of 15 ± 3 μm. The electrode disk was hand-pressed at 90°C onto a 1.43 cm diameter SEO electrolyte disk. Then a 1.27 cm diameter Li disk was pressed onto the electrolyte. Al and Ni tabs were taped on the α-CuVO3 and Li electrodes, respectively, and the assembly was vacuum sealed (Packaging Aids Corp) in an Al-laminated pouch bag (Showa Denko).
Battery cycling
After assembly inside the glove box, battery replicates were transferred into a 90°C oven connected to a Maccor cycler where they were heated overnight prior to any cycling. The battery cycling rate is reported in terms of C/n where n is the number of hours used to fully charge or discharge the battery during the first cycle. Five conditioning charge-discharge cycles were performed at an approximate rate of C/20 for all the batteries. Batteries were then cycled at the C-rate of interest. All potentials reported in this article are relative to the Li+/Li° couple. Charging was done using a constant current (I) until the battery potential (E) reached 3.6 V because the electrochemical window stability of the SEO electrolyte is about 4 V. The constant current step was followed by a constant voltage step at 3.6 V and this step was stopped when the current was 0.1 × I. After a 1 h rest period, a discharge current identical to the charge current was applied until the potential reached 2 V, followed by a 1 hour rest period. Batteries were examined at C/50, C/20, C/4, and C/3. For the batteries cycled at C/20 a second C/20 discharge step was executed after the first discharge step. This final discharge step was conducted to distinguish between capacity fade due to transport limitations within the α-CuVO3 electrode and that due to irreversible changes in the battery. The capacity related to this final discharge step was negligible (1.3 ± 0.4% of the total discharge capacity). For batteries cycled at C/50, a constant voltage step at 2 V was added after the constant current discharge step until the current returned to 0.1 × I to see any discharge capacity gain. The capacity related to this constant voltage discharge step was negligible (2.5 ± 1.1% of the total discharge capacity). A typical charge-discharge profile is shown in Figure 1 where battery potential (E) obtained during the charging and discharging steps, and rest steps is plotted versus time (t) for one C/20 cycle. For completeness E as a function t for a C/50 and a C/3 cycle is given in Figure S1.
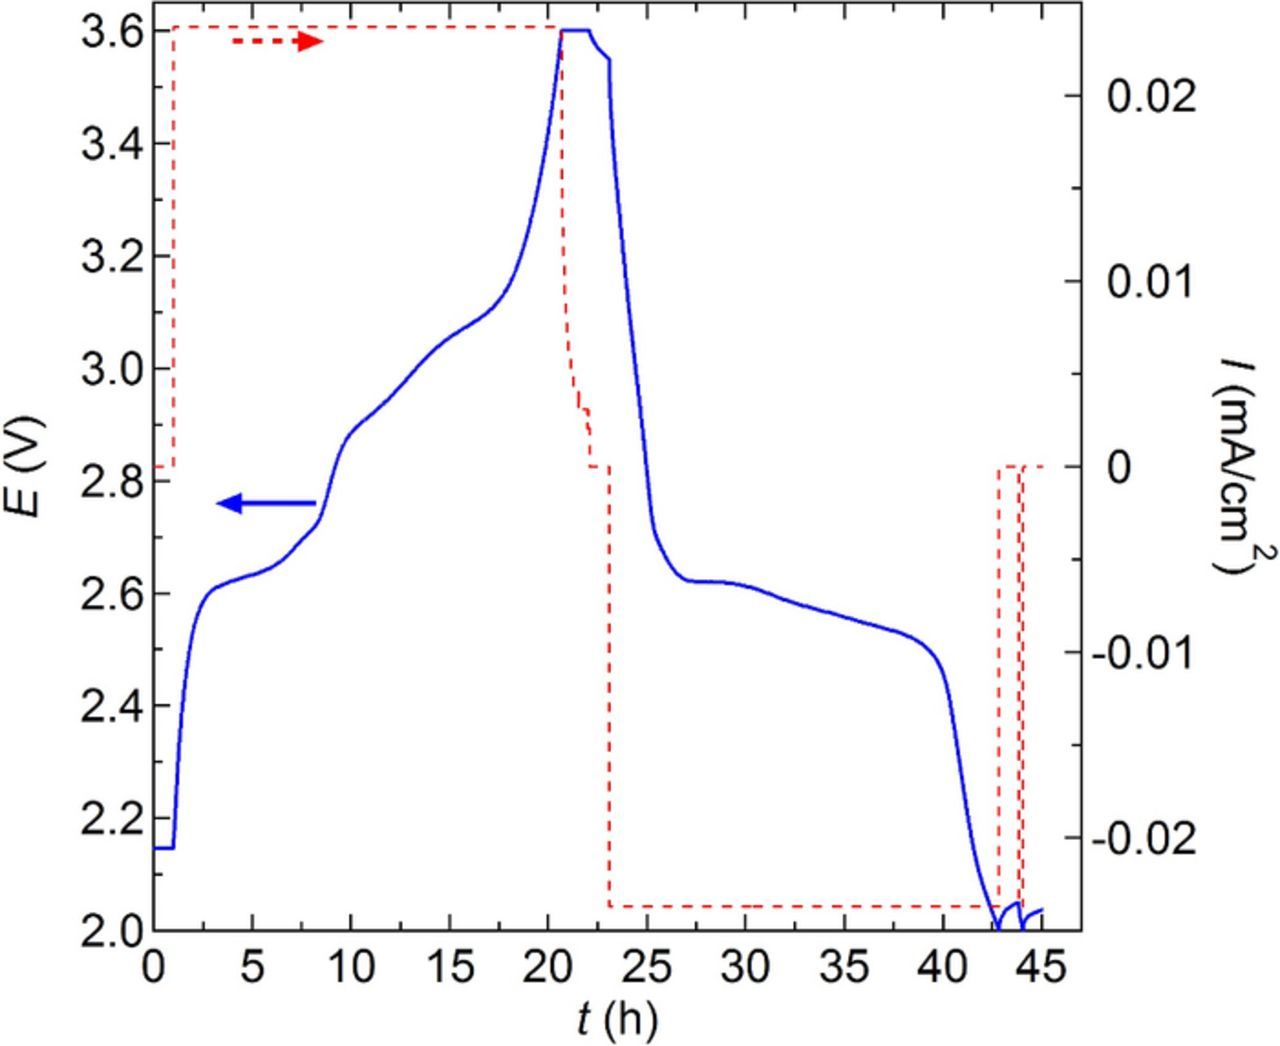
Figure 1. Battery cycling potential, E, and current density, I, versus time, t, for a C/20 charge, C/20 discharge, followed by a second C/20 discharge at 90°C. A 1 h rest period occurs in between each step.
For each cycle, the charge (Qc) and discharge (Qd) capacities normalized by the estimated mass (g) of α-CuVO3 in the positive electrode (using the measured mass of each electrode disks and assuming constant composition) was calculated by integrating the current over time (mA.h). For consistency, only the first constant current discharge step was used to calculate Qd for the C/50 and C/20 batteries. The Coulombic efficiency (η) in percent is defined by:
![Equation ([1])](https://content.cld.iop.org/journals/1945-7111/163/10/A2447/revision1/d0001.gif)
Wide-angle X-ray scattering
The crystal structure of the α-CuVO3 pristine powder was determined by ex situ wide-angle X-ray scattering (WAXS) at the Advanced Light Source beamline 7.3.3 at the Lawrence Berkeley National Laboratory using a 10 keV monochromatic X-rays.47 Inside the glove box, the powder was hand-pressed into a 150 μm thick fiberglass Garolite-10 spacer with a 3.175 mm diameter hole at room temperature to form a dense pellet. The pellet was sealed off in a custom-designed airtight sample holder with Kapton windows and heated overnight at 90°C in the glove box antechamber under vacuum. Another sample without the powder was prepared in the same manner and used as a blank. The evolution of the crystal structure of α-CuVO3 during a battery cycle was studied by in situ WAXS. The samples were similar to the pouched batteries with the precaution that the battery tabs needed to be attached to the edges of the electrodes to ensure electrical contact without blocking the path of the X-rays. After assembly, four battery replicates were preconditioned at 90°C by using five C/20 cycles and taken to the WAXS instrument in the discharged state.
The samples were placed in a custom heating stage and the battery tabs were connected to a multipotentiostat VMP3 (Bio-Logic SAS). A Dectris Pilatus 2 M detector with a pixel size of 0.172 mm × 0.172 mm was used to acquire WAXS data in transmission mode. The distance between the sample and detector, and the scattering vector coordinate were determined by calibrating the diffraction images with a silver behenate reference.47 The pristine α-CuVO3 material was studied at room temperature and at 90°C. The batteries were studied during one charge-discharge cycle at a current density corresponding to a C/4 rate at 90°C. For all the samples, after a 2 seconds exposure time, a 1D scattering profile was obtained by azimuthally averaging the 2D scattering patterns using the Igor Pro software with the Nika macro.48 The scattering profiles are presented as scattering intensity (Is) subtracted from the blank sample using the Nika macro, as a function of the scattering wave vector magnitude (q) as defined by:
![Equation ([2])](https://content.cld.iop.org/journals/1945-7111/163/10/A2447/revision1/d0002.gif)
where λ is the wavelength of the X-rays (0.124 nm) and θ is the scattering angle.
Hard X-ray microtomography
Hard X-ray microtomography permits imaging of pouch cells to study effects such as interface delamination and dendrite growth without taking the cells apart. The tomography samples were prepared by methods described in reference.49 After cycling, the batteries were disassembled inside the glove box. A 3.175 mm diameter punch was used to cut out a small portion of the batteries and resealed in a pouch bag. The same procedure was used to prepare samples of uncycled batteries that were heated overnight at 90°C. The samples were transferred to the hard X-ray microtomography beamline 8.3.2 at the Advanced Light Source at the Lawrence Berkeley National Laboratory.50 The samples were illuminated at room temperature using monochromatic hard X-rays of 25 keV energy. The X-rays radiograms were converted into visible light using a 20 μm thick LuAG scintillator. An optical microscope equipped with a sCMOS camera was used to magnify the images and convert them into digital image files. A 10× lens was used in the optical microscope, resulting in images with square pixels of length 0.64 μm. 1025 images were collected from the sample as it was continuously rotated through 180°. After data processing, the radiograph images were converted to cross-sectional slices and stacked together to create a 3D reconstruction of the samples. Reconstructions were visualized and analyzed using the Avizo software package.
Electron microscopy
After cycling, some of the batteries were returned to the glove box for disassembly. Following a previously detailed procedure, the Li electrode was recovered after dissolution of the SEO electrolyte and separation from the positive electrode.40 Then the Li electrodes were transferred to a field emission scanning electron microscope (SEM, JSM-7500F, JEOL) using a desiccator and a glove bag filled with Argon to minimize air exposure. The Li surface that faced the polymer electrolyte was imaged at a beam current of 20 μA and an accelerating voltage of 5–15 kV. Some portions of the Li electrode were characterized for atomic composition using a built-in energy-dispersive spectrometry (EDS) X-ray detector (Thermo Scientific).
Results and Discussion
The ex situ WAXS scattering profiles of the pristine α-CuVO3 measured at 30°C and 90°C are shown in Figure 2. The scattering profile of the pristine α-CuVO3 is independent of the temperature between 30°C and 90°C. These two temperatures correspond to the operating temperature of Li battery comprising either a conventional liquid electrolyte (30°C) or a solid polymer electrolyte (90°C). The three peaks between 2.2 and 2.5 Å−1 are the α-CuVO3 characteristic peaks. These peaks located at q values of 2.22, 2.23 and 2.43 Å−1 can be ascribed to the (131), (122), and (401) planes, respectively.9
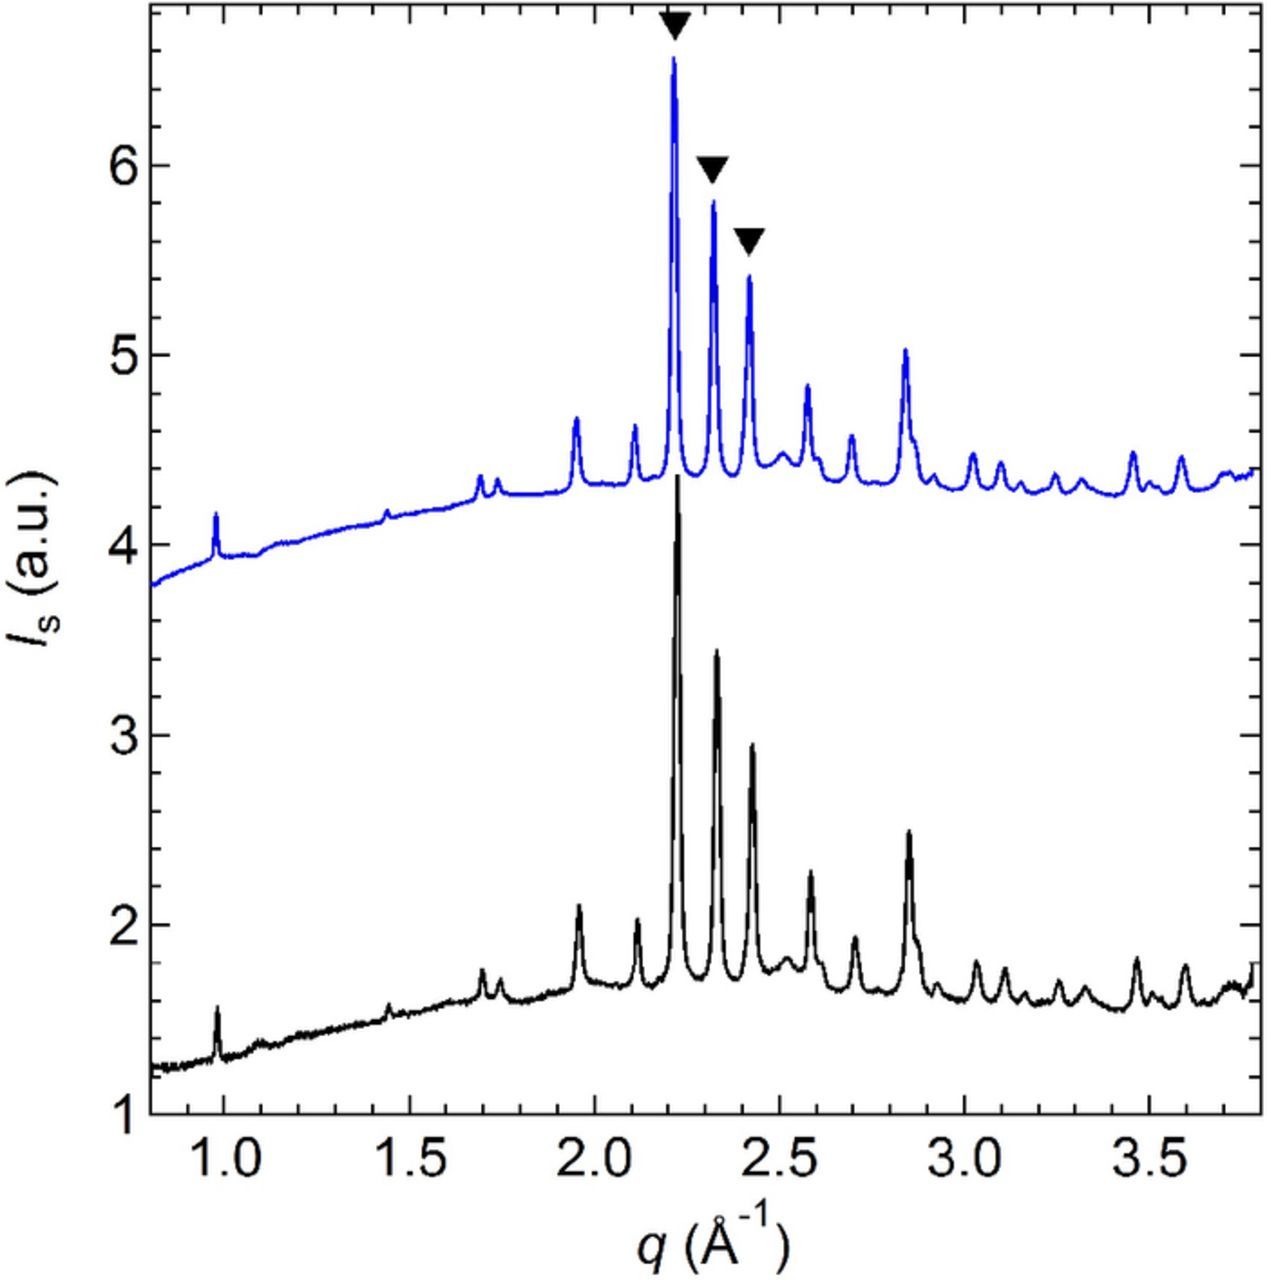
Figure 2. Ex situ WAXS scattering profile of the pristine α-CuVO recorded at (−) 30°C and (−) 90°C. The intensity at 90°C is shifted by an arbitrary factor for clarity. The characteristic peak positions of the (▾) α-CuVO3 are indicated.
The result of the in situ WAXS experiment is shown in Figure 3 for one representative battery. The battery was charged and discharged at C/4 at 90°C while WAXS patterns were collected at different times. We define the number of Li inserted/de-inserted (x) as the amount of Li in the lithiated phase LixCu6.9V6O18.9. Figure 3a shows the battery potential (E) as a function of x. Also shown in Figure 3a are the points at which WAXS spectra were acquired. Those spectra are shown in Figure 3b and the characteristic peaks position of the α-CuVO3 and those of Cu metal located at q values of 3.02 and 3.49 Å−1 are indicated. The two very intense peaks located at q values of 2.70 and 3.13 Å−1 correspond to the positive electrode Al current collector.
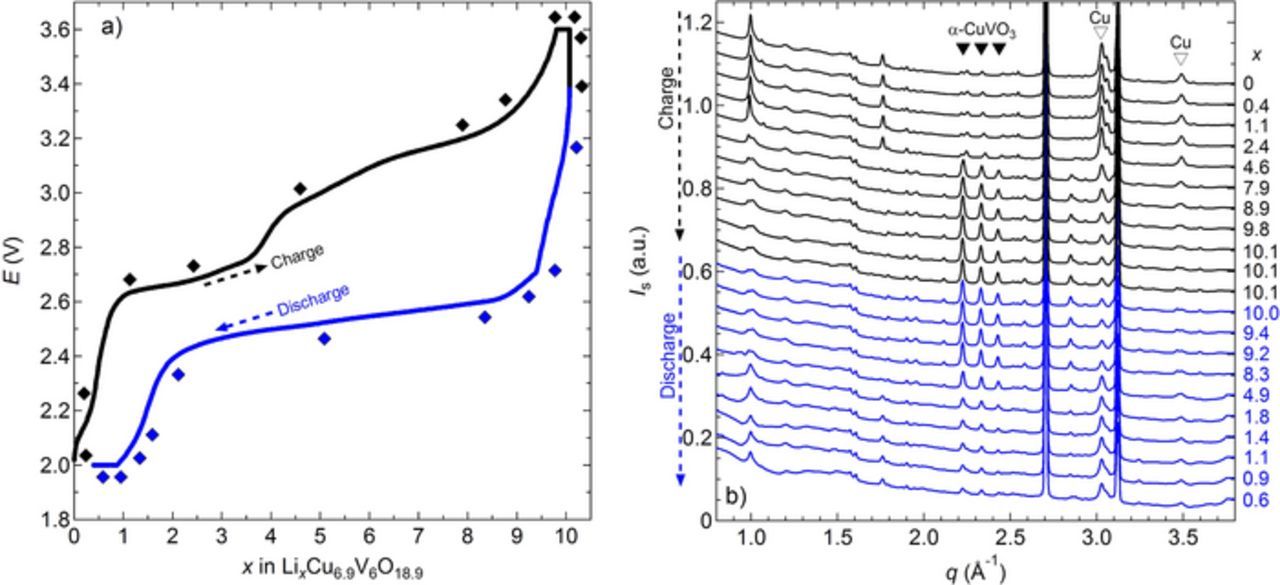
Figure 3. In situ WAXS during battery cycling at C/4 at 90°C. a) Battery potential, E, as a function of x in LixCu6.9V6O18.9. The black and blue diamond symbols correspond to WAXS spectra acquisition during the charge and discharge step, respectively. b) WAXS profile, intensity Is as a function of the scattering vector q at the different x value. The characteristic peak positions of the (▾) α-CuVO3 are indicated as well as those corresponding to (▾) Cu.
In Figure 3a, we see that during the charge step, E increases from the open circuit value of 2.0 V (the battery was initially in discharged state) until a first plateau of about 2.6 V is reached at x = 0.9. E increases slowly until x = 3.6 and then raised rapidly until a second plateau of about 2.8 V is reached. (Both plateaus have measurable slopes.) The second electrochemical process begins at x = 4.5, and reaches x = 8.3. When E reaches the 3.6 V cutoff potential, close to 10 equivalents of Li have been extracted (x = 9.8); in principle electrons may also be released by side-reactions such as oxidation of Cu metal. At the end of the constant voltage step at 3.6 V, the cell reached x = 10.1, corresponding to a charge capacity of 242 mAh/g. During the subsequent discharge E quickly drops down to 2.71 V as x decreases to 9.4, then smoothly decreases along a 2.55 V plateau ending when x is about 2. The remaining capacity is produced while the E drops rapidly to the cutoff potential of 2.0 V, showing the reversibility of the electrochemical cycle. This cycling profile is very similar to the one reported by Kamiya et al. for Cu6.7V6O18.7 in a battery containing a liquid electrolyte.9 It is evident that the charge-discharge characteristics obtained with a solid SEO electrolyte are similar to that obtained in a liquid electrolyte.
In Figure 3b, the scattering profile of the battery in the discharged state (x = 0) shows the presence of two Cu peaks, at q values of 3.02 and 3.49 Å−1. During the charge step, the Cu peak intensities decreased overall, then increased again during the discharge process. At the same time, the three α-CuVO3 characteristic peaks, located in the q interval between 2.2 and 2.5 Å−1, showed the opposite trend. To get a better understanding of the electrochemical processes occurring during this charge-discharge cycle and its reversibility, the area of the reflections corresponding to Cu metal (q = 3.02 and 3.49 Å−1) and α-CuVO3 (2.22 ≤ q ≤ 2.43 Å−1) were integrated. At a given x value, the Cu peak area was divided by that at x = 0 while the total area under the three α-CuVO3 characteristic peaks was divided by the total area of those peaks at x = 10.1. Figure 4 represents the area ratio of the Cu peak (ACu) at q = 3.02 Å−1 and the total area ratio of the α-CuVO3 (ACuVO3) characteristic peaks as a function of x. Similar plots were obtained when the q = 3.49 Å−1 peak area was used. One might expect ACuVO3 to be zero at x = 0 if the battery was fully discharged. In contrast the data in Figure 4 shows that ACuVO3 is 0.2 when x = 0. Similarly, one might except ACu to be zero at x = 10.1 if the battery was fully charged. The data in Figure 4 show that ACu is 0.2 when x = 10.1. We conclude that the five conditioning cycles resulted in small irreversible changes in the crystal structure. During the charge step, ACuVO3 follows a sigmoidal curve, increasing slowly until x = 4.6 with an average slope of 0.02. This is followed by a rapid increase in ACuVO3 until the final plateau at x = 10. The average slope in the second region is 0.12. The break between the two regimes at x = 4.6 corresponds to the transition between the two voltage plateaus identified in Figure 3a. The decrease in ACu during charge also occurs in two regimes demarcated by x = 4.6. The WAXS data provide evidence for two simultaneous processes during charge: (i) de-insertion of Li from the VO3 framework, and (ii) insertion of metallic Cu into the vanadate framework. These processes are similar to the observation in liquid electrolytes.9 After an initial plateau until x = 8.3, the discharge data in Figure 4 are also differentiated into two additional regimes demarcated by x = 2. Three regimes are also seen in the discharge curve in Figure 3a. The changes in slope in ACuVO3 and ACu (Figure 4) between x = 10.1 and 8.3 corresponds to the step decrease in E (Figure 3a). The data in Figures 3 and 4 indicate that the charge and discharge pathways are not identical. Similar conclusions are contained in reports on other Cu-based active materials.51,52 The other demarcation point seen in the discharged state in Figure 4 (x = 2) corresponds to the end of the long plateau in Figure 3a. At the end of the charge-discharge cycle, ACu is 0.951 at x = 0.6 (Figure 4). This value is less than 1 indicating that some Cu is lost during charge, probably by dissolution in the polymer electrolyte instead of reinsertion into the oxide, but the majority is reversibly returned into the host material. In other words, Cu reversibility in this cycle is estimated to be 95.1%. Based on the area ratio evolution (Figure 4) and literature data on CuVO,9,18 we propose that the discharge process occurs in two steps: (i) insertion of Li into the vacancy of the Cu site until x = 1.8 (= 10.1 −8.3), and at higher values of x, (ii) simultaneous insertion of Li in to CuVO accompanied by Cu extrusion.
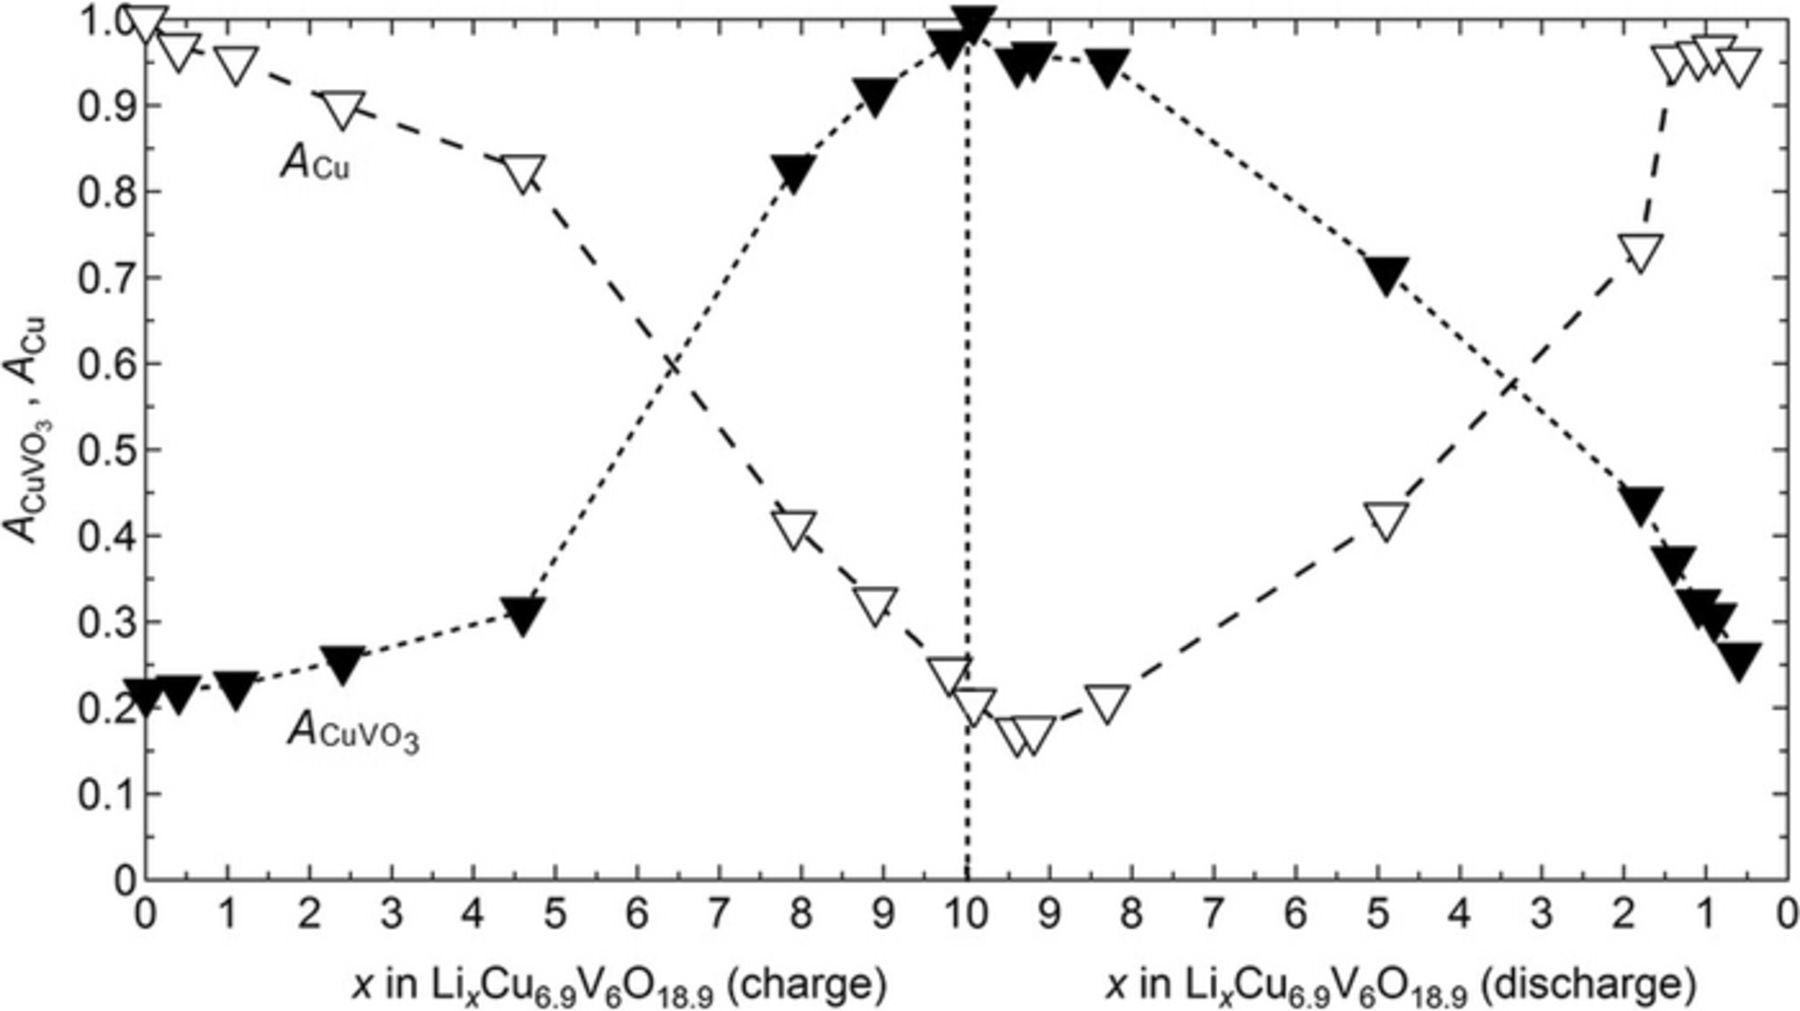
Figure 4. Area ratio of the (▾) α-CuVO3 characteristic peaks and of (▾) Cu at q = 3.02 Å−1 as function of x in LixCu6.9V6O18.9 during the charge and discharge steps. The dashed lines are guidelines for the eyes.
Battery cycle life was studied by charging and discharging battery replicates at different fixed current densities. Figure 5 represents a typical potential profile as a function of the charge and discharge capacity (Q) every 10 cycles for a battery cycled at C/20. For C/20 batteries, the first cycle charge capacity was 242.7 ± 1.9 mAh/g, while the discharge capacity was 239.9 ± 1.9 mAh/g. Qc and Qd decrease continuously with increasing cycle number (N). For the battery in Figure 5, after 150 cycles, Qd decreased by 19.7%. In addition, at a given capacity value the difference between the charge and discharge potential plateaus increases with cycle number, indicating increased polarization. For completeness, the potential profiles at C/3 and C/50 are presented as a function of Q in Figure S2. These potential profiles are qualitatively similar to data presented in Figures 5 and 3a.
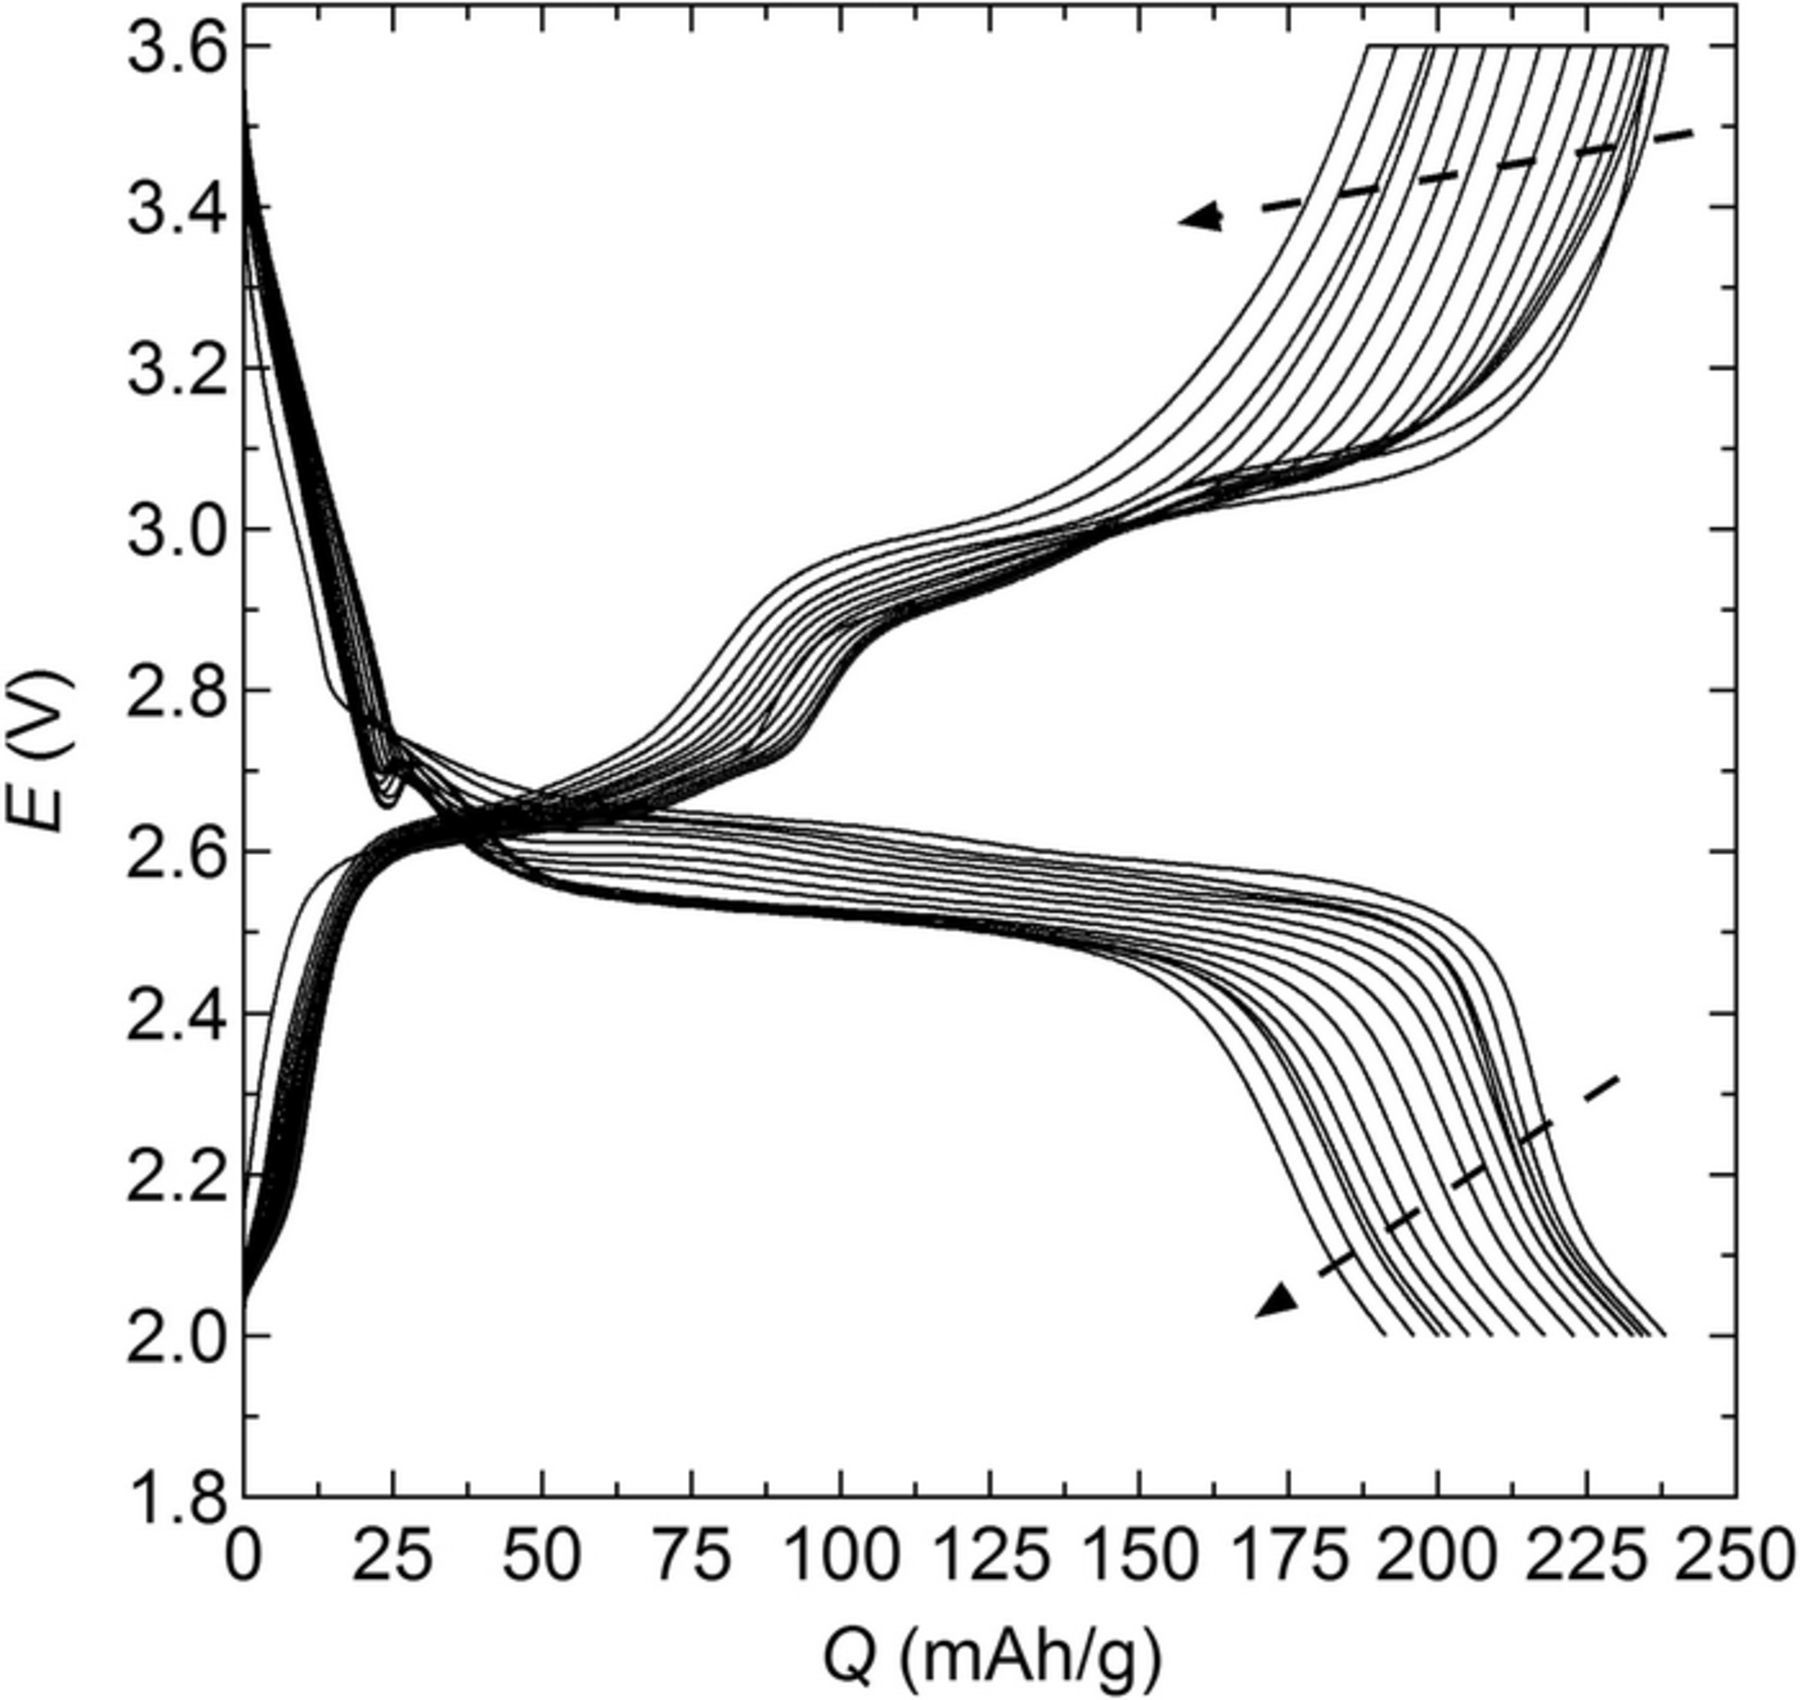
Figure 5. Battery potential, E, at C/20 as a function of the capacity, Q, every 10 cycles at 90°C.
For the different C-rates studied, Qc and Qd are plotted as a function N in Figure 6 and the inset shows the average Coulombic efficiency (η) as a function of N. For comparison, data obtained on a Li metal coin cell battery comprising a conventional liquid electrolyte, i.e. 1 M LiPF6 in ethylene carbonate and dimethyl carbonate (50:50 vol.%), is also shown in Figure 6. This battery was cycled at room temperature at C/35 using the same cutoff potentials as those used for the polymer batteries, i.e. in between 2.0 V and 3.6 V. For the liquid electrolyte based battery, the initial Qd was 342 mAh/g. After 20 cycles, 13% of the capacity was lost, and after 100 cycles, 52% of the capacity was lost. This capacity fading is mainly attributed to the dissolution of Cu from the positive electrode at each cycle. In contrast at a higher C-rate, the C/20 polymer batteries, after 20 cycles, 1.8% of the capacity was lost, and after 100 cycles, 14% of the capacity was lost. This observation suggests that Cu dissolution is much slower in polymer batteries. A deeper understanding of Cu dissolution in liquid and solid electrolyte is necessary to confirm this tentative conclusion. It is not clear if the difference in positive electrode formulation between the liquid and solid battery affects capacity fade. The dependence of Qc and Qd on N for the polymer batteries is more-or-less independent of the C-rate. At the lowest C-rate, C/50, Qd is initially 248.6 mAh/g, and decreases to 243 mAh/g after 30 cycles, which corresponds to a 97.8% capacity retention. At C/20, Qd stabilizes after 22 cycles at about 237 mAh/g, and after 50 cycles the capacity decays on average by 0.33 ± 0.14% per cycle. At C/4 and C/3, Qd drops during the first 10 cycles before stabilizing at around 217 and 159 mAh/g, respectively. The C/3 batteries were cycled up to N = 105 times with a steady discharge capacity, whose value is close to the battery based on a liquid electrolyte after 100 cycles. The two C/4 batteries failed after 17 and 31 cycles. The main difference between C/4 and C/3 batteries was the electrolyte thickness, 14 ± 2 and 33 ± 1 um, respectively.
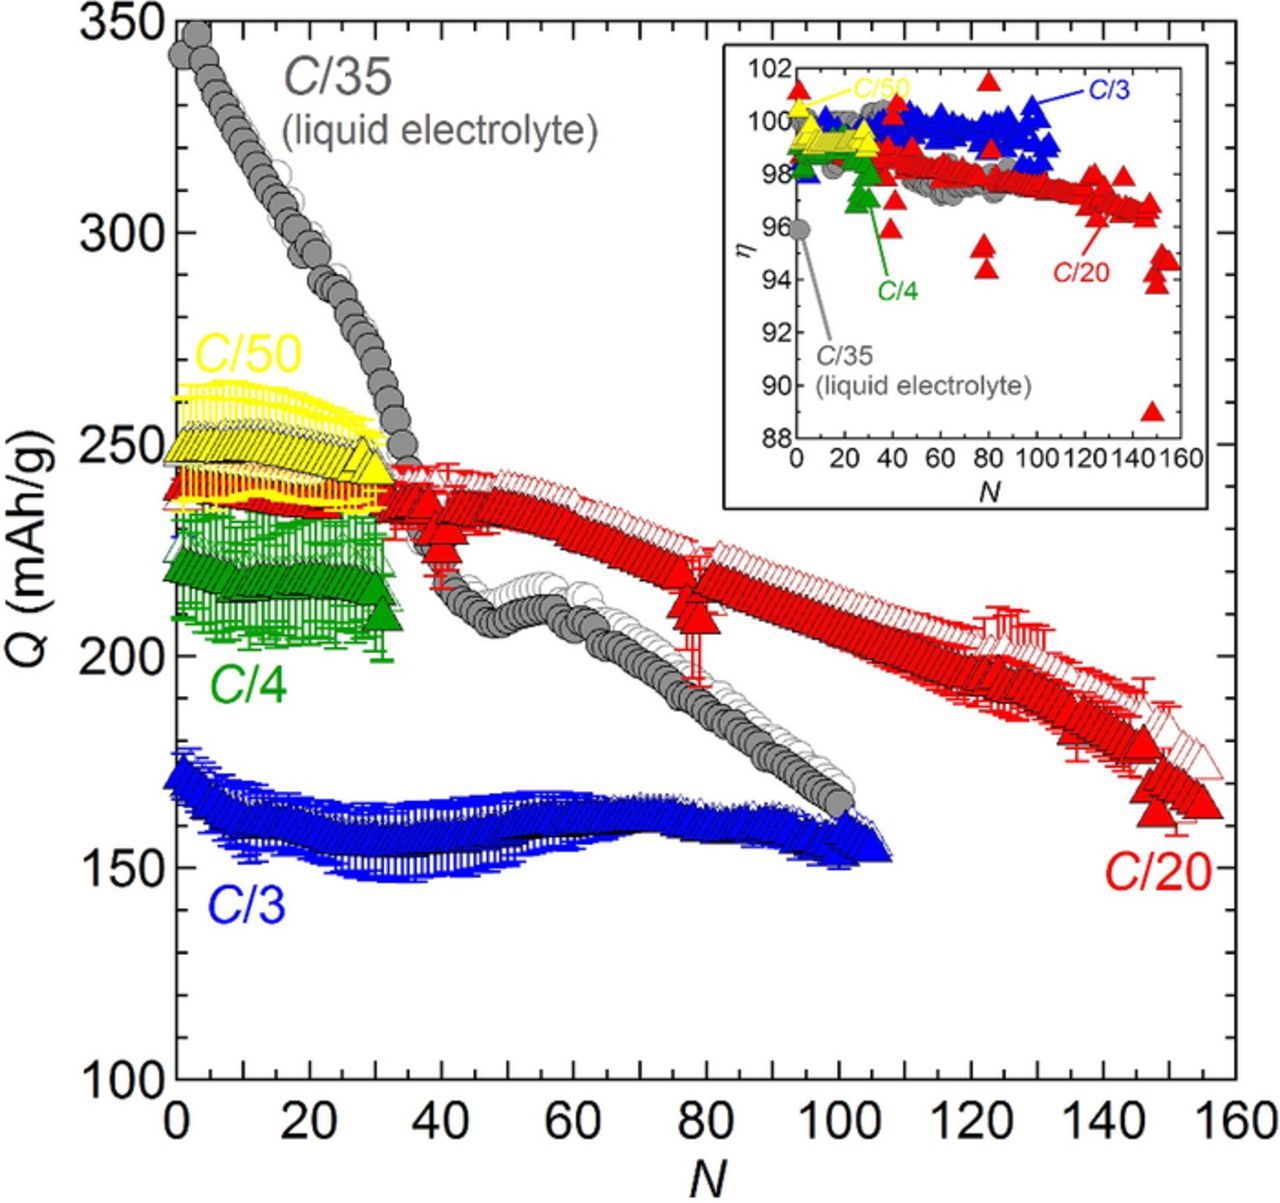
Figure 6. Charge (open symbols) and discharge (full symbols) capacity as a function of the cycle number, N, at 90°C. The initial effective C-rate is indicating and the color code corresponds to (yellow triangle) C/50, (red triangle) C/20, (green triangle) C/4, and (blue triangle) C/3. For comparison the capacity (gray circle) of a Li battery cycled at C/35 with a conventional liquid electrolyte at 30°C is also shown. The inset represents the average Coulombic efficiency (η) as a function of N.
The Coulombic efficiencies (η) at C/50, C/4 and C/3 were 99.2 ± 0.3, 98.6 ± 0.7 and 99.5 ± 0.6%, respectively (inset of Figure 6). At C/20, η was 98.6 ± 0.7% during the first 50 cycles then dropped to 94.6% in the last cycle (N = 155). For the liquid electrolyte based battery cycled at C/35, η was 98.6 ± 1.1%. The use of a solid polymer electrolyte extends the cycle life of the α-CuVO3 battery.
To get a better understanding on the capacity fade reported in Figure 6, selected batteries were imaged by hard X-ray microtomography. Figure 7 shows microtomography cross-section slices of batteries obtained at room temperature. For clarity, each cycled battery reported is labelled from A to G, and Table I summarizes their cycling condition and the point at which cycling was stopped for the tomography experiment. Also given in Table I is the total number of cycle (Ntotal) and the amount of charge passed during cycling (Cp), including the conditioning cycles. Figure 7a is an image of an uncycled battery that was heated at 90°C overnight prior being imaged at the beamline in order to observe the initial state of the battery interfaces. Four distinct layers are seen in intimate contact with each other: Li, SEO, positive electrode, and Al current collector. Note, only a small portion of the 150 μm thick Li metal is shown. Typical tomography slices of batteries after cycling at C/50 (battery B), C/20 (battery E) and C/4 (battery H and I) are shown in Figures 7b through 7e, respectively. All of the cycled batteries shown in Figure 7 were stopped in discharged state. The composite positive electrodes of all batteries were punched out of one sheet, while the SEO electrolyte used were punched out of different films which explains the qualitative difference in electrolyte thicknesses (lSEO), also listed in Table I. For comparison, batteries were also imaged in the charged state after cycling at C/50 (battery A) and C/20 (battery C); their typical cross-section slices are reported in Figure S3. There were no qualitative differences in X-ray microtomography images obtained from charged and discharged batteries.
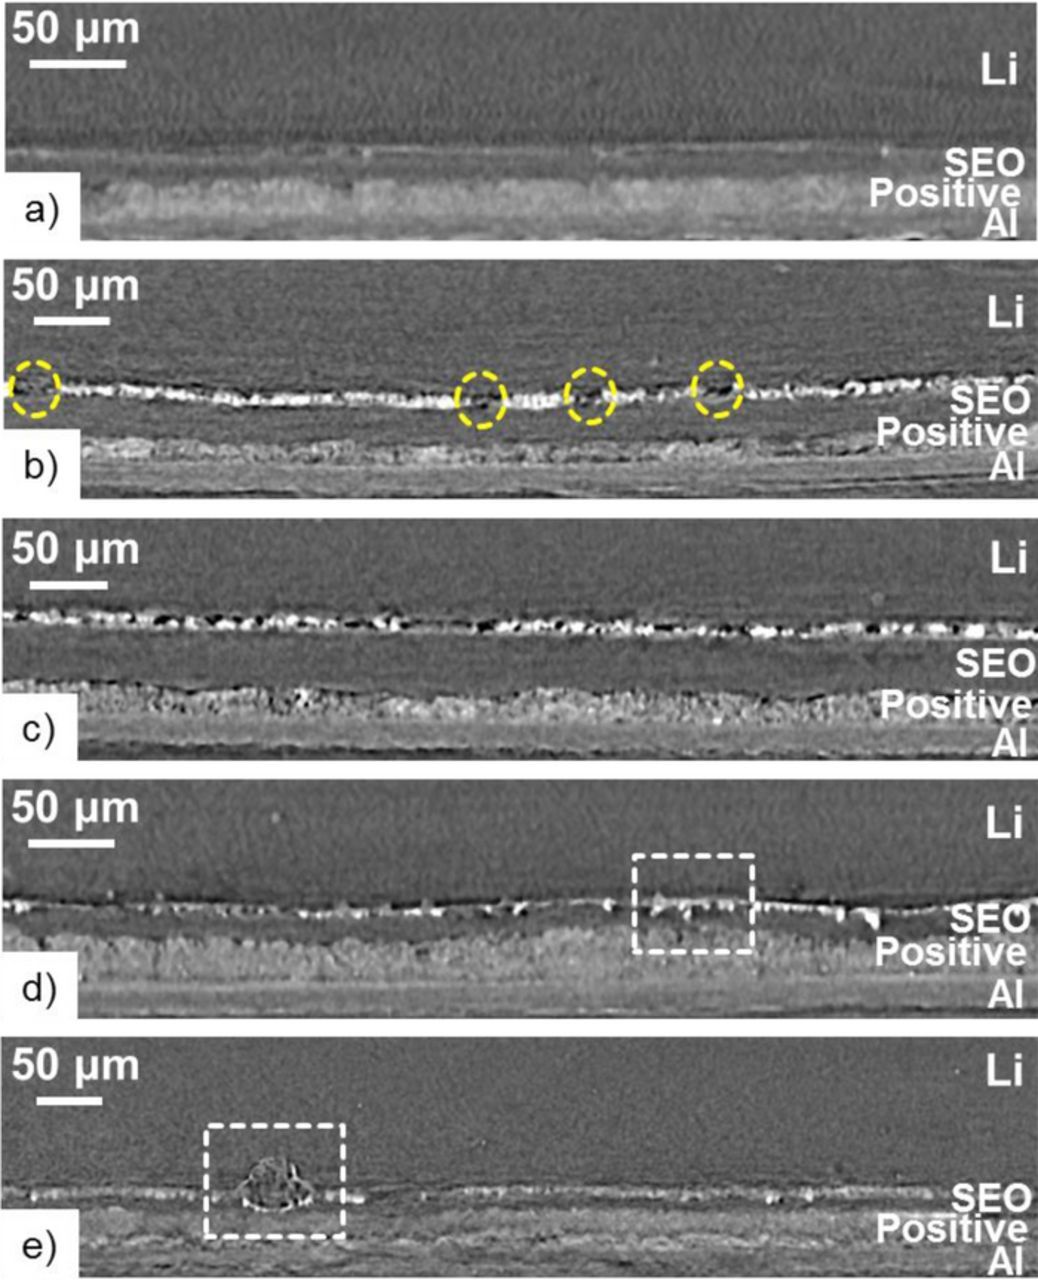
Figure 7. X-ray microtomography slices showing the cross-section of Li metal polymer batteries stopped in discharged state at room temperature. a) uncycled battery; b) battery B cycled at C/50; c) battery E cycled at C/20; d) battery H cycled at C/4 and shorted; e) battery I cycled at C/4 and shorted.
Table I. Characteristics of cycled batteries imaged by X-ray microtomography.
| Battery | A | B | C | D | E | F | G | H | I |
|---|---|---|---|---|---|---|---|---|---|
| Cycling rate | C/50 | C/50 | C/20 | C/20 | C/20 | C/20 | C/20 | C/4 | C/4 |
| Battery ending | charged | discharged | charged | charged | discharged | discharged | discharged | shorted | shorted |
| Ntotal | 43 | 41 | 157 | 86 | 157 | 164 | 78 | 47 | 26 |
| CP (C) | 101.7 | 172.3 | 489.3 | 328.4 | 587.5 | 616.5 | 279.5 | 244.4 | 112.7 |
| lSEO (μm) | 16 ± 1 | 25 ± 4 | 39 ± 2 | 42 ± 2 | 40 ± 3 | 44 ± 1 | 41 ± 1 | 16 ± 1 | 12 ± 1 |
| Vvoid (μm3) | 2.25E + 06 | 2.52E + 06 | 2.90E + 06 | 3.40E + 06 | 5.56E + 06 | 5.62E + 06 | 7.48E + 06 | 1.69E + 06 | 3.15E + 06 |
| VCu-rich (μm3) | 1.70E + 06 | 3.63E + 06 | 3.34E + 06 | 3.77E + 06 | 5.70E + 06 | 8.64E + 06 | 3.41E + 06 | 2.15E + 06 | 3.50E + 06 |
| VCuVO3 (μm3) | 3.40E + 06 | 5.76E + 06 | 5.74E + 06 | 7.13E + 06 | 9.91E + 06 | 6.41E + 06 | 7.34E + 06 | 7.25E + 06 | 7.41E + 06 |
| lLi (μm) | 1.65 | 2.91 | 2.30 | 3.19 | 2.96 | 2.81 | 2.62 | 3.86 | 3.70 |
| ΔV (μm3) | 2.06E + 06 | 3.72E + 06 | 3.47E + 06 | 4.39E + 06 | 5.69E + 06 | 3.69E + 06 | 4.55E + 06 | 4.38E + 06 | 4.30E + 06 |
| Vvoid / ΔV | 1.09 | 0.68 | 0.84 | 0.77 | 0.98 | 1.52 | 1.64 | 0.38 | 0.73 |
| VCu-rich / VCuVO3 | 0.50 | 0.63 | 0.58 | 0.53 | 0.58 | 1.35 | 0.46 | 0.30 | 0.47 |
The grayscale pixel values in Figure 7 correspond to the relative X-ray linear absorption coefficients of the material at that specific position. Brighter pixels correspond to higher X-ray absorption at that position. Thus, the positive electrodes appear brighter as they are less X-ray transmissive. The Li/SEO interface in Figure 7a is embellished by a thin dark band on the electrode side and a thin bright band on the electrolyte side. This is a result of Fresnel phase contrast arising during the imaging of samples containing interfaces.53,54 The main difference between uncycled and all the cycled batteries is that in addition to the Fresnel contrast band, darker and brighter features appear at the Li/SEO interface. The measured linear X-ray absorption coefficient in the darker features (dashed yellow circles in Figure 7b) is significantly lower than that obtained in the uncycled battery while those on the brighter features are significantly higher.
In a previous study on Li metal batteries comprising a similar SEO electrolyte and a LiFePO4 positive electrode this darker band was also observed and was attributed to a delamination of Li/SEO interface due to battery cycling.49 In addition, similar capacity fading was also observed for those batteries (0.35 ± 0.18% per cycle) which is comparable to that obtained from our α-CuVO3 batteries (0.33 ± 0.14%). We conclude that the dark bands in Figures 7b through 7e and Figure S3 indicate the emergence of voids, i.e. delamination of the Li/SEO interface. This delamination effect is seen in all batteries, independent of C-rate. We note in passing that these voids are not the result of the surface roughness of the Li metal electrodes. In references 37 and 49 we cycled symmetric Li-polymer-Li cells using Li metal electrodes with similar roughness and observed no evidence of void formation.
All the cycled batteries also show the emergence of bright features from highly absorptive elements located in between the Li metal and the electrolyte. We attribute these features of copper containing compounds. This was confirmed by imaging the Li electrode surface by SEM. The results are shown in Figure 8. The SEM image (Figure 8a) reveals the presence of disperse agglomerates all over the Li surface similar to those observed by X-ray microtomography (Figures 7b through 7e). Some of these agglomerates were characterized by EDS (inset of Figure 8a) and the corresponding spectra shown in Figure 8b, confirm the presence of Cu. In addition, Cu was not detected by EDS on the portion of Li metal free of agglomerates (Figure 8c). However, all over the surface, with or without Cu-rich agglomerates, carbon, oxygen, fluorine, and sulfur were identified. This indicates that a layer of SEO/LiTFSI polymer electrolyte remained on top of the Li metal. To estimate the chemical composition of the Cu-rich agglomerates, the linear adsorption coefficient of the bright features at the Li/SEO interface seen by hard X-ray microtomography (Figure 7) were determined. The linear adsorption coefficient of the bright features is 70.8 ± 15.1 cm−1 whereas based on the hard X-ray energy (25 keV) employed the theoretical linear adsorption coefficient of Cu metal is 157 cm−1.55 Despite a 30% uncertainty on the experimental linear adsorption coefficient due to beamline calibration errors, we conclude that Cu metal is not the sole element in the bright features at the Li/SEO interface. Based on the experimental linear adsorption coefficient and the EDS results, we propose that the agglomerates contained light elements such as lithium and oxygen in addition to copper. For example, the linear adsorption coefficient of LiCu2O2 at 25 keV is 73.2 cm−1, consistent with our measurements.56,57 Further work is needed to determine the exact composition of the agglomerates, which could in principle contain other elements such as fluorine, carbon, and nitrogen.
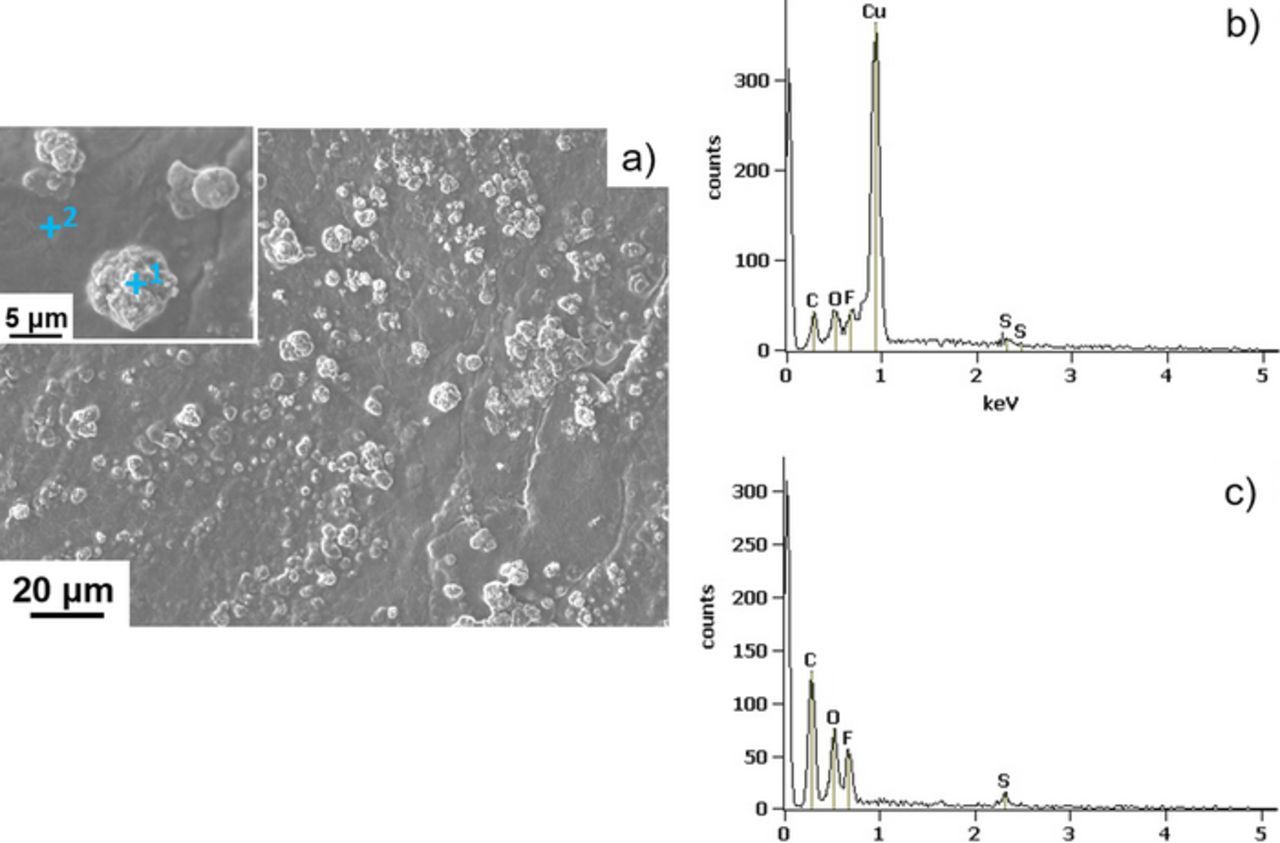
Figure 8. a) SEM image of the Li metal surface that faced the SEO electrolyte. The inset is a higher magnification image that shows the local point (point 1 and 2) where EDS analysis was performed. The corresponding EDS spectra are shown for b) point 1 and c) point 2.
Battery H, whose microtomography cross-section is shown in Figure 7d, failed after 31 cycles at C/4. In this image the Cu-rich agglomerates plated onto the Li metal electrode, punctured the thin SEO electrolyte layer, and contacted the positive electrode leading to a short. The point of contact in between the two electrodes is highlighted by a white dashed square in Figure 7d. The microtomography cross-section of battery I (Figure 7e), which failed after 17 cycles, shows a globular dendritic structure, highlighted by a white dashed square, at the Li/SEO interface that expanded through the electrolyte leading to a short. The dendrite shape is identical to that obtained in failed Li symmetric cells comprising an SEO electrolyte.37,54,58 It is evident that the use of an SEO electrolyte does not completely eliminate dendrite growth. In our previous study on Li metal polymer batteries with an LiFePO4 based positive electrode, no evidence of dendrites was found in hard X-ray microtomography images.49 Failure modes of the Li metal negative electrode in polymer batteries are clearly affected by the chemical composition of the positive electrodes (FePO4 versus α-CuVO3).
To quantify the delaminated interface and the Cu-rich agglomerate volumes, the Avizo software package was used to segment specific voxels located at the Li/SEO interface, using the procedure described in Reference 47. Voxels with brightness below a certain threshold, approximately the lowest value seen in the uncycled battery, are considered voids. Voxels with brightness higher than those seen in the uncycled batteries are assumed to be part of the Cu-rich agglomerates. The segmentation procedure was repeated on each battery imaged by hard X-ray tomography. A typical example is shown in Figure 9 for battery A. In Figure 9a we show the two orthogonal slices through the battery along the xz and yz planes before the segmentation process. The coordinate system is defined in Figure 9. The volume reconstructions of the void (Vvoid) and the Cu-rich agglomerate (VCu-rich) domains are shown in Figures 9b and 9c, respectively. The void voxels are colored blue while the Cu-rich agglomerate voxels are colored yellow. Using the same color scheme the complete volume reconstruction is shown in Figure 9d where the white region corresponds to contact area between the Li metal and the SEO electrolyte that are defect-free.
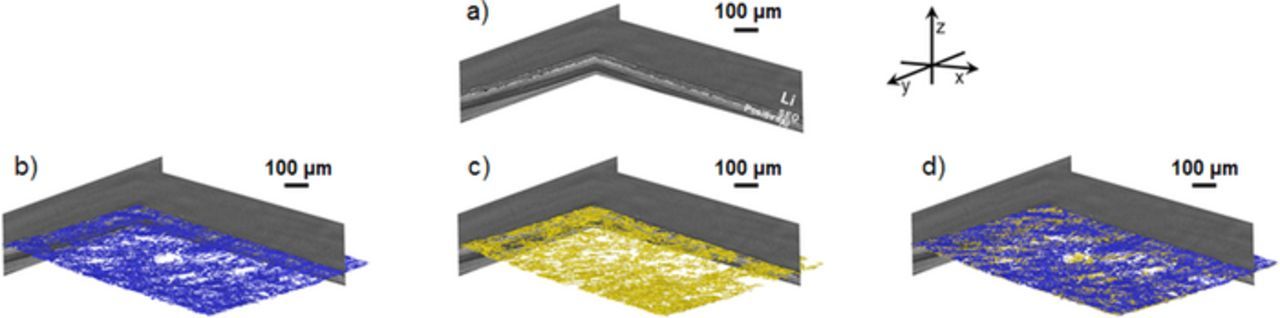
Figure 9. Microtomography image reconstruction of a cycled battery at C/20 and the segmentation method. a) X-ray microtomography slices showing the cross-section along the xz and yz planes; b) same as a) including the 3D reconstruction in blue of the void at the Li/SEO interface; c) same as a) including the 3D reconstruction in yellow of the Cu-rich agglomerates; d) same as a) including the 3D reconstruction of the void (blue) and Cu-rich agglomerates (yellow).
Table I lists Vvoid and VCu-rich for each battery obtained by X-ray microtomography and the segmentation procedure. The data corresponds to portions of batteries imaged by tomography. The volume of α-CuVO3 (VCuVO3) in the same portion of each battery was estimated using the known loading. We also estimated the amount of Li (lLi) deposited on the Li electrode during the initial charging step. This value is also reported in Table I. The difference in electrode volumes (ΔV) in the charged and discharged batteries in the observed portion of each battery can then be calculated, given the density of lithium (0.534 g/cm3) and the differences in unit cell volumes of α-CuVO3 and lithiated α-CuVO3. The value of ΔV for each battery is given in Table I. It is important to note that Vvoid, VCu-rich, VCuVO3, and ΔV are all extensive quantities determined in independent experiments. To compare data obtained from different batteries it is essential to normalize intensive quantities. The two parameters related to battery failure are Vvoid and VCu-rich. In Table I we report two intensive quantities related to these parameter: Vvoid / ΔV and VCu-rich / VCuVO3. In Figure 10 we plot Vvoid / ΔV and VCu-rich / VCuVO3 as a function of the total charge passed (Cp). It is important to note that the different batteries represented in Figure 10 were cycled using vastly different C-rates and were stopped in charged, discharged, and shorted states. In spite of these differences, Vvoid / ΔV is 0.96 ± 0.41, independent of Cp and other battery cycling parameters (see Table I). Vvoid and ΔV are, thus, comparable, a correlation which was also found in LiFePO4 polymer batteries.49 Consequently, the void formation is attributed to the lack of adhesion of the SEO electrolyte onto the Li electrode as the electrodes shrink during discharging. The plot of VCu-rich / VCuVO3 as a function of Cp shows that this ratio is also independent of Cp with an average value of 0.51 ± 0.10 (see Figure 10). In this case, we have one outlier, battery F, with VCu-rich / VCuVO3 = 1.35. We have no explanation for this outlier and the average value was calculated without this datum. We posit that the Cu-rich agglomerates are formed by dissolution of Cu into the electrolyte followed by migration and electrodeposition onto the Li metal electrode. The battery imaged before cycling contained neither voids nor Cu-rich agglomerates, i.e. Vvoid / ΔV = 0 and VCu-rich / VCuVO3 = 0. We thus conclude that the formation of voids and agglomerates happens primarily during the early cycles, 0 < Cp < 100 C. Both features appeared to be related to intrinsic characteristics of the charge-discharge cycle rather than continued cycling.
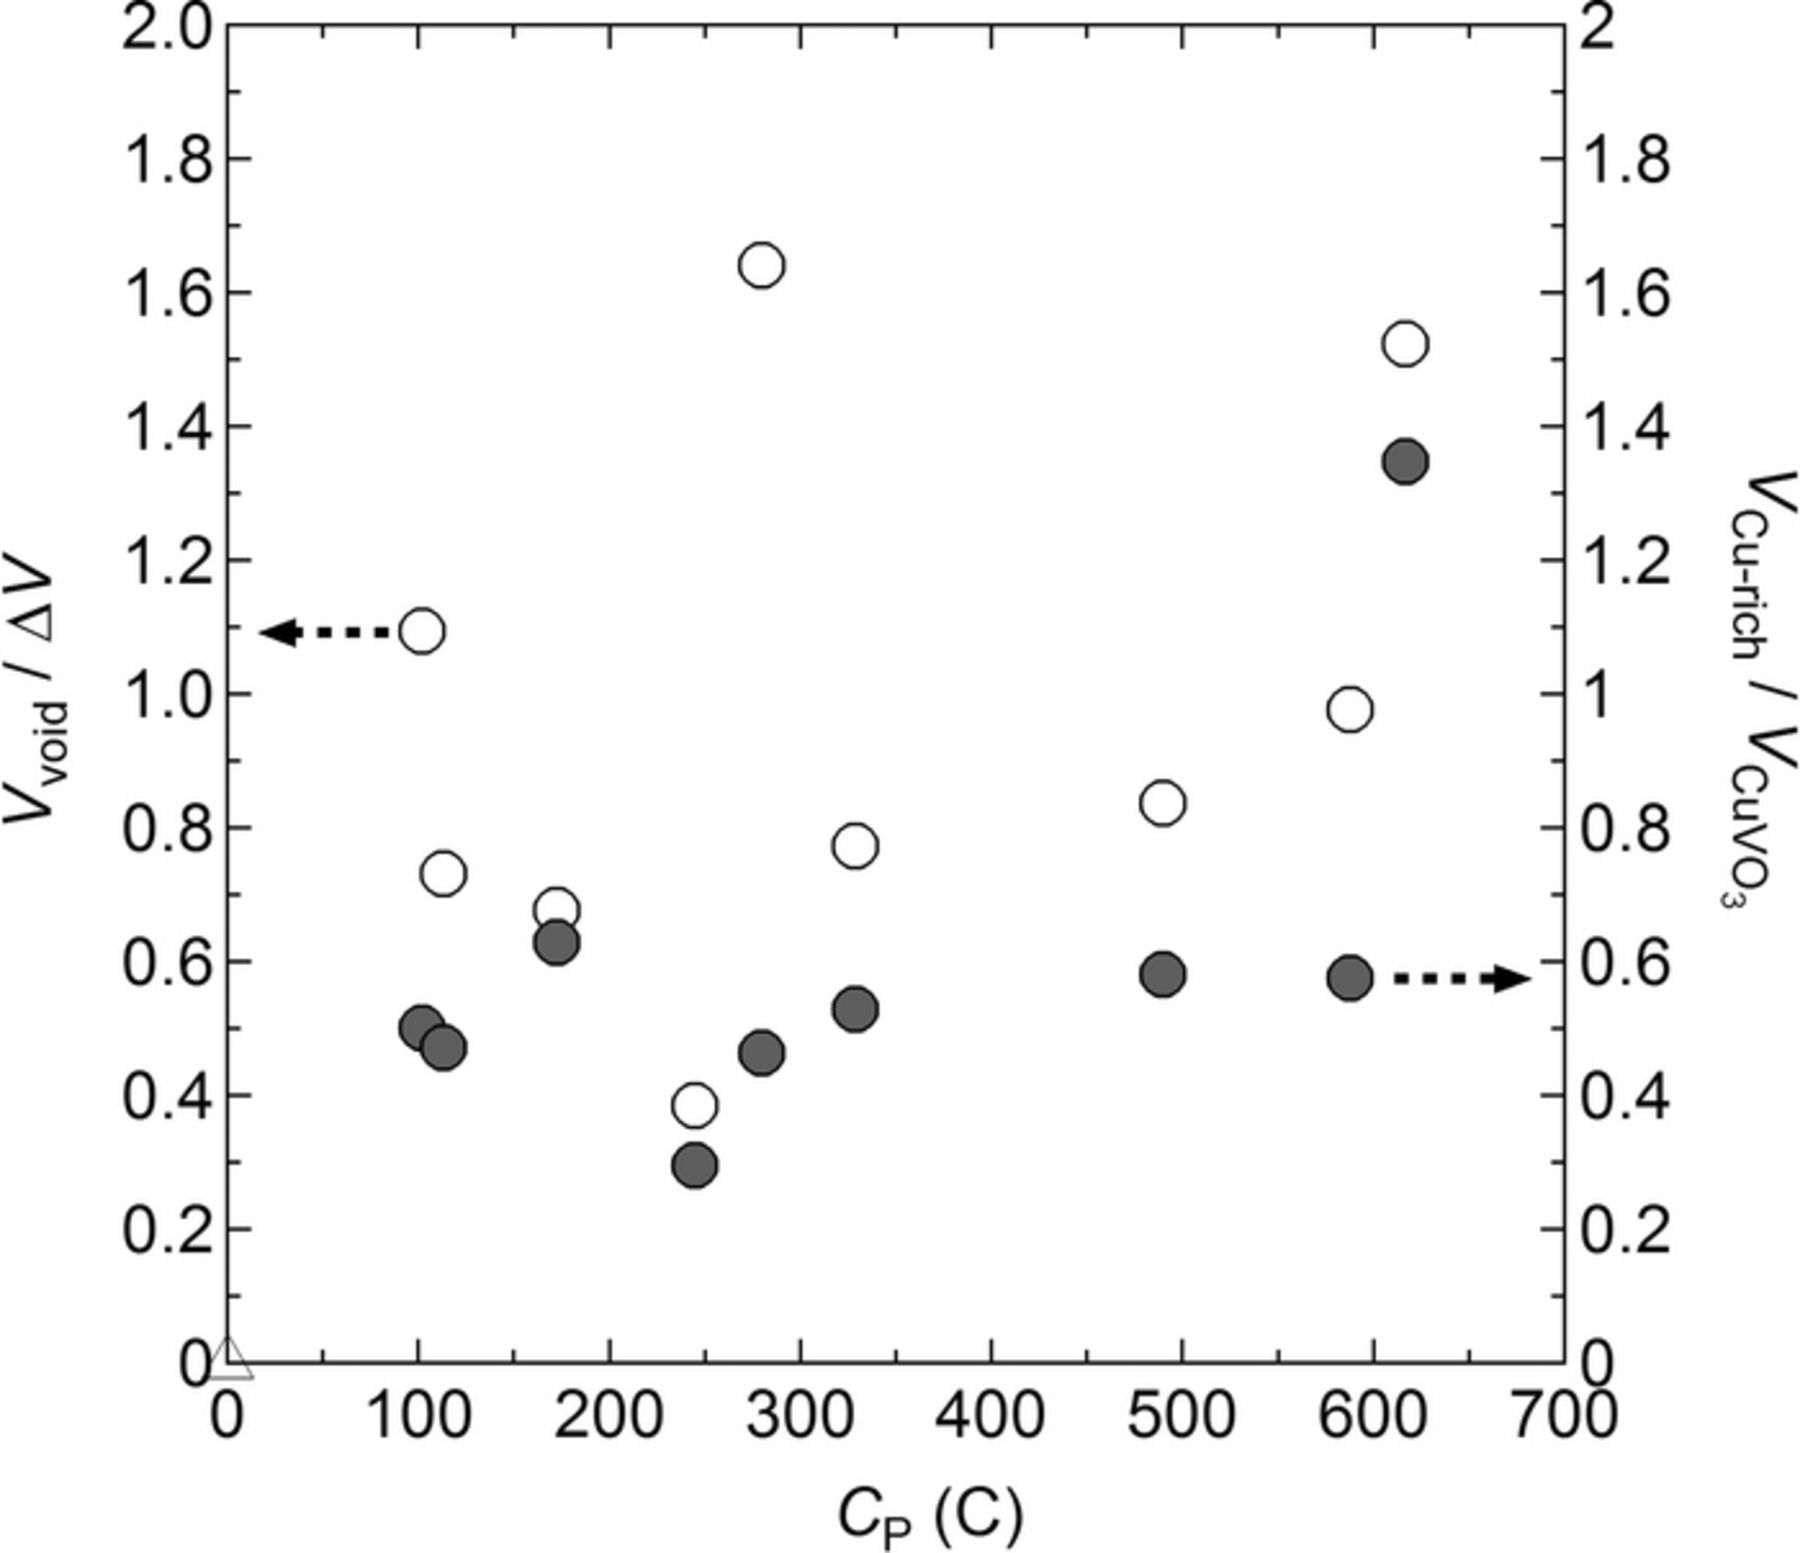
Figure 10. Vvoid / ΔV (open circle) and VCu-rich / VCuVO3 (filled circle) as a function of the total charge passed (Cp). Vvoid is the void volume, ΔV is the difference in electrode volumes in the charged and discharged batteries. VCu-rich is the Cu-rich agglomerate volume and VCuVO3 is the volume of α-CuVO3 in the same portion of each battery.
Conclusions
We report on the charge-discharge characteristics of batteries with an α-Cu6.9V6O18.9 (α-CuVO3) positive electrode and a Li metal negative electrode. A nanostructured polystyrene-b-poly(ethylene oxide) (SEO) block copolymer served as a solid electrolyte in the battery. The capacity fade of our batteries is less rapid than that of α-CuVO3–Li metal batteries with a conventional liquid electrolyte. This is attributed due to reduced mobility of Cu2+ in the PEO domains and resistance to dendrite growth due to the rigidity of the polymer electrolyte. In situ X-ray scattering revealed that the multistep electrochemical reactions involved are similar in the presence of liquid or solid electrolyte. The presence of polymer electrolyte does not entirely prevent copper dissolution from the positive active material. Hard X-ray microtomography revealed that upon cycling, the interface between the Li metal and the SEO electrolyte became delaminated and Cu-rich agglomerates were found on the Li metal electrode. The void volume due to delamination and volume occupied by the Cu-rich agglomerates were independent of C-rate and cycle number.
List of Symbols
| ACu | area ratio of the Cu peak |
| ACuVO3 | total area ratio of the active material characteristic peaks. |
| C/n | Battery charging or discharging rate during the first cycle |
| Cp | total amount of charge passed during cycling including conditioning cycles [C] |
| E | battery potential [V] |
| I | Current used to charge or discharge the battery [A] |
| Is | scattering intensity [a.u] |
| lLi | amount of lithium deposited on the Li electrode at cycle one [μm] |
| lSEO | SEO electrolyte thickness [μm] |
| LiTFSI | lithium bis(trifluoromethanesulfonyl)imide |
| q | scattering wave vector magnitude [Å−1] |
| Q | delivered capacity during either a charge or a discharge step [mAh/g] |
| Qc | charge capacity [mAh/g] |
| Qd | discharge capacity [mAh/g] |
| N | battery cycle number |
| r | molar ratio of Li+ to ethylene oxide moieties in the SEO electrolyte |
| SEO | polystyrene-b-poly(ethylene oxide) block copolymer |
| t | time to charge or discharge the battery [h] |
| VCuVO3 | amount active material in the full tomogram [μm3] |
| VCu-rich | Cu-rich agglomerate volume obtained by X-ray microtomography and the segmentation procedure outlined in Figure 9 [μm3] |
| Vvoid | void volume obtained by X-ray microtomography and the segmentation procedure outlined in Figure 9 [μm3] |
| x | amount of Li inserted/de-inserted in the positive active material |
| η | Coulombic efficiency |
| ΔV | difference in electrode volumes in the charged and discharged batteries [μm3] |
Acknowledgments
This work was supported by the Joint Center for Energy Storage Research, an Energy Innovation Hub funded by the U. S. Department of Energy (DOE), Office of Science, Basic Energy Sciences (BES). Didier Devaux was supported by a postdoctoral fellowship from the Philomathia Center at UC Berkeley. The WAXS and microtomography works were carried out at the Advanced Light Source at Lawrence Berkeley National Laboratory at beamlines 7.3.3 and 8.3.2, respectively. The Advanced Light Source is supported by the Director, Office of Science, Office of Basic Energy Sciences, of the U. S. Department of Energy under Contract No. DE-AC02-05CH11231. We thank Polite Stewart, Chenhui Zhu, and Eric Schaible for their assistance in coordinating and performing the WAXS experiments at the Advanced Light Source Beamline 7.3.3. We thank Jean-Marie Tarascon for insightful discussions.