Abstract
One of the interests in studying the intercalation phenomenon of Li-ion is to explain the hystereses which are observed on the open circuit voltage curve of the graphite electrode during the charge and discharge. We investigated a potentiometric method to obtain the equilibrium curve and entropy change curve of the graphite electrode in charge and discharge. These curves lead to the analysis of the intercalation compounds in the graphite electrode. The results show a high hysteresis between the lithiation and delithiation in region II on the entropy curve. We do not observe the formation of LiC18 compound which would be observed at filling fraction x = 0.33 and there is no clear evidence of the LiC27 at x = 0.22. Based on our observations, we propose an intercalation model of Li into graphite in an attempt to explain the hysteresis phenomenon which was observed during charge and discharge in region II due to the possible presence of the compound LiC24. We have also observed a possible compound for the LiC24 by XRD post-mortem analysis.
Export citation and abstract BibTeX RIS

This is an open access article distributed under the terms of the Creative Commons Attribution 4.0 License (CC BY, http://creativecommons.org/licenses/by/4.0/), which permits unrestricted reuse of the work in any medium, provided the original work is properly cited.
With the significant growth of renewable energies, Li-ion batteries are going to play an increasing important role in energy storage systems. In Li-ion batteries, the material used for the anode is mainly graphite carbon for the following reasons: low cost, safety, capacity, cyclability and redox potential. The graphite of the negative electrode is prone to degradations such as solid electrolyte interphase formation (SEI), dendrites formation and Li plating on the surface. These mechanisms increase battery ageing and seriously reduce the performance and lifespan.1 It is interesting to study intercalation effects of Li-ion to understand the Li intercalation mechanisms in the crystal structure of the graphite and to explain the hystereses which are observed between the charge and discharge processes.2,3 The analysis of the open circuit voltage (OCV) curve and entropy curve of the electrode material highlights the crystallographic phases of the compounds inserted into graphite. In the following study, we focus our investigations on the transition phase in the regions II and III (Figure 7) in an attempt to explain the high hysteresis which was more specifically observed on the entropy curve of the negative electrode.
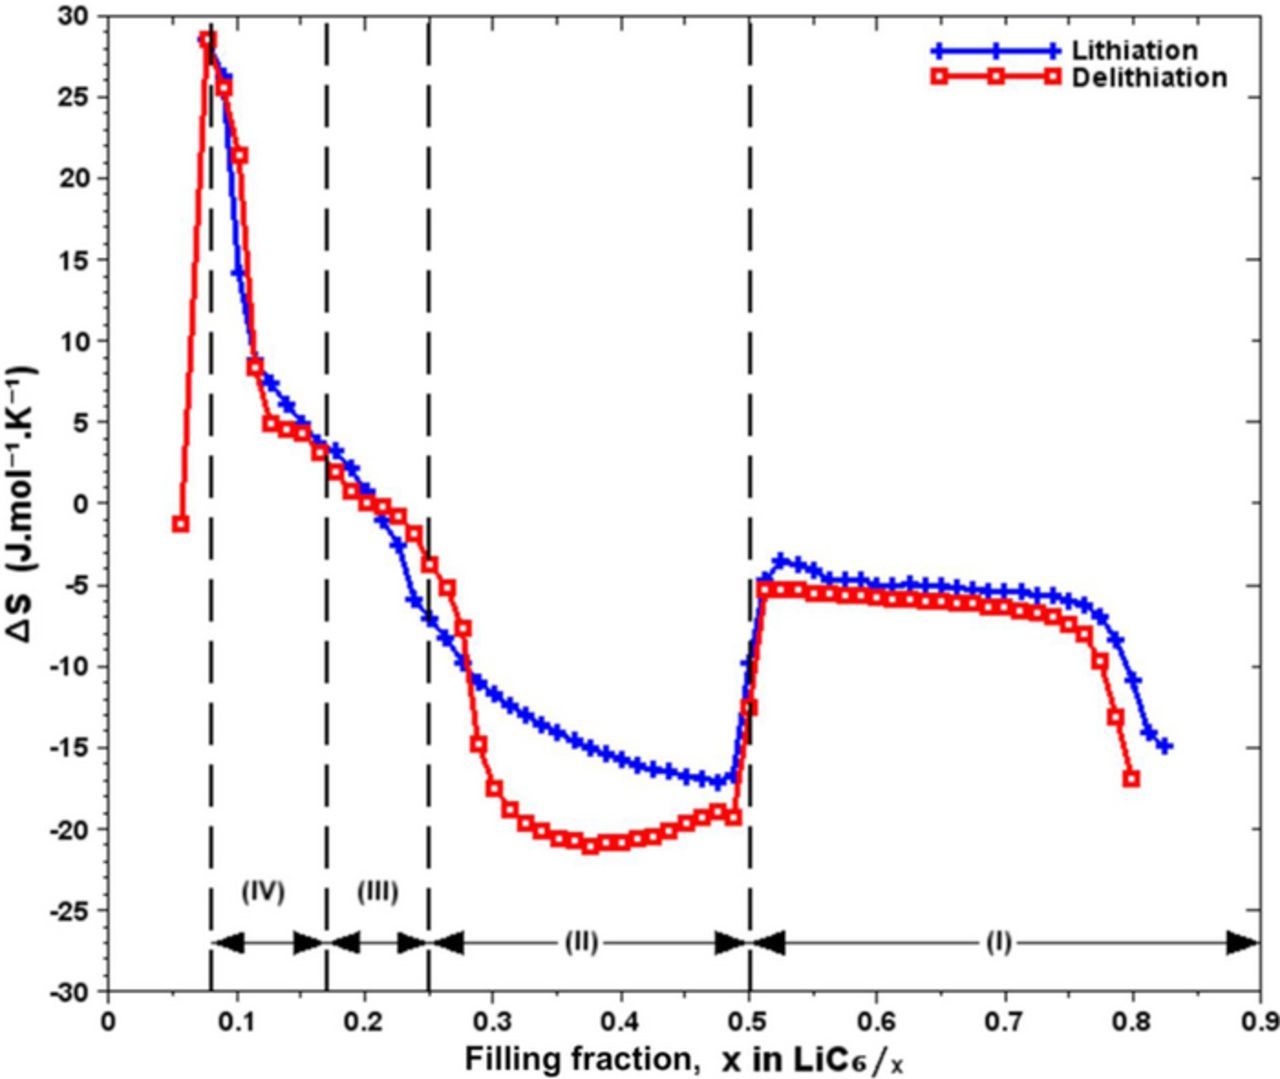
Figure 7. Entropy evolution with respect to Li filling fraction for lithiation and delithiation into carbon graphite electrode, with the regions representation.
The graphite presents a planar hexagonal structure and the stacking is A-B-A-B.4 The dynamic of intercalation of Li-ions into graphite creates disorder within the crystal structure. The entropy variation ΔS during the chemical reaction is reflected in the degree of disorder in the active material. When a crystal structure is achieved, it corresponds to a crystallographic phase.5 The electrode charges and discharges according to the various insertion stages (Figure 1), this representation is based on the Daumas-Hérold intercalated model.6 The graphite stage corresponds to the natural carbon graphite when the electrode is empty of Li. During the insertion reaction, the graphite is loading in Li through several stages. The stages are defined according to the number of graphite layers which periodically separate two Li atoms in the reticular direction perpendicular to the graphite planes. For example, stage 4 corresponds to a crystallographic phase in which there are four graphite layers between two Li layers. In stage 1, the graphite electrode is fully charged, this corresponds to phase LiC6 whose structure follows the stacking A-α-A-α (A for carbon layer and α for Li layer). Between two crystallographic phases, we have a transition region which occurs at a steady equilibrium potential of the graphite electrode.
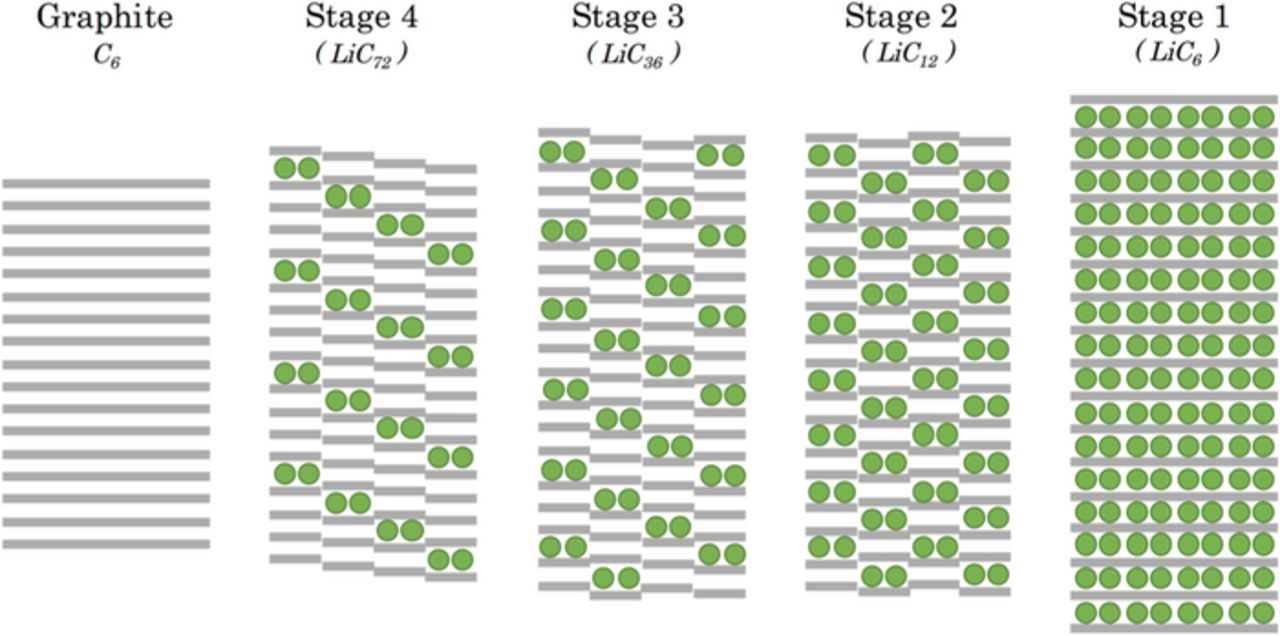
Figure 1. Classical representation of Li insertion stages into graphite and based on the Daumas-Hérold model.9
The analysis of the curves of the open circuit voltage and of the entropy, depending on the filling fraction x in LiC6/x, enables the observation of the different crystallographic phases. The phase formation follows intercalation mechanisms. Many intercalation models were proposed in the past, they are not always in agreement with all observations, because of the difficulty to determine precisely each insertion component into graphite, and particularly in stages 2 and 4 (Figure 1).2,3,6–9
In 1938, Rüdorf and Hofmann7 were the first to propose an intercalation model of alkaline-metal ions into graphite, but this model does not explain the mechanisms of the insertion reaction. It allows Li to go from one layer to anoher and to be evacuated between two graphite layers. Later, Daumas and Hérold6 suggested a second model and explained that the carbon monoxide presence (new crystallographic phase when the alkaline-metal inserted in graphite) made this evacuation of Li impossible as the carbon monoxide prevented the alkaline-metal transfer between the interspaces of graphite layers. That model takes a plated-layer into account and assumes the possibility that Li-ions can move only between graphite layers, the ion movement across and around the graphite layers is not possible. It is easier to consider a simultaneous impoverishment of all graphite layers and a structure reorganization. Then, Ohzuku et al.2 have used X-ray diffraction (XRD) to formulate many intercalation compounds of Li into graphite in nonaqueous electrolyte and during the discharge process they obverved the 1st, 2nd, 3rd, 4th, and 8th stages while Yazami et al. observed a different behavior in the entropy curve and the cristalline structure during the Li-intercalation into graphite, they proposed a mechanism which involved intermediate phases and a super-dense region. In 2010, Sethuraman et al.9 presented a surface model taking into account the influence of the concentration gradient of Li along the graphite layers. They explained that the surface Li concentration at the edge of graphite, during the reaction, is always higher than inside the active material; this results in a concentration gradient between the surface sites full of Li and the rest of the volume. It induces a significant stress and structure deformation in the graphite layers. Lately, He et al.10 suggested a mechanism to describe the Li-ions intercalation dynamics into graphite. They explained that because of the polarization effets created by a high density current, the Li intercalation process cannot follow the classical intercalation scheme but consisted in a continuous step.
The ionic intercalation phenomenons into graphite are not completely understood, but it is widely accepted that the Li intercalation into graphite mainly follows the Daumas-Hérold model. The stacking step from stages 1 to 4 follows the sequence: A-α-A-α, AA-α-AA-α, AAA-α-AAA-α and AAAA-α-AAAA-α (Figure 1). Although the plated-layer model imposes the reorganization of the ions in the graphite structure, it appears to be incompatible with stage 3 due to the fact that that stage is not evident. But it is possible that Li-ions establish two different stages through their structural reorganization, to compose a phase of mixed-stacking 2 and 4.
Based on the agreement between our observations and the analyses, we propose a model of the intercalation mechanism of Li-ions into graphite between stages 2 and 4 (respectively stacking as: AA-α-AA-α and AAAA-α-AAAA-α); this model could explain the large hysteresis observed on the entropy curve between the lithiation and delithiation processes, and the failure to observe the compound in stage 3. In this mixed phase region, it is hard to exactly interpret the right intercalation mechanism, because the formation of one or several phases fully defined and the random phenomenon of the Li disposition in the graphite layers become more important as the electrode is getting empty.
We have used a potentiometric method to measure the equilibrium potential and the entropy of the graphite electrode. The experimental protocol has enabled us to obtain the curves in the charge and discharge processes for each 2% of state of charge.
Equations
When the graphite electrode is loaded with Li (lithiation), there is a reaction of graphite reduction, causing the drop of the equilibrium potential according to the equation:
![Equation ([1])](https://content.cld.iop.org/journals/1945-7111/165/2/A380/revision1/d0001.gif)
The Li-ions are inserted between the graphite layers and they settle in the center of Van der Waals space (electrostatic gaps between layers). The graphite layers shift slightly with the increase of the interlayer distance (lattice spacing between planes) on the arrival of Li. When Li is settled in the vacuum spaces and when the crystal structure is symmetrical, a phase is formed.
The theoretical capacity of the electrode Qth,cell is determined from the mass of active material mC6 and from the specific theoretical capacity of graphite Qth,C according to:
![Equation ([2])](https://content.cld.iop.org/journals/1945-7111/165/2/A380/revision1/d0002.gif)
The mass measurement, the specific theoretical capacity of graphite and the electrode theoretical capacity are resumed in the following table:
During a physicochemical transformation, there is entropy creation regardless of the reversibility of the transformation. The measurement of the battery open-circuit voltage is needed to measure the entropy of the electrodes so as to understand the heat generation. The expression of the Gibbs free energy is written as a function of temperature T and of the OCV as expressed by:
![Equation ([3])](https://content.cld.iop.org/journals/1945-7111/165/2/A380/revision1/d0003.gif)
Where F is the Faraday constant and n the number of electrons exchanged.
Indeed, OCV depends on the state of charge (SOC) as well as the temperature, and the derivative dEOCV/dT is directly proportional to the entropy variation, according to:
![Equation ([4])](https://content.cld.iop.org/journals/1945-7111/165/2/A380/revision1/d0004.gif)
The simplified equation of heat generation in a battery is related to the variation of the OCV depending on the temperature1 expressed by:
![Equation ([5])](https://content.cld.iop.org/journals/1945-7111/165/2/A380/revision1/d0005.gif)
Experimental
Potentiometric measurements
Various measurement methods exist for OCV and entropy. Electrochemistry methods commonly used are potentiometric methods (OCV method) allowing to measure a medium voltage during a charge/discharge cycle with a low C-rate and a constant temperature.11–13 OCV is estimated according to the state of charge with a right resolution but these methods do not make it possible to observe a possible hysteresis phenomenon. Another method, the galvanostatic intermittent titration technique (GITT) consists in charging/discharging by successive current pulses, interspersed with pauses to let the voltage stabilize at approximately the OCV value.
In this study, to measure the open circuit voltage of the battery, we used a GITT to perform a series of current pulses in charging or discharging. This technique allows to analyze and measure the equilibrium potential of the graphite anode in transitional regime according to the state of charge.
The half-cell used for the experiment is assembled in a glove-box; it contains a metal-Li pellet which is used as a counter-electrode, a standard separator Celgard 2400 and one electrode which is composed of commercial graphite (SLP-30) the mass of which is written in Table I. The electrolyte used is composed of one molar of lithium hexafluorophosphate (LiPF6) and in proportion of 1:1 ethylene-carbonate and di-methyl-carbonate (EC: DMC = 1: 1).
Table I. Parameters determining the specific theoretical capacity of the electrode.
| mC6 | 0.01079 g |
| Qth, C | 372 mAh.g−1 |
| Qth, cell | 4.01 mAh |
The open circuit voltage is measured each two percent of the state of charge, ΔSOC = 2%, (ΔxLiC6/x = 0.012). The galvanostatic charges and discharges are performed at a constant temperature T = 20°C and at the C-rate of C/10. The cell nominal capacity was determined at 2.50 mAh and the time of the pulses was calculated at 12 mins.
The experiment begins with a pause at 20°C with an error of 0.5°C to reach the derivative value dEOCV/dt ≤ 0.1 mV.h−1. Once this condition is reached, just one galvanostatic pulse is performed for 12 mins. Then, a pause is imposed again to reach the OCV condition (dEOCV/dt ≤ 0.1 mV.h−1). Once this condition is achieved, a thermal cycle of eight hours is started to measure the OCV change with the temperature change.
Figure 2 shows the experiment protocol logic-diagram. The recorded data are the battery temperature, the voltage and the current. Entropy is determined by data processing according to Equation 4. Figure 3 shows the registration of the OCV curve versus time during a thermal cycle with the discharge data at the state of charge SOC = 70%. There are sixteen temperature steps of 30 mins each, every 5°C. We have made an OCV linear correction to compensate the end of the relaxation during the 8 hours' thermal cycle. This correction consists in aligning the two OCV last points measured at 20°C (at t = 4 h and t = 8 h) with the first OCV point which is measured at 20°C at t = 0 h.
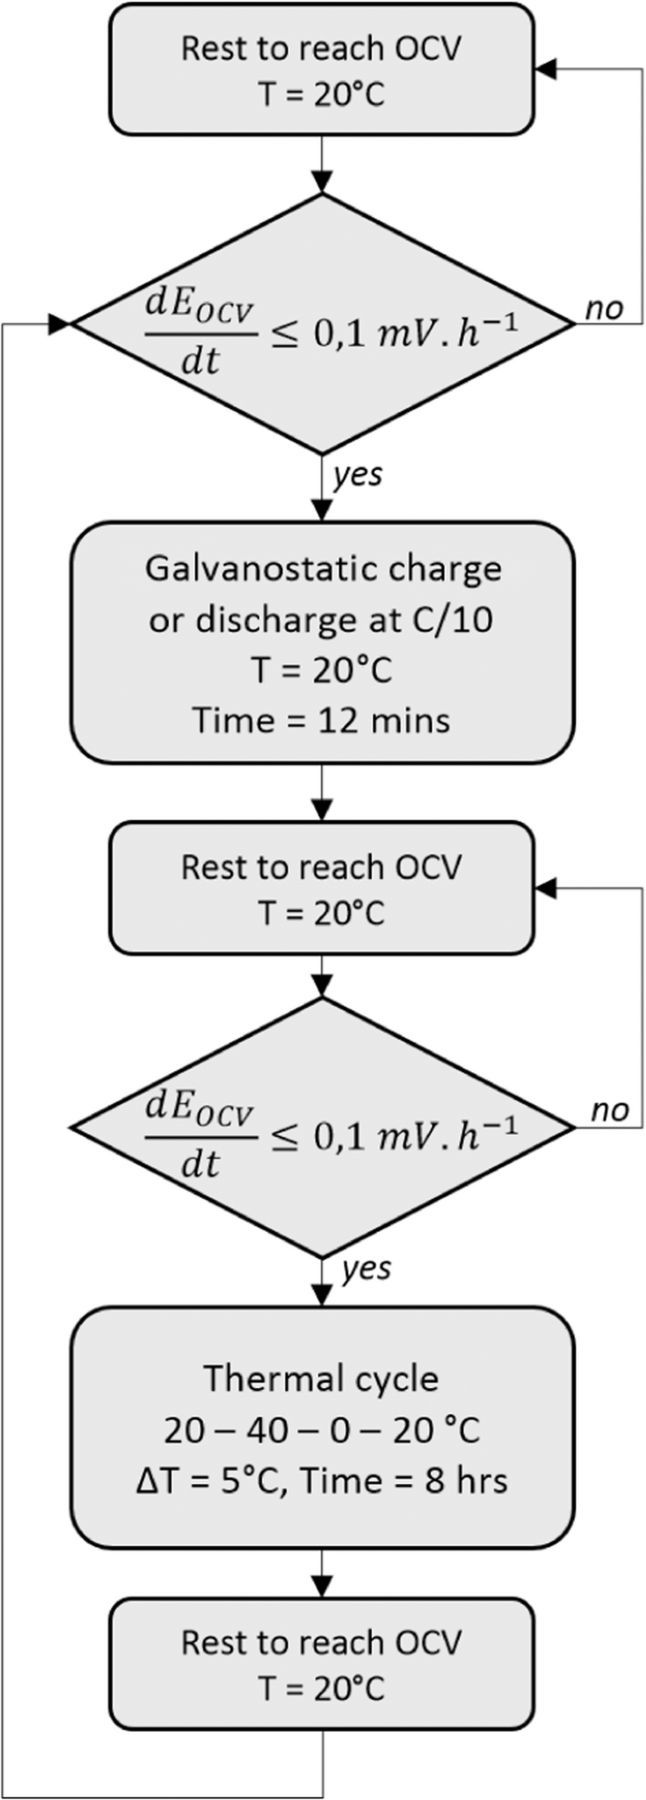
Figure 2. Schematic logic-diagram of the experimental protocol.
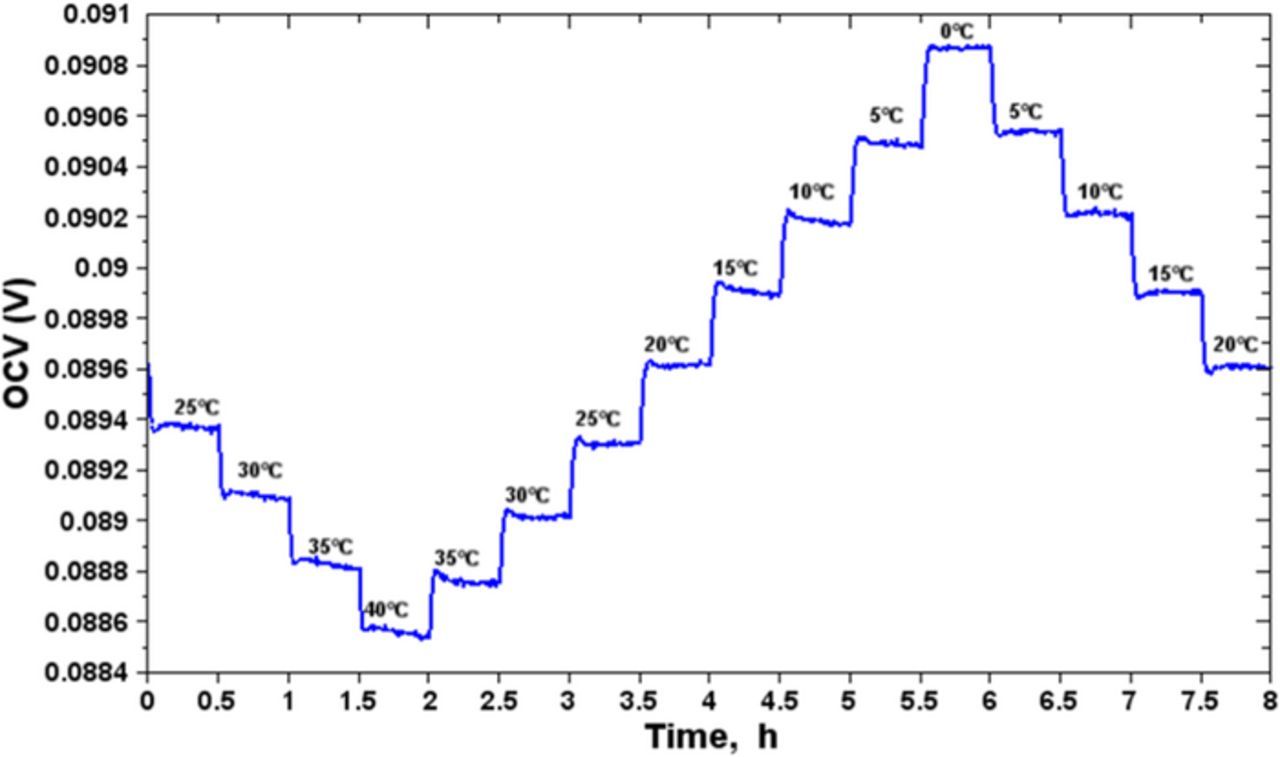
Figure 3. OCV measurement of the half-cell of graphite during the discharge process at SOC = 70%.
Thermal cycles are performed on a bench test especially designed for this type of analysis. Figure 4 shows the experimental device which allows the measurement of the OCV change according to the temperature of the half-cell. The half-cell is positioned within a copper cylinder (used for its high thermal conductivity) and is linked to the positive (out +) and negative (out -) contacts. Two ceramic platinum resistances (Pt 100) are placed inside the cylinder and allow the measurement of the temperature which is controlled. The cylinder is fixed onto a thermoelectric device for heating or cooling the copper/cell system using Peltier effect between 0°C and 40°C. The System uses a potentiostat galvanostat VMP3 (BioLogic, Claix, France) to change the state of charge of the half-cell and to measure the open circuit voltage. The charge/discharge protocol and the thermal cycle protocol are applied and monitored by computer.
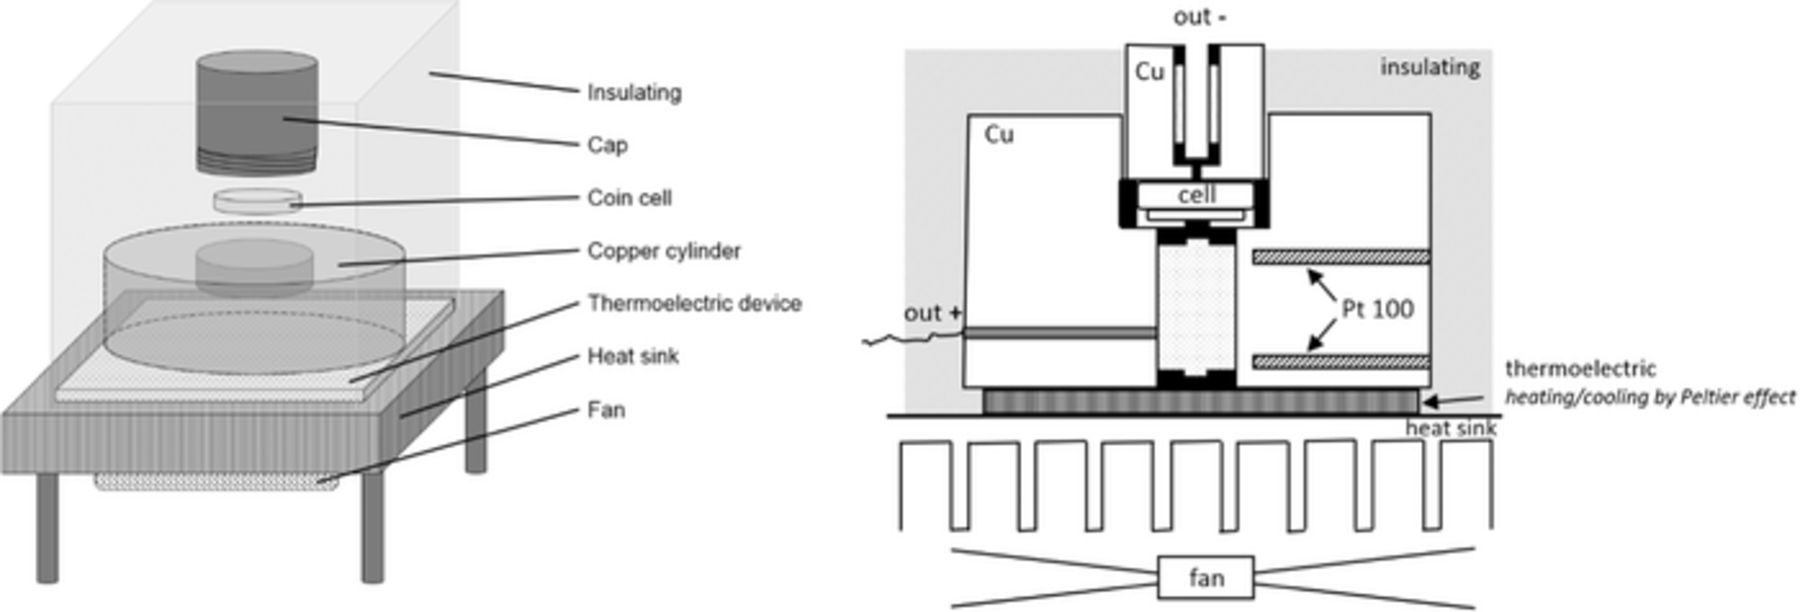
Figure 4. Representation of test bench for entropy measurement. (a): Simplified diagram in perspective view. (b): Detailed diagram in longitudinal cut.
X-ray diffraction post-mortem analysis
Relevant to our experiment, but done in another context and separately, an ageing test was performed on a Li-ion cell of 16 Ah, composed of Li nickel manganese cobalt oxide (NMC) for the cathode and graphite for the anode. This test consisted in using charge and discharge cycles under 1C/1C constant current at 5°C on SOC range 0–100% during 30 full equivalent cycles (3 days). Initially, in order to precise the degradation mechanisms and to ascertain the absence of Li-metal on the negative electrode surface, a post-mortem analysis was performed by X-ray diffraction (XRD) on the anode active material completely discharged. The material was extracted from the cell negative electrode in glove box and placed onto sample lamella. The sample is protected before analysis by a Kapton thin film. The experimental device used for the XRD analysis is a BRÜKER D8 Advance diffractometer with a Bragg Brentano geometry and equipped with a copper (Cu) anticathode allowing to use the Cu Kα radiation.
Results and Discussion
Figure 5 shows the open circuit voltage curve got by the GITT method according to the filling fraction x in LiC6/x. The curve represents the equilibrium potential profile of the graphite electrode. The shifts which are observed between 0 ≤ x ≤ 0.05 and 0.85 ≤ x ≤ 1, probably indicate that the active material was lost presumably during the manufacture process of the half-cell (cell-assembly) or during the ageing processes. Of course we could consider that there might have been an error in the weighed mass but this we consider as highly improbable.
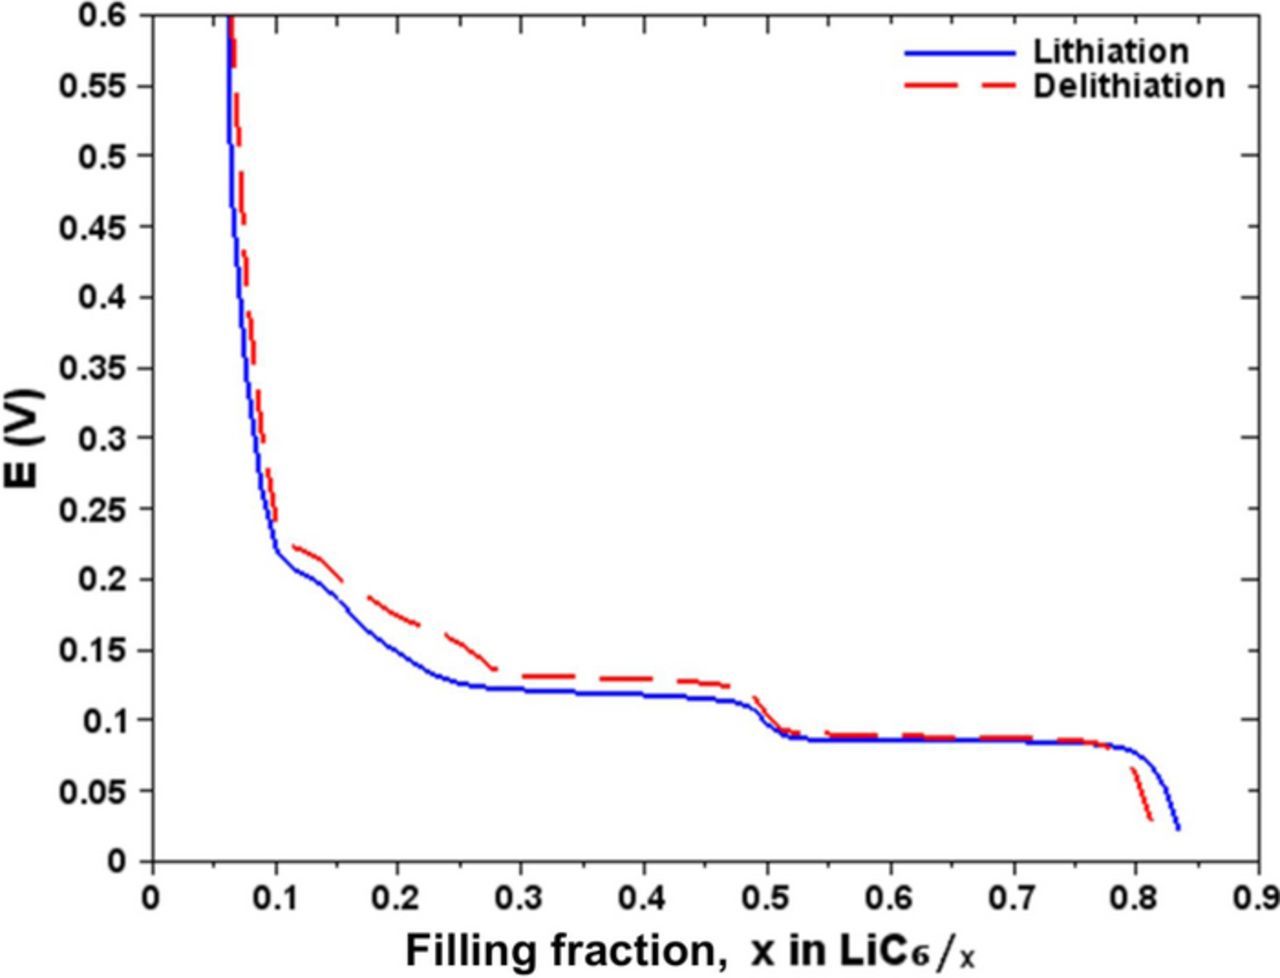
Figure 5. Equilibrium potential of graphite electrode as a function of state of lithiation in lithiation and delithiation.
A second shift is observed between the curves of lithiation and delithiation for 0.8 ≤ x ≤ 0.85. This shift is probably due to the formation of Li-metal on the surface of the electrode which is produced by electrodeposition during lithiation. The Li-metal deposit clogs some of the pores of the active material on the electrode surface. We suspect that it caused a capacity loss about Qloss = 8.7 mAh.g−1. The quantity of Li available in the active material is lower, the delithiation started at a lower filling fraction in Li. The filling fraction shift is not reflected elsewhere between the two curves. This deserves a deeper investigation like a post-mortem analysis of the half-cell used in this experiment.
A high hysteresis is observed in the region of 0.1 ≤ x ≤ 0.3 (oxidation and reduction). This observation has also been noted by Dahn5 and Ohzuku et al.,2 in this region where different crystallographic phases coexist. Bernardi and Go14 explain that the hysteresis which is observed could be due to intercalation wider in lithiation than in delithiation during the formation of simple phases.
Figure 6 shows the derivative of the equilibrium potential compared to the capacity of the graphite electrode as a function of the filling fraction. This analysis highlights the inflection zones of the equilibrium curve. A significant signature is present at x = 0.5 matching the LiC12 phase (stage 2).
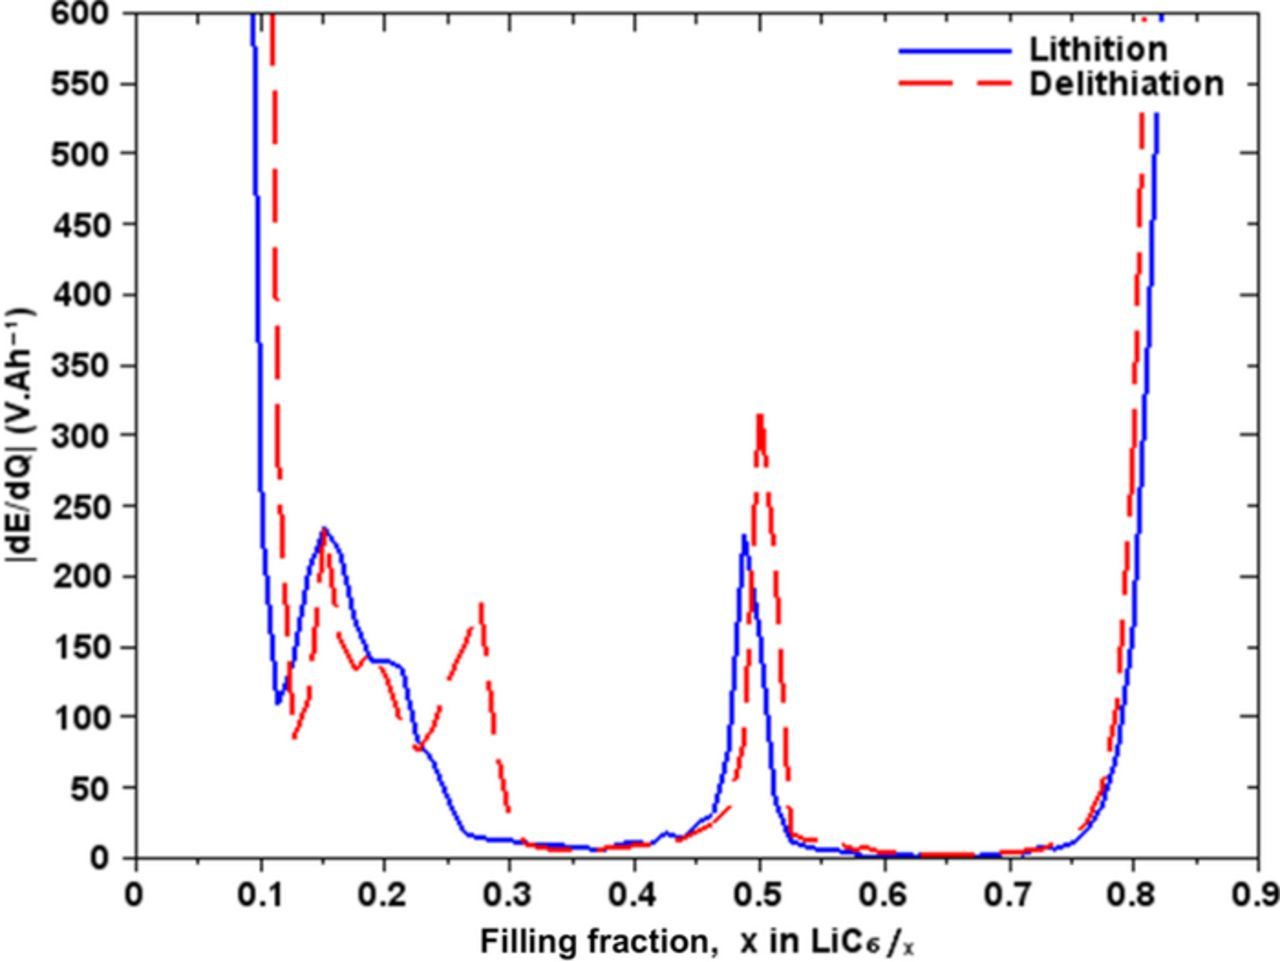
Figure 6. Differential voltage with respect to Li filling fraction.
Between 0.5 ≤ x ≤ 0.85 the derivative of the potential is zero because that region corresponds to a phase transition from LiC6 to LiC12 which occurs at a constant potential. We notice the presence of a signature for 0.2 ≤ x ≤ 0.3 corresponding to another crystallographic phase. However, we note a difference between the lithiation and delithiation at x = 0.27 which would correspond to the phase LiC22. But this phase is observed neither by X-ray diffraction (XRD) analysis nor by neutron diffraction.2,4 For 0.15 ≤ x ≤ 0.17 we see a signature of the same amplitude during the lithiation and delithiation, which probably corresponds to phase LiC36 (stage 4). For x < 0.1 it is very difficult to distinguish another phase because of the random positions of Li in graphite.
The total entropy S is an extensive thermodynamic parameter which shows the degree of disorder of matter (disorder-state). When ΔS (partial derivative of the total entropy of the system) is positive, that means the movement of electrons increases with the augmentation of the disorder-state of the system. Conversely, when ΔS is negative, the disorder-state of the system is lower.
Figure 7 shows the curves of entropy of the graphite electrode as a function of the Li filling fraction; those curves are obtained by lithiation and delithiation. Data are in agreement with the results of Reynier-Yazami12 and of Thomas-Newman.15 The curves obtained show a little hysteresis, except in the region 0.2 ≤ x ≤ 0.5 where we observe very different behavior between the charge and the discharge.
We measure an entropy of ΔS = −16 J.mol−1.K−1 around x = 0.8. For this filling fraction, the effective active material (due to matter loss) of graphite electrode is considered fully charged since the loss of active material in Li took place during the manufacture of the half-cell before the experiment started and was taken into account during the experiment and corresponds to the phase LiC6 (stage 1). Entropy is stable around ΔS = −5 J.mol−1.K−1 for 0.5 < x < 0.8. In this region, there is a transition of crystallographic phases between LiC6 and LiC12, the value of entropy is high because of Li-ions movements. The two phases coexist until the formation of LiC12, corresponding to stage 2. At x = 0.5 the crystal structure corresponding to LiC12 is ordered, entropy measurement is −17 ≤ ΔS ≤ −15 J.mol−1.K−1.
In the region II (0.25 ≤ x ≤ 0.5), LiC12 and LiC24 coexist but the transition phase between them occurs at different values of entropy (high hysteresis). During this transition, Li is rearranged randomly in Van der Waals spaces which more and more available. The Krishnan et al.16 study stresses that electrostatic interactions play an important role in establishing the crystal structure. The entropy difference observed shows that the reorganization of Li in the crystal structure of the graphite occurs at two different states of disorder. In lithiation (from LiC24 to LiC12) the transition is performed at a higher entropy compared to the value of the entropy in delithiation (from LiC12 to LiC24).
In the region 0.2 ≤ x ≤ 0.3, entropy is −15 ≤ ΔS ≤ 0 J.mol−1.K−1. In this region, it is difficult to distinguish the presence of a phase. The arrangement of Li in graphite is most difficult to observe because of the randomly positioning of the ions in the inter-planar spaces. However, for x = 0.25 the corresponding phase would be LiC24. The observation of the compound LiC24 would be dependent on the charge/discharge C-rate.12 Wang et al. have not observed LiC24 during the fast 1C charge, but in separate experiment at a slower C/10 C-rate, they observed a brief appearance of the compound in a two-phase region.4 According to Persson et al.,17 slow diffusion of Li-ions into the graphite layers allows to briefly catch sight of the compound LiC24 during the fast charge. The stage of this phase is not well defined by the XRD analysis. Ohzuku et al.2 have proposed a stage 2 corresponding to the phase LiC18 (sometimes noted stage 2-L to designate an incomplete stage)15,18 and a stage 3 corresponding to the phase LiC27. Our observations are consistent with Ohzuku et al. study for the following stages: stage 1 (LiC6), stage 2 (LiC12), and stage 4 (LiC36). For x = 0.33 and for x = 0.22 we do not clearly identify the evidence of respectively the phase LiC18 and LiC27. This excludes the hypothesis of the stages 2L and 3 respectively for LiC18 and LiC27. This is reinforced by the fact that the rigidity of the covalent structure C-C makes it almost impossible for Li to move perpendicularly to the layers, in addition, the structural reorganization of stage 2L and 3 is not observed. Persson et al.17 showed that the diffusion capacity of Li in the inter-planar spaces is much higher than the diffusion capacity perpendicular to the graphite layers. Moreover, this vertical diffusion is highly unlikely because of the high barrier of the migration potential around 10 eV.16
Entropy is strongly positive ΔS = 29 J.mol−1.K−1 for x = 0.08, this observation suggests that Li is randomly arranged and widely spaced in the crystal structure of graphite. The corresponding phase is LiC72. The region IV (0.08 ≤ x ≤ 0.17) corresponds to the transition of phases LiC72 and LiC36. Our results are in good agreement with those of Y. Reynier and R. Yazami.12 We however note that we have observed a fall in entropy at the end of the delithiation. K. Thomas and J. Newman15 also measured an entropy decrease for x ≤ 0.08 but has never given any explanation. The fact that the entropy falls at the end of delithiation can be explained. Indeed, when the graphite is fully delithiated, its crystal structure becomes very close to C6 which is a hexagonal-shaped mesh. The orderliness of the structure results in a decreasing entropy. However, Sethuraman et al.9 observed, by Raman spectroscopy, local dislocations in an aged graphite electrode between 1 and 0.18 V (0 ≤ x ≤ 0.15). Local damages of structure are not uniform and cause an irreversible ageing of the electrode. Although an aged graphite electrode will never get back to a perfect crystal structure, but its structure keeps a hexagonal planar geometry. Further studies on this subject, would allow to better understand the mechanisms taking place at the end of delithiation, it would also explain more precisely the entropy decrease for x ≤ 0.08.
The derivative of the entropy in relation to the filling fraction is shown in Figure 8. The derivative diverges for x > 0.8 which corresponds to the phase LiC6 of the electrode fully charged in Li. We observe a signature in x = 0.5 which brings to light the phase LiC12. Contrary to what was observed in Figure 5, we observe in Figure 8, two shifted signatures for 0.2 < x < 0.3 indicating the presence of two phases. We assume that this is a phase of mixed-stacking corresponding to LiC24. This phase consists of a mixture of stages 2 and 4 in different proportions depending on the direction of the chemical reaction. This is supported by our analysis and by the observation of the hysteresis between the charge and discharge which suggests that the mechanisms of intercalation and deintercalation are different in region III.
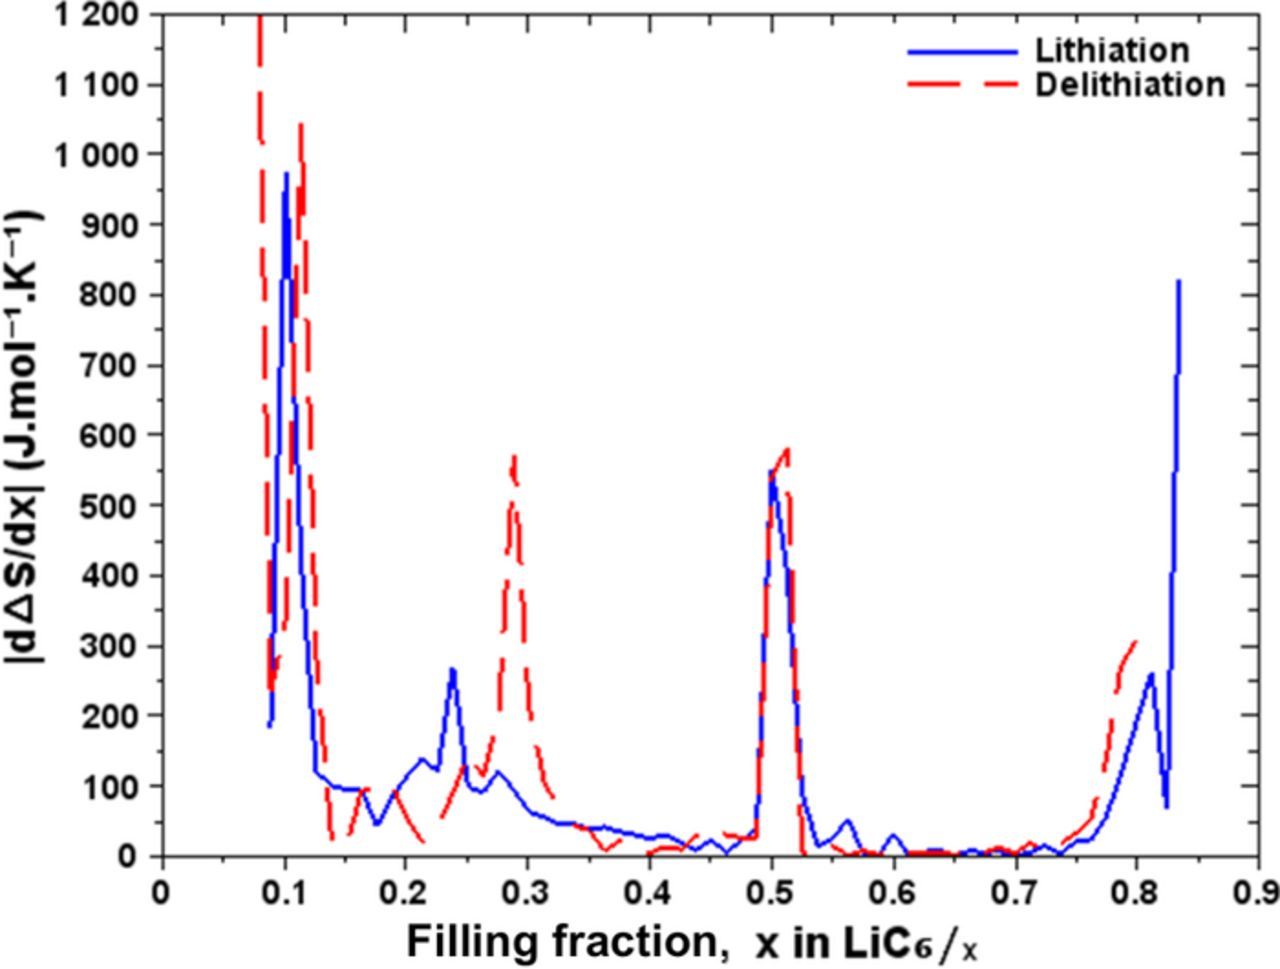
Figure 8. Differential entropy with respect to Li filling fraction.
The post-mortem XRD analysis of the active material on discharged graphite anode (Figure 9) done separately, shows that a part of exchangeable Li is trapped in the anode as graphite intercalation compounds. Otherwise, we do not observe the Li metal presence. According to the reference samples from the International Centre for Diffraction Data (ICDD), we have identified the presence of the compounds LiC6, LiC12 and possibly LiC24.
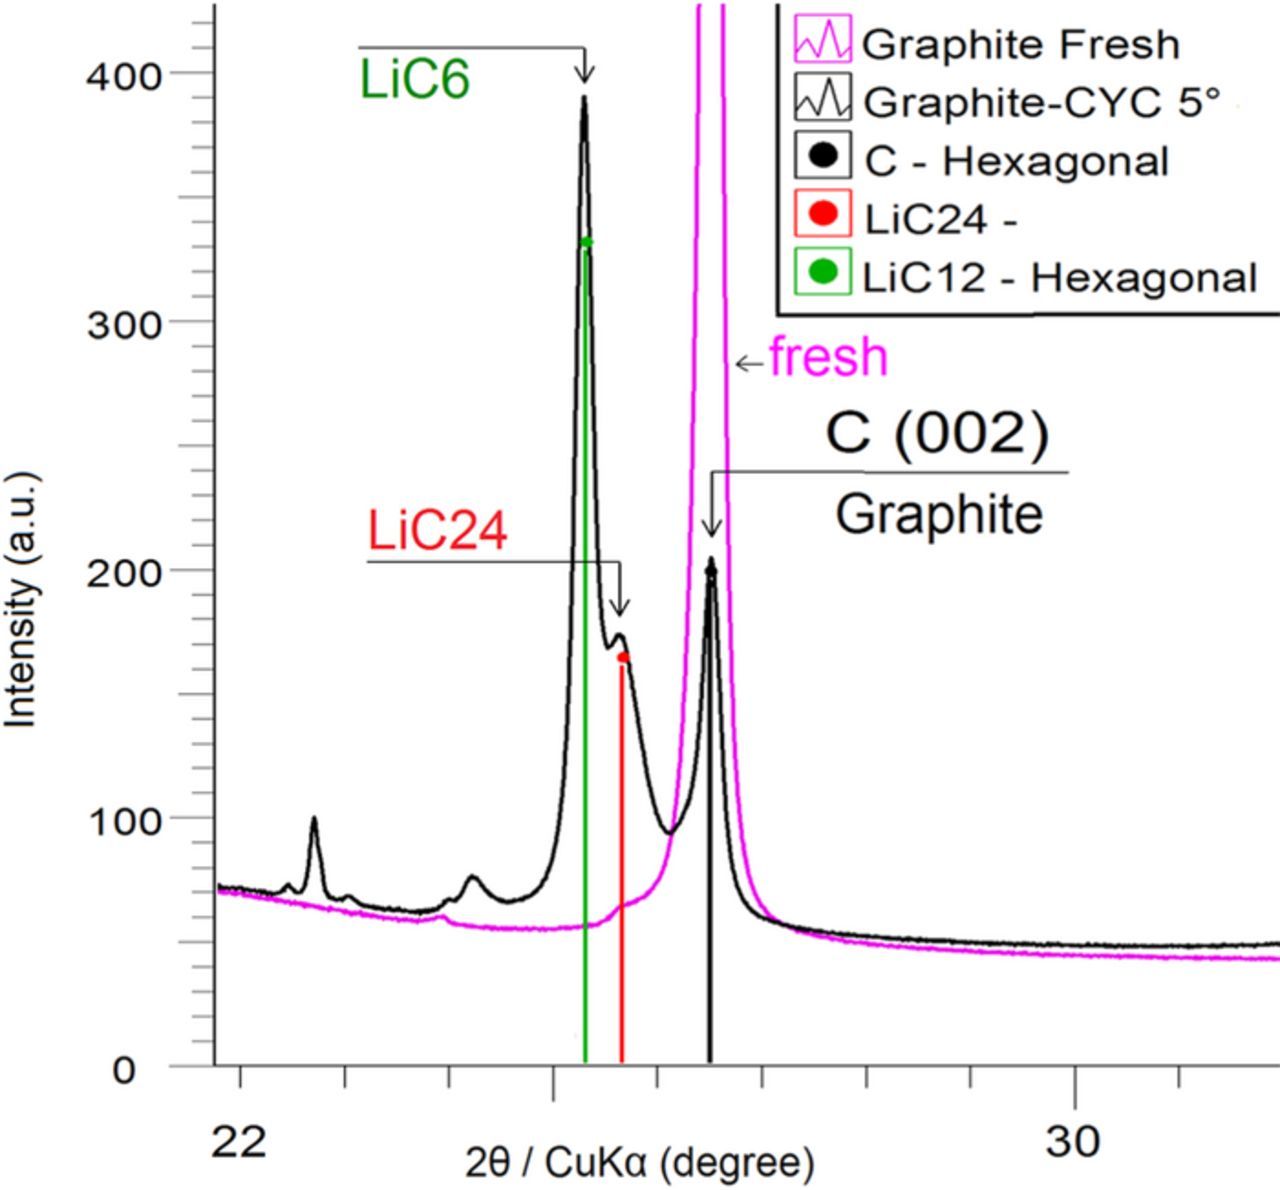
Figure 9. XRD spectrum of graphite electrode after a cycling process of 30 full equivalent cycles at 1C/1C between SOC = 0% and 100% at the temperature of 5°C. In pink, the fresh graphite electrode, in black the aged graphite electrode. We observed a little signal near 2-Theta = 25.4° of CuKα.
This post-mortem analysis shows a possible LiC24 phase formation during a cyclage at low temperature. It is difficult to get pure intercalation compounds that can be used as XRD reference. There are several reasons for that, one of them is the experimental difficulty in choosing the exact voltage to get the pure intercalation compound, this is true for ex-situ XRD analyses but not so true for XRD in-situ analyses where the lithiation is carried out step by step with relaxation pauses at a given charge state. Moreover, the heterogeneity of polarization of the particles in the graphite electrode makes the coexistence of different stages possible for a given SOC in the same electrode. Finally, database references patterns are available for some compounds, but not for all.
Mechanisms
In region IV (0.08 ≤ x ≤ 0.17) during the lithiation, a phase transition occurs between LiC72 composed of diluted stages and phase LiC36 (stage 4) according to the equation:
![Equation ([6])](https://content.cld.iop.org/journals/1945-7111/165/2/A380/revision1/d0006.gif)
This transition is achieved with a positive entropy becoming quickly almost null around x = 0.17. The low hysteresis in this region shows that the transition is reversible, because for this region and beyond, the dynamic of Li positioning is very random.10,16
In region III (0.17 ≤ x ≤ 0.25) there would be a transition between the phase LiC36 (stage 4) and the mixed-stacking LiC24 (stage 4–2). The Equation 7 represents the phase transition in lithiation and the Equation 8 in delithiation:
![Equation ([7])](https://content.cld.iop.org/journals/1945-7111/165/2/A380/revision1/d0007.gif)
![Equation ([8])](https://content.cld.iop.org/journals/1945-7111/165/2/A380/revision1/d0008.gif)
During the LiC24 formation (stage 4–2), the Li is more spaced out in graphite and stage 4 would be predominant. Conversely, during delithiation, the formation of LiC24 (stage 2–4) the Li would be arranged more compactly. This would explain the hysteresis observed in this region. This explanation is consistent with that given by Bernardi and Go14 for the hysteresis observed for 0.20 ≤ x ≤ 0.30 (Figure 5).
In region II (0.25 ≤ x ≤ 0.50), we observe that the phase transition between LiC24 (stage 4–2) and LiC12 (stage 2) in lithiation is carried out at a higher value of entropy than in delithiation (see region II on Figure 6). As the LiC24 (stage 4–2) would be less compact, the degree of disorder would be greater than in a compact phase; this explains that the transition between phases LiC24 (stage 4–2) and LiC12 is carried out at greater entropy, and vice versa in delithiation.
The transition between x = 0.25 and x = 0.50 gradually brings about stage 2 to compose phase LiC12. The Equation 9 represents the phase transition in lithiation and the Equation 10 in delithiation:
![Equation ([9])](https://content.cld.iop.org/journals/1945-7111/165/2/A380/revision1/d0009.gif)
![Equation ([10])](https://content.cld.iop.org/journals/1945-7111/165/2/A380/revision1/d0010.gif)
In region I (x > 0.5), the transition phase between LiC12 and LiC6 is reversible because we have not observed hysteresis between the lithiation and delithiation.
![Equation ([11])](https://content.cld.iop.org/journals/1945-7111/165/2/A380/revision1/d0011.gif)
We propose to illustrate the model of ionic intercalation of Li into the graphite (Figure 10). The schematic representation has been deduced from our previous observations. The various regions and the states of lithiation are represented on the horizontal axis. The weakness of the Van der Waals interaction enables graphite plans to move apart this allows Li to move into the inter-planar spaces. The intercalation of the Li occurs via three interactions: the driving force of reaction, the attractive force of Van der Waals (which allows cohesion of graphite layers between themselves) and the repulsive force of polarization between ions of the same charge.
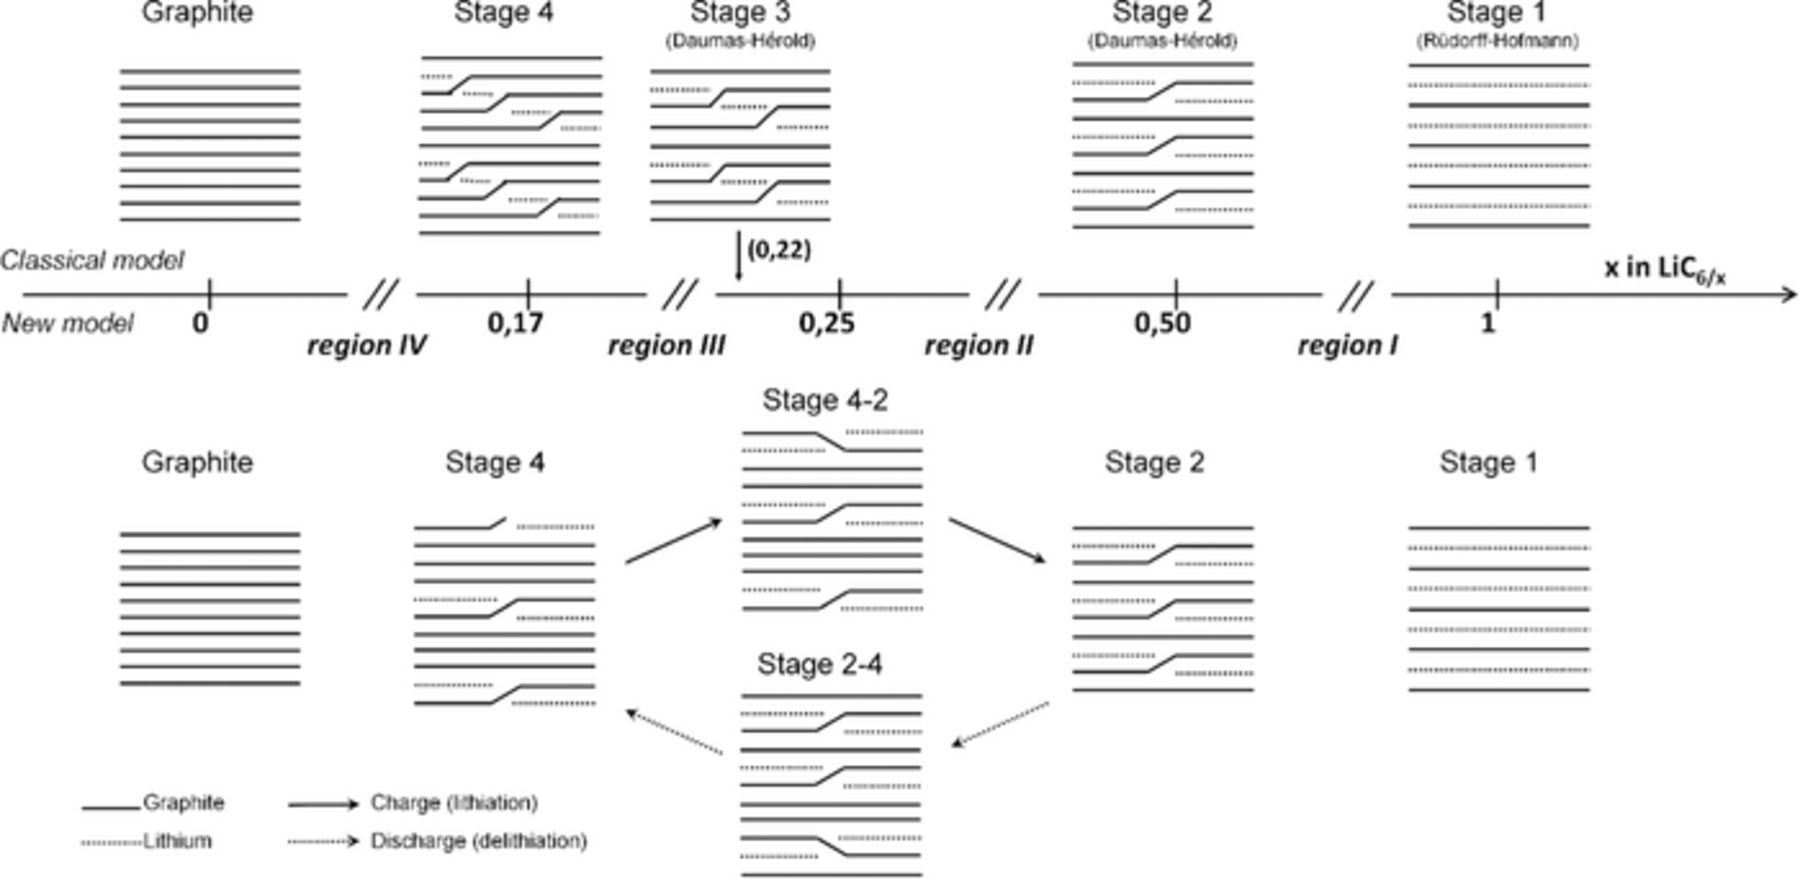
Figure 10. Schematic representation of the Li intercalation process into graphite. Classical model is represented above the axis. A novel model is represented below the axis with the new proposition of the stage 2–4 and stage 4–2 for the phase LiC24. We added the history stage proposition by Rüdorff-Hofmann7 in 1938 and by Daumas-Hérold6 in 1969.
We propose a mixed-stacking LiC24 in lithiation which presents a less compact stacking (stage 4 majority compared to stage 2) for the same state of lithiation, and vice versa in delithiation. The hysteresis observed in regions II and III would be due to the presence of this mixed-stacking which is different in charging and discharging (a different arrangement or a different crystallographic compactness).
Conclusions
The thermal behavior of batteries mainly depends on the electrical and chemical contributions of the materials of the electrodes. The electrical work and the enthalpy of the chemical reaction are mainly responsible for heat generation in batteries (Equation 5), and enthalpy depends on the entropy change of the active material used for the electrodes. We have seen that entropy can be estimated from the measurement of the open circuit voltage in accordance with temperature.
We have used the galvanostatic intermittent titration technique (GITT) to measure the open circuit voltage of the half-cell (graphite negative electrode). The experimental device has made possible the variations of the temperature of the system between 0°C and 40°C. It was also possible to measure the entropy changes in relation to the temperature of the half-cell. The data processing was used to determine the entropy of the graphite electrode according to the filling fraction of Li. The results have been obtained with a very good resolution, thanks to the measuring at points every 2% of the state of charge (ΔxLiC6/x = 0.012) and with a condition dEOCV/dt ≤ 0.1 mV.h−1 on the open circuit voltage. The behavior of the graphite electrode was observed on OCV and entropy curves, the variations in the curves are due to the Li intercalation mechanisms into the graphite, and follow several phases of different stacking.
The plateaus on the curves of the open circuit voltage and entropy correspond to different regions. Each region represents a transition between two crystallographic phases of lithiated graphite. We have distinguished four regions: region I for 0.50 ≤ x ≤ 1 corresponding to the phase transition from LiC12 to LiC6, region II for 0.25 ≤ x ≤ 0.50 would corresponds to the transition from LiC24 to LiC12, region III for 0.17 ≤ x ≤ 0.25 would match the transition from LiC36 to LiC24 and region IV for 0.08 ≤ x ≤ 0.17 would corresponds to the transition from LiC72 to LiC36. Beyond region IV, we have not observed other signatures to highlight other diluted phases.
The new Li intercalation model that we propose is comforted by our observations of the results of the entropy measurement. We propose that the phase between regions II and III be the LiC24; this would correspond to a mixed-stacking consisting of two stages of different stacks; the stacking contents would be different in lithiation and delithiation. Thus in lithiation, graphite would go through phase LiC24, richer in stage 4 than in stage 2 (named stage 4–2); and in delithiation, phase LiC24 would be richer in stage 2 than in stage 4 (named stage 2–4) (Figure 10). The observed hysteresis shows that the mechanisms in regions II and III are not reversible.
Furthermore, a post-mortem XRD analysis has shown a possible presence of phase LiC24 in a graphite electrode after a cyclage 1C/1C at low temperature. But, the presence of LiC24 is made difficult to detect because of a lack of a reference sample for the crystallographic phase LiC24. A post mortem more relevant analysis in the x = 0.25 region should highlight the LiC24 phase, but this analysis could not be done. An analysis in-situ XRD or Raman or Neutrons-Diffraction at high energy in charge and discharge, or using powder diffraction (PXRD) technique, would be necessary to identify a possible crystallographic phase in the region 0 ≤ x ≤ 0.5 for the graphite electrode and thus highlighting the presence of LiC24.
The methodology used in this study can be applied to other electrode technologies, including the positive electrodes. A good knowledge of the entropy of the electrode material is needed to understand the thermal behavior of batteries and to improve their performance.
Acknowledgments
This work was supported by the Laboratory for Electro-Chemical Storage (CEA/LSEC) which is operated by the French Alternative Energies and Atomic Energy Commission, University Laboratory of Applied Sciences of Cherbourg (LUSAC), University of Caen and the region of Normandy.