
Abstract
Polymer electrolyte membrane (PEM) water electrolysis is a key technology for sustainable hydrogen based energy supply. Gas permeation through the PEM leads to hydrogen in oxygen at the anode side posing a safety hazard and therefore restricting the operation window of PEM water electrolysis, especially when operating under pressure. In this work the hydrogen in oxygen content at the anode is significantly reduced when a recombination interlayer is integrated into the membrane electrode assemblies (MEAs) compared to reference MEAs without interlayer. The recombination interlayer with a platinum loading of 0.02 mg cm− 2 is sprayed between two membranes that are coated with anode and cathode catalysts on the outside. The permeating H2 and O2 forms water at the recombination interlayer, leading to higher gas purity and resolving safety issues. In case of the MEAs with interlayer also a constant current hold at 1 A cm− 2 for 245 h revealed only a slight increase of the hydrogen in oxygen content (below 140 · 10− 6 vol.% h− 1) whereas for the reference MEAs without interlayer a stronger increase was observed (above 1250 · 10− 6 vol.% h− 1). Furthermore, the long-term experiments showed no increased degradation rates compared to the reference MEAs.
Export citation and abstract BibTeX RIS

This is an open access article distributed under the terms of the Creative Commons Attribution 4.0 License (CC BY, http://creativecommons.org/licenses/by/4.0/), which permits unrestricted reuse of the work in any medium, provided the original work is properly cited.
In the context of climate change and the associated requirement of energy transition, polymer electrolyte membrane water electrolysis (PEMWE) is an important technology to convert electrical energy into chemical energy. As hydrogen (H2) is typically stored at high pressure, especially the direct, electrochemical compression with high pressure PEMWE is of interest since pressurizing during operation can yield a better overall efficiency than using external compressors.1–5 However, due to the thin polymer electrolyte membranes (PEM), which are used, operation with applied pressure is associated with problems arising from enhanced crossover of product gases.3,6–9
This can easily cause safety hazards, especially in the anodic compartment and at part load, when only little oxygen (O2) is produced, since the lower explosion limit of H2 in O2 is about 4 vol.%.10 Several experimental studies showed that this value with a safety margin of 2 vol.% cannot be reached without a mitigation strategy.3,10–12 This issue arises especially at low current densities, thin membranes and high H2 pressures.
To solve this safety problem several mitigation strategies exist, which can be classified into several categories (for a detailed discussion see Trinke et al.).12 An elegant strategy is the integration of a recombination catalyst. This catalyst leads to recombination of the permeating H2 gas with O2 to water and reduces the H2 content on the anode. The recombination catalyst can be implemented at different locations of the PEMWE: external, in the porous transport layer (PTL), in the catalyst layer or in the membrane. Grigoriev et al.13 showed that by using an external gas recombiner, the H2 in O2 content could be kept well below the explosion limit. However, the gas needs to be dried beforehand which therefore does not prevent safety problems in the whole anodic circuit. To favor H2/O2 recombination Grigoriev et al.13 also dispersed platinum (Pt), Pt on carbon and a mixture of Pt and PTFE on the back side of the PTL (loading: 0.1 mg cm− 2). With this, the H2 in O2 content for a N117 based membrane electrode assembly (MEA) reached below 1 vol.% at 30 bar pressure operation, which is very low in comparison to data without any mitigation strategies that show a H2 in O2 content of 2.5 vol.% for only 20 bar cathode pressure at 0.5 A cm− 2.12
With Pt in the anode catalyst layer and a platinized PTL Ito et al.14 showed a low H2 in O2 content of 1 vol.% at 0.3 A cm− 2 and 10 bar differential pressure for a N115 based MEA, whereas without mitigation strategies the H2 in O2 content is around 2.25 vol.% at identical operation conditions despite a thicker membrane (N117).12 The Pt within the anode catalyst layer might not only force a recombination reaction of H2 and O2, it is also possible that the permeated H2 gas is oxidized to protons and will migrate back to the cathode (hydrogen pump). This was shown by Schalenbach et al.,15 using a 3rd electrode within the membrane. This also improves the faradaic efficiency. However, the use of further electrodes within a PEMWE makes the system more complex.
If the recombination catalyst is placed within the anodic CL of an electrolysis cell the Pt is exposed to high potentials > 1.23 V, thus also the long-term stability of recombination catalysts regarding dissolution or passivation due to oxide formation could be a problem.
To reduce the H2 in O2 content while avoiding the exposure of Pt to high potentials, the Pt nanoparticles can be incorporated directly into the membrane. This concept has already been successfully applied for polymer electrolyte membrane fuel cells e.g.16–23 In fuel cells the recombination leads to self-humidification of the membrane and therefore good performance at dry operation conditions, which is an indirect proof of the working principle of the recombination of permeating H2 and O2 to water.
Bessarabov and Kruger24 implemented this approach within freestanding, electrodeless membranes and the group of Gubler25 in a PEMWE with a reinforced PFSA membrane, both showing successfully a reduction of the H2 in O2 content within the anode compartment. However, this was shown in oral presentations without further investigations and detailed descriptions.
Therefore, in this work the use of a recombination catalyst in form of Pt nanoparticles directly introduced into the PEM via spray coating is proposed. The effect of Pt interlayers on the H2 in O2 content and cell performance in comparison to reference materials was investigated. Additionally, long-term tests were performed in which a constant current of 1 A cm− 2 was held for a duration of 10 days, to investigate the stability of the Pt interlayer.
Materials and Methods
Membrane electrode assembly
Single-sided catalyst coated membranes (CCMs) from HIAT gGmbH were used as base material for the electrolysis cells with an active area of 25 cm2. On the anode side a Nafion N115 membrane with 2 mg cm− 2 iridium black (Ir) as catalyst layer (CL) and on the cathode side a Nafion NR-212 membrane with 1 mg cm− 2 Pt on advanced carbon as CL were used. As shown schematically in Fig. 1, the interlayers were fabricated by spray coating (Fig. 1 (1)) onto the membrane side of one of the single-sided CCMs and sandwiched between both membrane sides (Fig. 1 (2)).
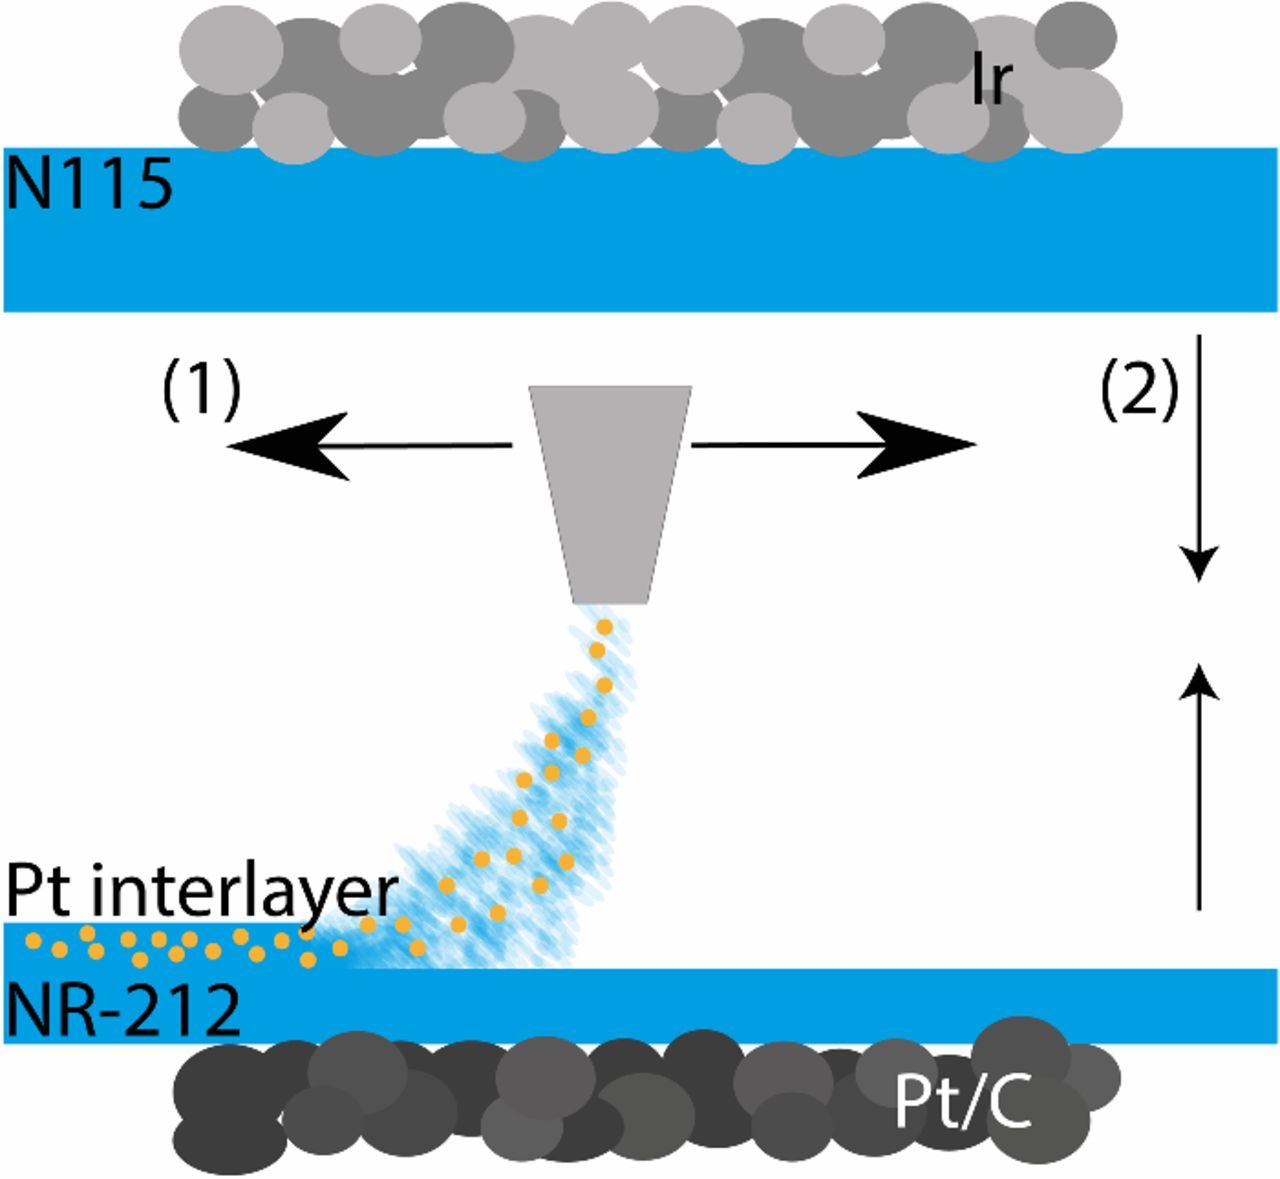
Figure 1. Schematical illustration of the sample design. The interlayer was spray coated onto the membrane side of a half-sided catalyst coated NR-212 Nafion membrane (1) and afterwards sandwiched with a half-sided catalyst coated N115 with membrane sides facing each other (2).
In order to prepare the interlayers, the Pt nanoparticles (Sigma-Aldrich, particle size < 50 nm), Nafion dispersion (D2020, Ion-power) and isopropanol were mixed in a weight ratio of 0.00114/1.43/10. A spray coater from Sono-Tek with a line spacing of 1.5 mm and a syringe pump rate of 0.1 mL min− 1 was used to apply the interlayers in 45 consecutive spraying cycles with a transversal speed of 30 mm s− 1. The spray coater was equipped with a 48 kHz ultrasonic nozzle. To determine the Pt loading, the MEAs were weighed before and after spray coating and the Pt content was determined by the weight to weight ratio of Pt and Nafion in the dispersion. Two MEAs with Pt interlayers (Int 1 and Int 2) were made to test the interlayers with respect to repeatability and reproducibility.
As reference a conventional N117 membrane (Ref. 1) and the same half-sided-CCMs (N115 + NR-212) as for the Int 1 and Int 2 membrane electrode assembly (MEA) without depositing an interlayer (Ref. 2) with equal catalyst layers were used.
Physical characterization
After testing, the Int 1 MEA was embedded in Araldite 502 epoxy resin (54.8 wt% Araldite 502, 42.7 wt% Dodecenylsuccinic anhydride, 2.5 wt% Dimethylbenzylamine) and cured for 12 hours at 60°C. The sample was prepared for imaging by wet ultra-thin sectioning using a RMC Boeckeler PowerTome ultramicrotome equipped with a Diatome ultra 45° diamond knife. Subsequently, the remaining blockface of the sample was imaged with a Scanning Electron Microscope (SEM, FEI 250 Quanta FEG with vCD back scatter detector) in "Low Vac" measurement mode at 111 Pa water pressure. ImageJ with the plug-in local thickness was used to determine the interlayer thickness.
For comparison with a pristine Pt interlayer the Pt nanoparticles/Nafion dispersion was sprayed onto a Nafion N115 membrane during the same spraying process as for the MEA preparation and prepared and imaged with the same procedure as described above.
Electrochemical setup
Test station
Electrochemical measurements were carried out at a Greenlight E100 test station, which controlled the anodic DI water feed to 50 g min− 1 and the feed temperature to 80°C. Both half cells were operated at ambient pressure conditions and the product gases were cooled down and separated from the DI water.
Cell
The test station was equipped with a liquid cooled baltic quick connect system. The cell insert had an active area of 25 cm2 and gold coated parallel flow fields. The cell temperature was kept at 80°C by a circulation thermostat. The baltic frame was applied with a nitrogen pressure of 4.5 bar, which led to a calculated clamping pressure of 1.4 MPa on the active area.
Sintered titanium fibers with diameters of 20 μm, porosity of 0.56 and thickness of 1 mm (2GDL40-1,00, Bekaert) and a Toray carbon paper with a porosity of 0.78 and a thickness of 280 μm (TGP-H-090, Fuel cell store) were used as porous transport layers on the anode side and on the cathode side, respectively.
Gas chromatograph
An Agilent 490 gas chromatograph (GC) measured the H2 content of the O2 product gas. The gas was separated with a 10 m long 5 < ?CDATAÅ? > molesieve column and analyzed by a thermal conductivity detector. For calibration of the micro-GC 4 different test gas mixtures of 0.1, 1 and 2.5 vol.% H2 in O2 and 10 vol.% H2 in nitrogen ( ± 2% of reading, Linde) were used.
Power supply and impedance spectroscopy
The polarization curves, electrochemical impedance spectroscopy (EIS) and high frequency resistance (HFR) were measured by a ModuLab XM ECS electrochemical test system (Solartron analytical). The ModuLab was equipped with a XM FRA card, a XM PSTAT card and an external 100 A booster.
For the long-term experiments and the H2 in O2 measurements the current was supplied by an Ametek Sorensen XG 6-220 power supply (current accuracy ± 0.2% of reading).
Test sequences
Each MEA was investigated with the following test sequence of the single measurement techniques:
- (1)begin of test (BOT): polarization curve + HFR, EIS and H2 in O2 content for different current densities
- (2)long-term (10 days): cell voltage and H2 in O2 content at 1 A cm− 2
- (3)end of test (EOT): polarization curve + HFR, EIS and H2 in O2 content for different current densities
In the following the single measurement techniques are described in detail.
Polarization curve + HFR
The polarization curves were measured galvanostatically with logarithmic steps from 0.001 to 1 A cm− 2 and then in steps of 0.2 A cm− 2 to 2 A cm− 2. Each step was held for 10 s with a sample rate of 5 Hz.
HFR measurements were performed between each current step. Therefore, short galvanostatic EIS measurements were implemented with frequencies from 50 to 0.1 kHz. Root mean square (RMS) of the sine waves were set to 10% of the applied DC current. The HFR was determined as the impedance values without imaginary parts multiplied by the active area.
Electrochemical impedance spectroscopy
Galvanostatic EIS measurements were conducted at 11 different DC current densities from 0.05 to 2 A cm− 2. The frequencies of the sinusoidal signal were changed from 100 kHz to 0.1 Hz with RMS of 10% of the applied DC current.
Hydrogen in oxygen content
The H2 in O2 content before and after the long-term experiment was measured every three minutes with the micro-GC for 9 different current densities from 0.1 to 2 A cm− 2. Each current density was held for several hours until the H2 content reached a constant value (steady state). Because of the small gas production rates at low current densities these steps required more time to reach a constant value than at higher current densities. This measurement sequence required approximately one day. During the long-term experiments the H2 gas content was measured every 5 minutes.
Results and Discussion
Pt interlayer
The final loading of solid material (Nafion and Pt) after spraying amounted to 4.67 mg cm− 2 which corresponds to a Pt loading of 0.02 mg cm− 2 and an additional interlayer thickness of about (26 ± 1) μm as can be seen in the cross-section of the Int 1 MEA shown in Fig. 2. The Pt interlayer was spray-coated onto the cathode half-sided CCM (Pt/C + NR-212) and sandwiched with the anode half-sided CCM (Ir + N115). No noticeable differences were observed in SEM images of cross-sections of pristine and used MEA.
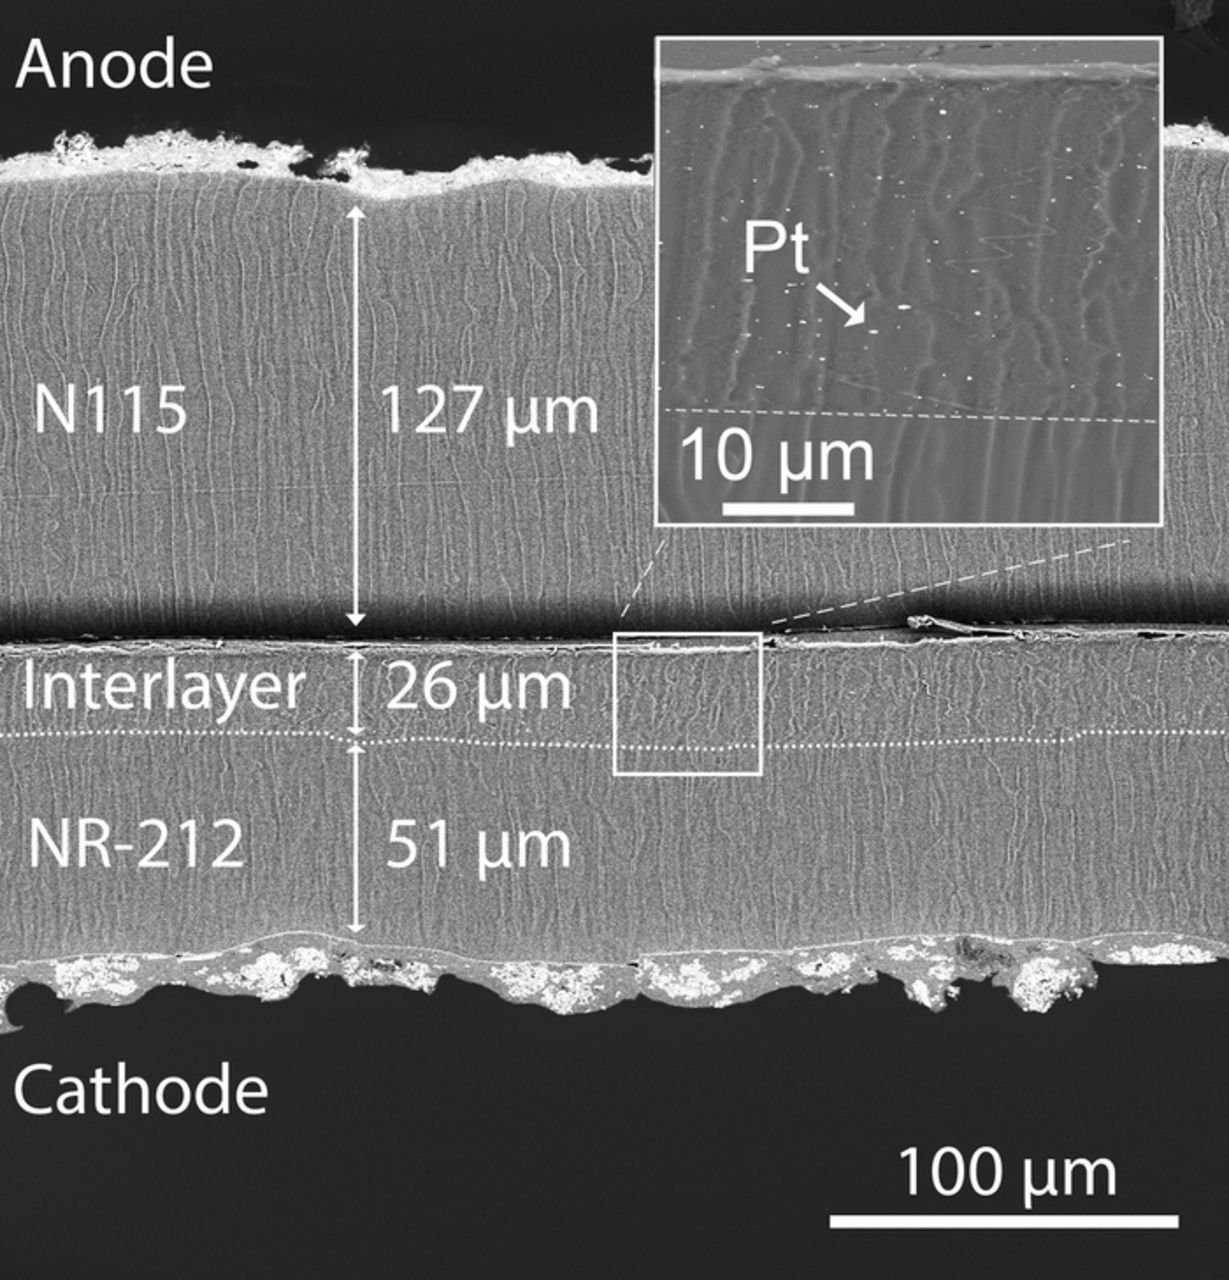
Figure 2. SEM image of the cross-section of the Int 1 MEA after testing. The interlayer was sprayed on top of the NR-212 membrane, catalyst coated with Pt/C and sandwiched with a N115 membrane, catalyst coated with iridium. The inset shows the interlayer with Pt recombination catalyst.
Reduction of H2 content in BOT characterization
Fig. 3 shows the results of the two similar MEAs with interlayers (Int 1 and Int 2) and two reference MEAs without interlayers (Ref. 1 and Ref. 2) at the beginning of test (BOT).
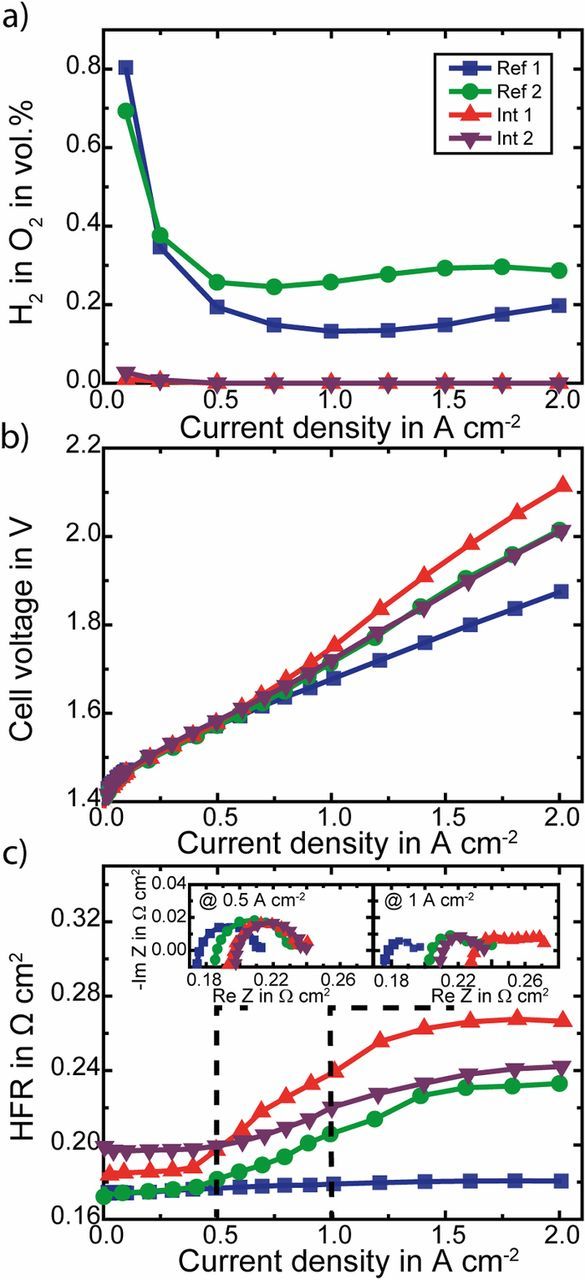
Figure 3. Comparison of measured hydrogen in oxygen content at the anode side a), cell voltage b) and HFR c) over current density of two MEAs with Pt interlayer (triangles) and two reference MEAs without interlayers: Ref. 1 (squares - N117 PEM) and Ref. 2 (circles - N115 + NR-212 PEM). Insets in c) show impedance data at 0.5 A cm− 2 (left) and 1 A cm− 2 (right).
In Fig. 3a the H2 in O2 contents within the anodic product gas is plotted as a function of the current density. At 1 A cm− 2 the H2 in O2 content of the Ref. 1 MEA amounts 0.13 vol.%. Whereas the Ref. 2 MEA with approximately equal membrane thickness as the Ref. 1 but consisting of a sandwich of a Nafion N115 and a Nafion NR-212 membrane exhibits a higher H2 in O2 content for most of the measured current density range ( ≥ 0.25 A cm− 2), e.g. is the H2 in O2 content at 1 A cm− 2 twice the amount of the Ref. 1 MEA. This can be caused by the membrane-membrane interface developing some cavities, which influence the gas permeation through the membrane or might arise from membrane defects occurring during cell assembly, since handling two half-CCMs is more likely to cause pinholes or electrical shorts.
When introducing a Pt interlayer in between the N115 and NR-212 membranes (Int 1 and Int 2), the H2 in O2 content decreases significantly for all current densities. For current densities > 0.5 A cm− 2 it is below the detection limit of 0.005 vol.%. The increase of the membrane thickness by (26 ± 1) μm due to the recombination interlayer is not sufficient to explain the strong reduction of the H2 in O2 content. Theoretically, the H2 in O2 content for a (26 ± 1) μm thicker membrane should be reduced by a factor of 180 μm/206 μm. Consequently, the H2 in O2 reduction is mainly caused by the recombination of permeating H2 and O2 to water within the interlayer. Thus enough O2 (at least the half of the H2 flux) is present at the interlayer for the recombination of the permeating H2.
Fig. 3b shows the cell voltage over the current density for the examined MEAs. As can be seen when comparing the Int 1 and Int 2 MEAs to the sandwiched MEA without interlayer (Ref. 2), despite thicker membrane, the Pt interlayer does not highly affect the performance. However, the best performance is measured for the Ref. 1 MEA. Despite the same membrane thickness, the cell voltage of the Ref. 2 MEA at 1 A cm− 2 is 34 mV higher than for the Ref. 1 MEA (1.679 V). This increase in cell voltage correlates to an increase in high frequency resistance (HFR) as shown over the current density in Fig. 3c. At 1 A cm− 2 the HFR of the Ref. 2 MEA is 27 mΩ cm2 higher than of the Ref. 1 MEA (0.179 Ω cm2), causing an increase in cell voltage of 27 mV, which is in good agreement with the measured voltage increase. The higher HFR might be caused by the additional membrane-membrane interface adding an additional resistance, which is much more pronounced for higher current densities as can be seen in Fig. 3c. For small current densities the HFR of the Ref. 2 and the Ref. 1 MEA is almost equal ( ≈ 0.175 Ω cm2) as expected for MEAs with the same membrane thickness.
The Int 1 and Int 2 MEAs show a slight increase of cell voltage compared to the Ref. 2 MEA, here as well related to an increase in the HFR, which is shown in Fig. 3c. The higher HFR of Int 1 and Int 2 compared to the Ref. 1 and Ref. 2 MEAs can be explained to some extent by the thicker membrane, caused by the spray coated interlayer (+ (26 ± 1) μm). With a proton conductivity calculated by the equation of Springer et al.26 at a temperature of 80°C and assuming a water content of 22 water molecules per sulfonic acid group27 this yields an increase in the area normed membrane resistance of (13 ± 1) mΩ cm2. For Int 2 this is in the range of the measured increase of 14 mΩ cm2. However, for Int 1 the measured increase is much higher (33 mΩ cm2).
Watanabe et. al23 and Shichun et al.17 came to the result that introducing Pt nanoparticles into their Nafion membranes in fuel cells with comparable or even higher loading does not affect the HFR. Therefore, some additional lamination issues or also the nanoparticle size and distribution across the membrane play an important role and should be subject of optimization.
As can be seen from the similar trend of the HFR curve versus current density of the Ref. 2 MEA and the HFR curves of the MEAs with Pt interlayer (Int 1 and Int 2), the increase in HFR with current density can be related to sandwiching of the MEAs. Consequently, this increasing HFR with current density might be solved by an improved setup, e.g. higher clamping pressures, hot pressing of the MEAs with interlayer or different fabrication processes. In comparison to the sandwiched MEAs, the Ref. 1 MEA shows an almost constant HFR.
The two insets in Fig. 3c show impedance spectra at a current density of 0.5 A cm− 2 (left) and 1 A cm− 2 (right). While the HFRs differ, the kinetic semicircles are comparable for all MEAs, especially for small current densities. Thus the performance of the electrodes is not affected by the Pt interlayers.
Long-term performance
Fig. 4a shows the time evolution of the H2 in O2 content when holding the MEAs at 1 A cm− 2 for 10 days. The H2 in O2 contents at 1 A cm− 2 at the beginning of test (BOT) are 0.14 vol.%, 0.24 vol.% and 0.00 vol.% for the Ref. 1, Ref. 2 and both Int MEAs, respectively. Over the duration of 245 h, the H2 in O2 content of the Ref. 1 and Ref. 2 rise by a factor of 3.1 (0.43 vol.%) and 2.6 (0.62 vol.%). The Int 1 and Int 2 samples do not show any measurable H2 in O2 content for the first 90 and 77 hours, respectively. Afterwards also for those samples an increase in H2 in O2 content to 0.01 vol.% and 0.05 vol.% can be observed.
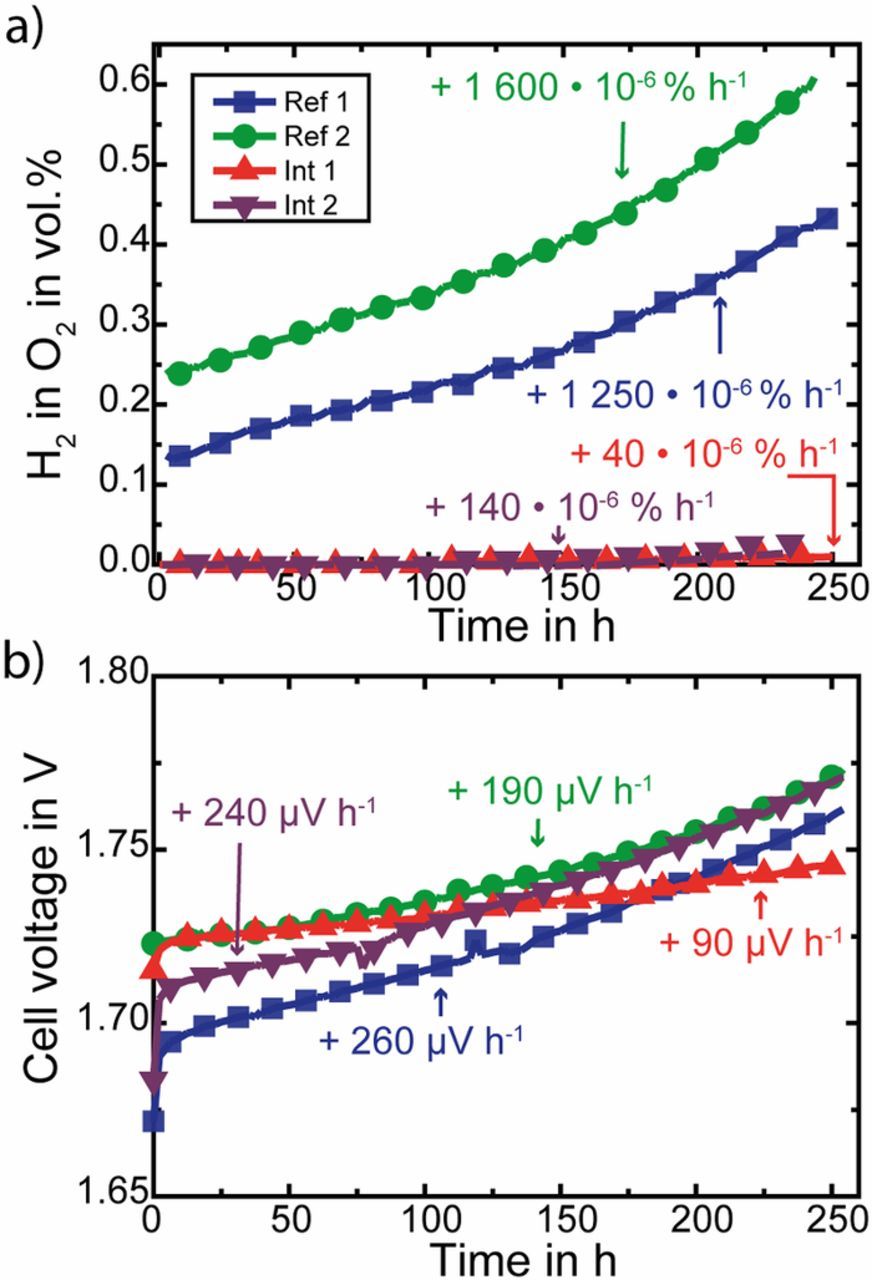
Figure 4. Behavior of hydrogen in oxygen content (a) and voltage (b) over the duration of 10 days for a constant current hold at 1 A cm− 2 of two MEAs with Pt interlayers (triangles), and two reference MEAs: one with a N117 membrane (squares - Ref. 1) and one sandwich of NR-212 + N115 membranes without interlayer (dots - Ref. 2).
By dividing the difference of H2 in O2 contents at BOT and EOT by the time duration, the increase of H2 in O2 can be calculated to 1250 · 10− 6 vol.% h− 1 (Ref. 1), 1600 · 10− 6 vol.% h− 1 (Ref. 2), 40 · 10− 6 vol.% h− 1 (Int 1) and 140 · 10− 6 vol.% h− 1 (Int 2). This clearly shows the beneficial effect of introducing a recombination catalyst into the membrane.
However, the increase of H2 in O2 by time, observed for the Int 1 and Int 2 shows that with time not all permeating H2 molecules are recombined with O2 molecules to water. A reason for this might be that the activity of the recombination catalyst decrease with time, due to e.g. dissolution, washing out or agglomeration. However, all this is unlikely for the duration of 245 h, and is also supported by Fig. 2, which shows Int 1 after testing. Another possibility is that the H2 crossover increases in a higher extent than O2 does (as it can be seen for the reference MEAs), so that at the position of the interlayer (closer to cathode than anode) there is not enough O2 present to enable a full recombination of all permeated H2.
In Fig. 4b the cell voltage is depicted for the same duration of 245 hours. After the first strong increase in cell voltage, which is characteristic for such long-term experiments ( ≈ 10 hours),28 the cell voltage of the Ref. 1 MEA increases by 260 μV h− 1. Compared to values found in literature measured in similar tests this increase is high (e.g. 180 μV h− 129 and even 0 μV h− 130 for a constant current hold @ 1 A cm− 2). The cell voltage of the Ref. 2 MEA increases by 190 μV h− 1 during the same time frame, which is in good agreement with some values found in literature (e.g.)29 but still very high, compared to others (e.g.).30 However, the observed degradation rates match the specifications given by the CCM manufacturer.31 For Int 1 the voltage increases only half as fast (90 μV h− 1), whereas Int 2 shows a 2.6 times higher rate of 240 μV h− 1, which is comparable to the Ref. 1 MEA. Thus observing the cell performance over ten days does not suggest a negative impact of the Pt recombination interlayer on long-term stability.
EOT characterization
After the long-term experiments the MEAs were investigated again with respect to performance and H2 in O2 content. In Fig. 5 the Ref. 1 and the Int 1 MEA are compared at BOT and EOT.
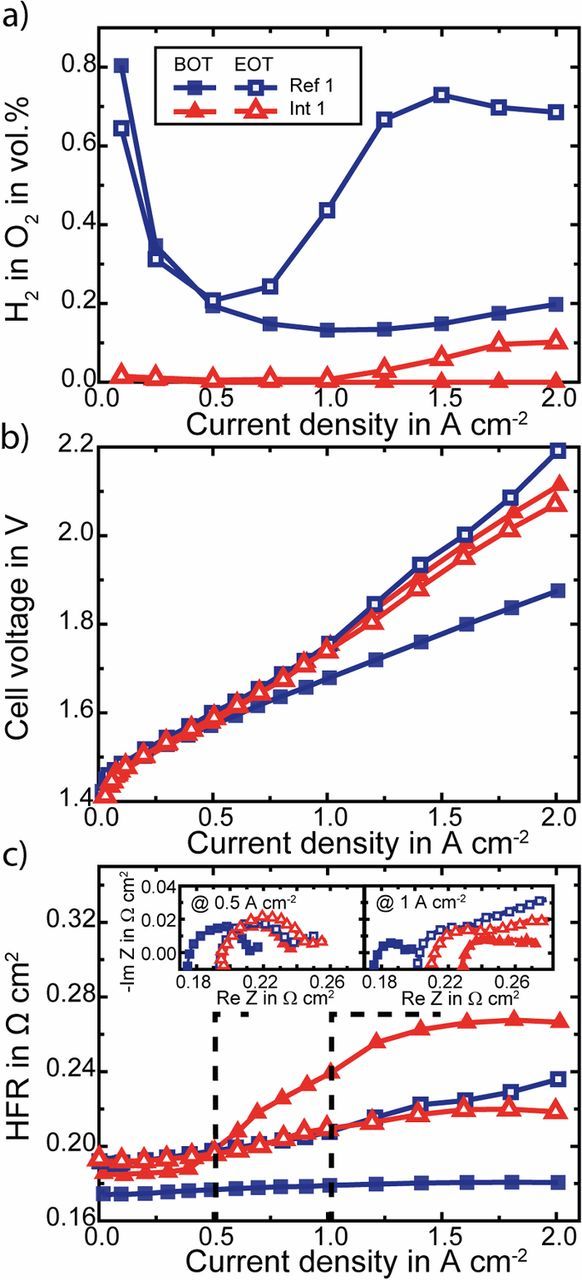
Figure 5. Comparison of the begin of test (BOT, solid symbols) and end of test (EOT, hollow symbols) measurements with respect to hydrogen in oxygen content at the anode side (a), cell voltage (b) and HFR (c) over current density. Exemplary shown for the Int 1 MEA (triangles) which has a membrane interlayer with recombination catalyst and Ref. 1 MEA (squares) with a Nafion N117 membrane without interlayer. Insets in c) show impedance data at 0.5 A cm− 2 (left) and 1 A cm− 2 (right).
Particularly noticeable in Fig. 5a is that the H2 in O2 content is higher for the EOT measurements at higher current densities. For the lower current densities the H2 content is nearly the same as before. For this reason, thinning or increases in permeability of the membrane cannot explain this behavior, since then the H2 content would increase for all current densities.
The increase in H2 in O2 content for the Ref. 1 MEA at EOT and current densities higher than 0.5 A cm− 2 can only be explained by a disproportionate, strong increase of H2 crossover at higher current densities. It is assumed that due to the degradation during the long-term experiments the mass transfer within the cathode was affected. Higher mass transfer limitations can lead to higher dissolved H2 concentration (supersaturation),11 which leads to a higher H2 crossover. This assumption is supported by the large semicircles at low frequencies of the impedance spectra that evolve especially at higher current densities, e.g. at 1 A cm− 2 for the EOT measurements (Fig. 5c), right inset). These low frequencies impedance data are often related to mass transport phenomena e.g.32,33 The disproportionate, strong increase of H2 crossover can also be seen for the EOT measurement of the Int 1 MEA. At higher current densities ( > 1 A cm− 2) small H2 in O2 contents can be measured, whereas at low current densities still no H2 reaches the anode. Thus, at low current densities enough O2 species for the recombination reaction exist at the interlayer and for higher current densities the H2 crossover increases in higher extent as the O2 crossover. Consequently, not all of the H2 crossover can be recombined because of missing O2.
Fig. 5b shows the polarization curves before and after the long-term runs for the Ref. 1 and Int 1 MEAs. The performance of the Ref. 1 MEA is drastically reduced. Particularly, this is caused by an increased HFR (Fig. 5c). In addition to the increase in HFR, the remaining losses e.g. kinetic and transport losses also increase, which can be seen by the larger semicircles of the Nyquist plots (insets of Fig. 5c) at 0.5 and 1 A cm− 2. Furthermore, the polarization curves of the Int 1 MEA are close together. The EOT curve is for current densities > 1 A cm− 2 even slightly better than the initial BOT curve and is mainly a result of the decrease in HFR (s. Fig. 5c). This might be explained by a reduction of the contact resistance between interlayer and membrane due to laminating. However, very similar to the Ref. 1 MEA the remaining losses (kinetic, transport) are also increased after the long-term experiment.
Conclusions
In this work the effect of integrating Pt nanoparticles as a recombination catalyst between a NR-212 and a N115 membrane of a PEM water electrolysis cell was shown. Already a Pt loading of 0.02 mg cm− 2 mitigates the H2 content of the anode and thus this strategy proved to overcome safety issues. Since at the beginning of the test no H2 could be detected within the anode, the loading of platinum could even be reduced.
When holding the MEAs at a constant current of 1 A cm− 2, no H2 was detected for over 70 hours. After this time only a small amount of H2 appeared, much lower than of the reference MEAs without recombination interlayer. The cell degradation by cell voltage during the constant current hold was not noticeably affected by the Pt interlayers.
Characterization of the MEAs after 245 hours of constant current hold revealed a strong increase for the H2 in O2 content in the high current density region ( > 1 A cm− 2). MEAs in which this feature was pronounced also showed a large second semicircle in the impedance spectra at low frequencies that suggest mass transport limitations. However, the reason of this degradation is not fully understood so far and needs further investigation.
The fact that at current densities below 1 A cm− 2 MEAs with Pt interlayer show no H2 in O2 even after 245 hours of constant current hold proves that the Pt was still active and worked as recombination catalyst. However, at higher current densities it is assumed that not enough O2 was present to recombine all permeating H2. This disproportionately can be explained by the stronger increase of H2 crossover through the NR-212 membrane attached to the cathode, in comparison to the O2 crossover through the N115 membrane, on the anodic side of the Pt interlayer. Thus better recombination could be reached by optimizing the position of the interlayer or a better distribution of the Pt particles.
Additionally, depending on the H2 and O2 permeation rates the ideal position of the interlayer varies. For instance, operation at differential pressure shifts the optimal position of the interlayer toward the lower pressure side. A theoretical examination of the optimal position is provided in the Appendix.
The interlayer not only favors recombination of H2 and O2 inside the membrane but also reduces O2 which permeates into the cathode. If Pt is used as the cathodic catalyst, a recombination catalyst within the membrane can increase the faradaic efficiency by reducing the amount of permeating O2 which can recombine with H2 within the cathode. Additionally, also related degradation mechanisms might be reduced.
If another cathode catalyst material is used, e.g. a cheap platinum group metals free catalyst, which is not active for the recombination of permeated oxygen with hydrogen within the cathode, than the produced hydrogen can be contaminated with O2 in H2.34 Consequently, a recombination interlayer can increase the purity of the produced H2 and also reduce the safety issues related to O2 within H2.
One disadvantage of the interlayer of this work is the increase of ohmic losses (HFR). However, as seen on the example of fuel cells where despite Pt additives no increase in HFR was detected,17,23 this could be solved by improving the interlayer morphology and the membrane-membrane interface, e.g. by hot pressing prior to assembly or increasing the clamping pressure. Furthermore, a Pt recombination layer can be used to reduce HFR losses by employing thinner membranes without increasing the H2 in O2 content.
Acknowledgments
The authors thank Chuyen Pham for helpful discussions throughout the project and providing material for pretests. Also, the authors would like to express very great appreciation to Ralf Thomann for imaging characterization. The authors gratefully acknowledge the financial support by the Federal Ministry of Education and Research of Germany in the framework of PowerMEE (project number 03SF0536).
ORCID
C. Klose 0000-0002-3052-7757
P. Trinke 0000-0002-0935-5321
B. Bensmann 0000-0001-8685-7192
S. Vierrath 0000-0002-4505-2803
S. Thiele 0000-0002-4248-2752
: Appendix: Theoretical Examination of Ideal Position of Recombination Interlayer
In the presented contribution the H2 in O2 content could be significantly reduced by implementing Pt particles as a recombination interlayer (Int) inside the polymer electrolyte membrane (PEM). At the Pt particles H2 and O2 recombine to H2O. Here we present a short theoretical examination where inside a PEM this interlayer should be placed in order to recombine all of the H2 and O2.
The calculations for this are based on the following assumptions: (i) the activity of the interlayer regarding the recombination of H2 and O2 to H2O is very high. Consequently, all gases are recombined directly at the recombination interlayer. Hence the dissolved gas concentration at the interlayer is close to zero, (ii) the thickness of the recombination interlayer is negligible compared to the membrane thickness  and (iii) the diffusion of H2 and O2 can be described with Ficks first law.
The dimensionless position of the interlayer is given by ξ and is defined by Eq. A1
![Equation ([A1])](https://content.cld.iop.org/journals/1945-7111/165/16/F1271/revision1/d0001.gif)
where x is the position of the interlayer and  the membrane thickness. The through plane direction is toward the anode, consequently at ξ = 0 is the cathode and at ξ = 1 is the anode side of the PEM. The diffusion path length, which H2 has to permeate from the cathode side until reaching the interlayer therefore is given by
  . The diffusion path length O2 has to permeate from the anode side toward the interlayer is given by
  . Including these diffusion path lengths and the previously stated assumptions into Ficks first law of diffusion, we get the following Eqs. A2 and A3 for the H2 and O2 diffusion fluxes toward the recombination interlayer
![Equation ([A2])](https://content.cld.iop.org/journals/1945-7111/165/16/F1271/revision1/d0002.gif)
![Equation ([A3])](https://content.cld.iop.org/journals/1945-7111/165/16/F1271/revision1/d0003.gif)
with  being the permeability coefficient of the PEM for H2 and O2. The values in literature for the permeability coefficients vary for different pretreatments of the PEM and measurement techniques, as it was shown by Ito et al.,6 and are here approximated by
  in good agreement with e.g. Sakai et al.35 The partial pressures of H2 and O2 are calculated by subtracting the saturated vapor pressure of H2O from the half-cell pressures.
Under the assumption that the best position, where all H2 and O2 recombine to H2O, is given by  , we get
![Equation ([A4])](https://content.cld.iop.org/journals/1945-7111/165/16/F1271/revision1/d0004.gif)
Figure A1 shows the results of the derived Eq. A4 as ideal dimensionless position of the recombination interlayer ξ plotted versus the cathode pressure (up to 30 bar) for different anode pressures. It can be seen, that for balanced pressure operation (green line) the ideal position of the interlayer is at  distance from the cathode side. This is due to the ratio of 2 of the hydrogen and the oxygen permeability. The position changes for different ratios, e.g. for a ratio of 2.3 as used by Schalenbach et al.3 the ideal position for balanced pressure would be at
  distance from the cathode side. In any case at differential pressure operation with
  , the interlayer should be positioned closer to the anode side (gray area). In the more unusual situation, when the cathode pressure is lower than the anode pressure
  , the position of the recombination interlayer should be chosen closer to the cathode side.
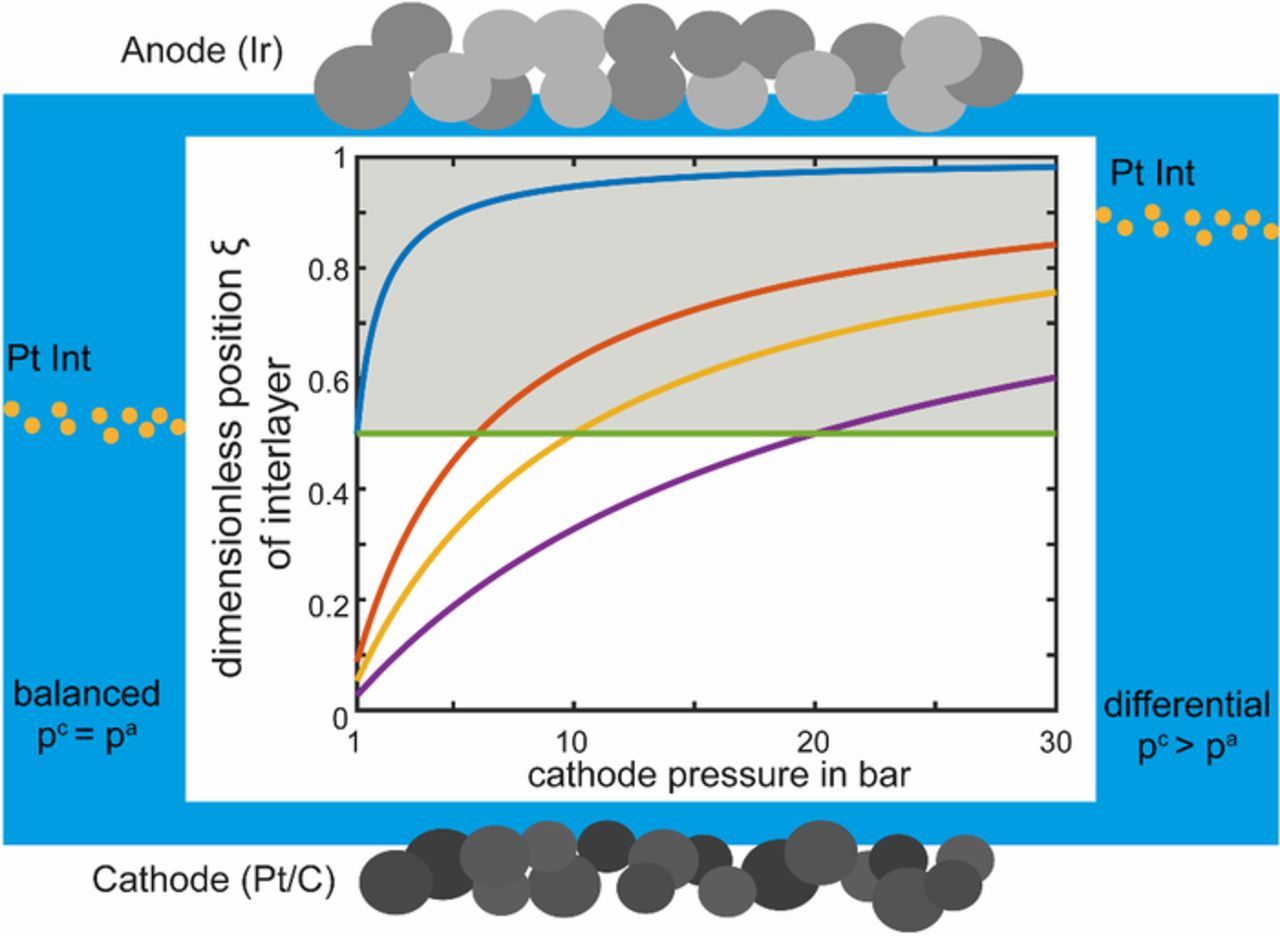
Figure A1. Ideal dimensionless position of a recombination interlayer (hydrogen flux twice the amount of oxygen flux) versus the cathode pressure. For anode pressures of 1 bar (blue), 6 bar (red), 10 bar (yellow), 20 bar (purple) and balanced (green) pressure conditions. Calculations are for 80°C.