Abstract
Prelithiation is a strategy of increasing importance for high energy density, long cycle life cells. This paper provides a thorough understanding of the implications of prelithiation on cell design and a phenomenological understanding of the behavior of prelithiated negative electrodes in full cells. In a first part, an idealized electrode stack model is derived showing the variation of energy density with prelithiation. Two regimes are identified, the first where prelithiation allows increased energy density by compensating the irreversible capacity of the negative electrode and a second where further prelithiation provides a lithium reservoir to compensate ongoing cycling losses. In a second part coin and cylindrical full cells are used to demonstrate the two regimes. Full coin cells are used to show the impact of the lithium reservoir and the impact of the coulombic efficiency of the negative electrode on the cycle life of a prelithiated cell. Cylindrical 2Ah cells are used to demonstrate the impact of accurate and repeatable roll to roll prelithiation combined with an engineered Si alloy. A cylindrical cell with a prelithiated negative electrode containing 55 wt% Si alloy demonstrated 80% capacity retention at 500 cycles and a coulombic efficiency of over 99.9% up to 700 cycles.
Export citation and abstract BibTeX RIS

This is an open access article distributed under the terms of the Creative Commons Attribution 4.0 License (CC BY, http://creativecommons.org/licenses/by/4.0/), which permits unrestricted reuse of the work in any medium, provided the original work is properly cited.
Prelithiation is a strategy which has been receiving increased attention with the desire to use novel active material chemistries in commercial Li-ion batteries. At a high level, prelithiation consists in introducing extra lithium into a Li-ion cell. Prelithiation has long been considered with many examples dating back to the 1990s, but widespread adoption has yet to occur as an industrially scalable, safe and cost-effective approach is needed for commercialization. A recent review details the body of research literature on prelithiation and it will only be briefly covered here with select examples.1 In the laboratory, a variety of strategies can be adopted to include extra lithium in a Li-ion cell. Li metal can be included in the cell by direct contact,2,3 via stabilized lithium metal powder (SLMP),4 or with thin Li foils.5 In-situ, electrochemically activated prelithiation can occur via sacrificial salts,6 or irreversibly reacting components in the negative electrode7 or positive electrode.8 Positive electrode materials that are overlithiated or have large irreversible capacities can be used to compensate the irreversible capacity of negative electrodes.9,10 Finally, electrochemical lithiation of the negative electrode can be done prior to full cell assembly by making a half cell and then extracting the electrode and placing it into a full cell.
None of the aforementioned laboratory approaches can be commercialized easily, as a roll-to-roll approach is required for straightforward commercialization. In this paper, a scalable roll-to-roll electrochemical prelithiation is used to demonstrate 2 Ah cylindrical cells having prelithiated negative electrodes with high levels of 3M Si alloy. This electrochemical approach, described in Nanoscale Components' patent, completely avoids the use of lithium metal to eliminate the associated safety risk.11 Excellent uniformity of prelithiation dosage was demonstrated. The resulting full cells built with the prelithiated anode demonstrate dramatic improvements in capacity as well as cycle life, as compared to control (not prelithiated) cells using the same materials.
Most prelithiation discussions focus simply on compensating the irreversible capacity of the negative electrode, and thereby increase capacity and energy density. As detailed in this paper, the impact of prelithiation on cycle life can be modelled as well. The impact of prelithiation on cell design considerations is discussed by extending an idealized cell model to include prelithiation. Consequences on energy density, irreversible capacity and electrode design are illustrated. Full coin cell results with two different chemistries are then used to experimentally demonstrate some of the conclusions of the theoretical exercise.
It will be noted that the coin cells whose negative electrodes are prelithiated with laboratory half cell techniques do not exhibit as favorable a cycle life as the cylindrical cells made with anodes that were prelithiated with the scalable roll-to-roll electrochemical process; in the disassembly of laboratory half cells, some electrode damage inevitably occurs. The industrial approach used for the 2 Ah cylindrical approach avoids such damage. Nonetheless, the coin cell data is presented as useful demonstration of the theoretical model.
Cell Design with Prelithiation
The impact of novel materials and approaches must be evaluated in cell models to quantify possible gains. Here, the idealized cell model proposed by Obrovac and Chevrier12 is extended to include prelithiation. The extended model is then used to quantify the various benefits and consequences of prelithiation. An identical nomenclature is adopted where an overbar ( − ), a tilde (∼), and a check (∨) indicate areal capacity (mAh/cm2), volumetric capacity (mAh/cc), and energy density (Wh/L) respectively.
Figure 1 shows schematic voltage curves versus Li metal of a negative and positive electrode where the negative electrode has been prelithiated (typically before assembly of the full cell) by an amount QP =  Q−0, where is the prelithiation expressed as a percentage of the first lithiation capacity of the fresh negative electrode and Q−0 is the first lithiation capacity of the fresh negative electrode. The safety factor (α) is the relative amount by which the negative electrode capacity extends beyond the positive electrode capacity. In an unprelithiated cell ( = 0) the safety factor is equivalent to the "N/P" ratio. Another new variable is QRes, the capacity remaining in the negative electrode after the positive electrode has been delithiated then fully lithiated and the full cell reaches its lower cutoff voltage, this capacity is coined the "lithium reservoir" and can be calculated to be:
![Equation ([1])](https://content.cld.iop.org/journals/1945-7111/165/5/A1129/revision1/d0001.gif)
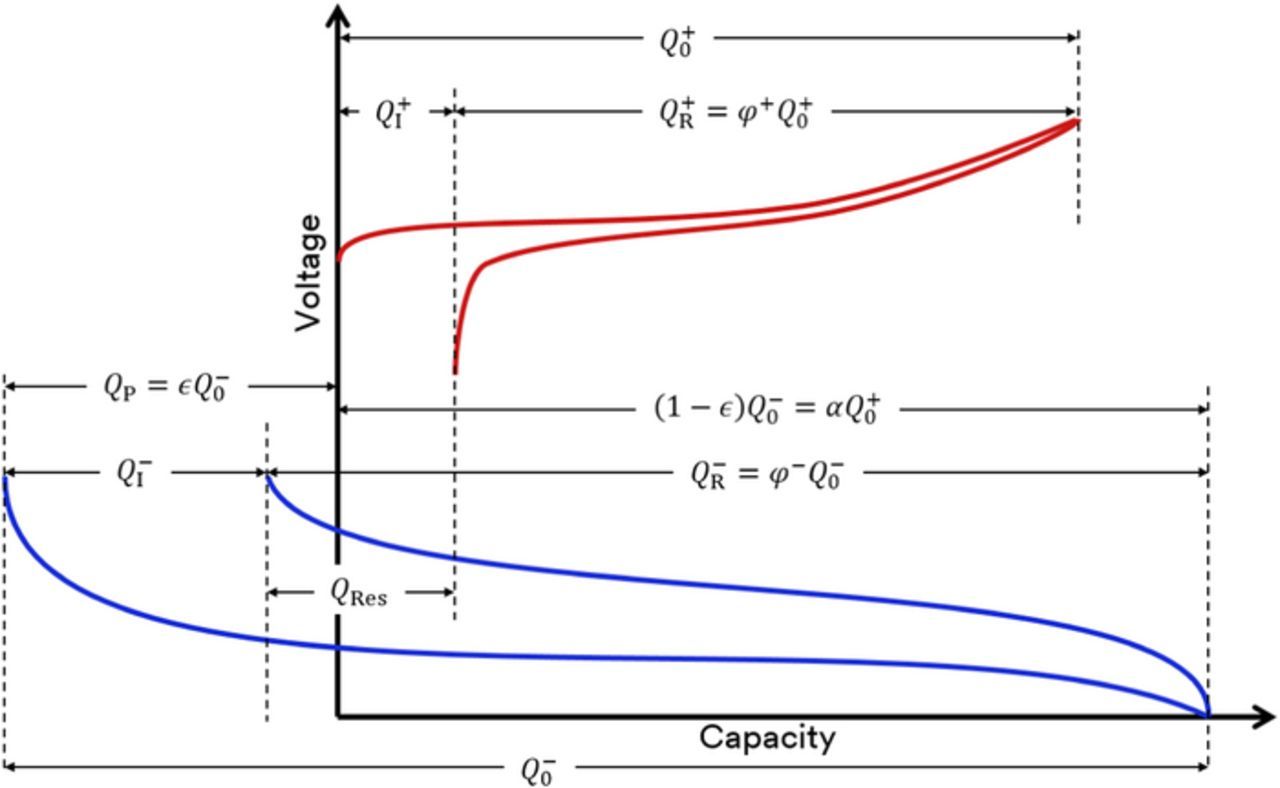
Figure 1. Schematic of the positive and negative electrode voltage curves versus Li metal. The negative electrode has been prelithiated by an amount QP.
In the idealized model of Obrovac and Chevrier, irreversible capacity had been omitted for simplicity, but must be included when considering prelithiation. The irreversible capacity of the prelithiated negative electrode is defined as  , where φ− is the first cycle efficiency of the negative electrode. Note that this number may be negative if the prelithiation dosage is higher than the first cycle loss of the anode. The irreversible capacity of the full cell (
 ) will therefore be
![Equation ([2])](https://content.cld.iop.org/journals/1945-7111/165/5/A1129/revision1/d0002.gif)
The cathode initial areal capacity has the same definition as in Ref. 12
![Equation ([3])](https://content.cld.iop.org/journals/1945-7111/165/5/A1129/revision1/d0003.gif)
where  and t+ are the reversible volumetric capacity and coating thickness of the positive electrode respectively. The coating thickness of the negative electrode for a given cathode capacity and safety factor must also take into account the prelithiation and can be shown to be:
![Equation ([4])](https://content.cld.iop.org/journals/1945-7111/165/5/A1129/revision1/d0004.gif)
where  is the reversible volumetric capacity of the negative electrode and must be calculated using the total volume of the fully expanded negative electrode including its porosity (not its pristine volume and not the volume corresponding to the reversible capacity only).
When a reservoir is present, the useable capacity in the negative electrode will have a lower average delithiation voltage, leading to a prelithiated cell with a higher average discharge voltage than the conventional cell. To take this into account, the Si delithiation voltage is approximated as a line going from 0V at full lithiation through V−avg (e.g. 0.4V for Si) at half delithiation. One can then show that the average voltage of the full cell will be:
![Equation ([5])](https://content.cld.iop.org/journals/1945-7111/165/5/A1129/revision1/d0005.gif)
As in Reference 12 the reversible areal capacity of the full stack is  and the energy density of the full stack is
  . Combining Equations 2 through 5, one can show that the energy density of a full stack including a prelithiated negative electrode can be expressed as
![Equation ([6])](https://content.cld.iop.org/journals/1945-7111/165/5/A1129/revision1/d0006.gif)
The energy density can therefore be calculated using the average voltages, volumetric capacities and efficiencies of the negative and positive electrodes as well as the thicknesses of the cathode, separator and current collectors, the percent prelithiation, and the safety factor ratio. Equations 1 through 6 allow considerable insight into the consequence of prelithiation on a full cell design.
Table I lists the properties of idealized reference materials. Values for LCO and graphite are taken from Reference 12, though the LCO first cycle efficiency has been adjusted to represent current commercial materials. Table I also lists the properties of a composite electrode containing a 5:3 weight ratio of Si alloy and graphite, similar to the electrode composition used in cylindrical cells as discussed below (electrodes N5 and N6 in Table II). In all cases the active material layer is assumed to have a 70% active volume. Inserting these values in Equation 6 with no prelithiation ( = 0) and with identical thickness values to Reference 12 (t+cc = tcc− = 15 um, ts = 20 um, t+ = 55 um) yields stack energy densities for graphite, Si alloy, and a Si alloy:graphite composite of 702 and 787 and 777 Wh/L respectively. The addition of Si alloy in the composite results in an energy gain of 11% compared to the baseline example.
Table I. Properties of idealized active materials used in the cell model.
| Electrode | Pycnometer Density (g/mL) | Average Voltage (V) | Reversible Capacity (mAh/g) | Efficiency (%) | Expansion (%) |
|---|---|---|---|---|---|
| LCO | 5.05 | 3.90 | 150 | 96 | 0 |
| Graphite | 2.26 | 0.125 | 350 | 94 | 10 |
| Si Alloy | 3.46 | 0.40 | 1200 | 86 | 145 |
| Si Alloy:graphite (5:3) | 2.89 | 0.36 | 881 | 87 | 77 |
Table II. Description of electrodes used in this study including composition, areal mass loadings, and areal capacities in coin half cells. Cutoff voltages for half cells indicated in parentheses. See Table III for details of materials.
| Anodes | ||||
|---|---|---|---|---|
| Key | Dry weights | Loading (mg/cm2) | Lith. (5mV) (mAh/cm2) | Delith. (1.5V) (mAh/cm2) |
| N1 | 48 Si Alloy A/42 MAGE/10 LiPAA | 7.9 | 3.1 | 2.7 |
| N2 | 48 Si Alloy A/42 MAGE/10 LiPAA | 10.5 | 4.0 | 3.6 |
| N3 | 48 Si Alloy A/42 MAGE/10 LiPAA | 17.3 | 6.3 | 5.7 |
| N4 | 20 nSi/68 MAGE/2 SP/10 LiPAA | 6.9 | 3.5 | 3.2 |
| N5 | 55 Si Alloy A/21 BTR/12 KS6/2 SP/10 LiPAA | 4.2 | 3.4 | 3.1 |
| N6 | 55 Si Alloy A/21 BTR/12 KS6/2 SP/10 LiPAA | 5.1 | 4.3 | 3.9 |
| N7 | 30 Si Alloy B/62 BTR/8 LiPAA | 7.2 | 4.1 | 3.7 |
| Cathodes | ||||
| Key | Dry weights | Loading (mg/cm2) | Delithiation (mAh/cm2) | Lithiation (mAh/cm2) |
| P1 | 96 LCO/2 SP/2 PVdF | 15.5 | 2.4 (4.35V) | 2.3 (2.75V) |
| P2 | 94 NMC622/1.25 KS6/1.25 SP/3.5 PVdF | 15.9 | 2.7 (4.3V) | 2.4 (2.8V) |
| P3 | 94 NMC622/1.25 KS6/1.25 SP/3.5 PVdF | 19.3 | 3.4 (4.3) | 3.1 (2.8V) |
To visualize the impact of prelithiation, Equation 6 is used to calculate the energy density of a full stack with a prelithiated Si alloy:graphite composite as a function of prelithiation. Figure 2 shows that the energy density increases with prelithiation as the mismatch in irreversible capacity (IRC) between the negative and positive electrodes is reduced, and peaks when they are matched. IRC matching is illustrated in the second inset. If one continues prelithiation beyond IRC matching then the energy density starts decreasing. The energy density decreases since the negative electrode thickness must increase to accommodate the prelithiated Li while maintaining the same safety factor (α). This is clear from Equation 4 and illustrated in Figure 2. Figure 2 also shows that the Li reservoir (expressed as a percentage of the negative electrode first lithiation capacity:  ) is zero until the IRCs are matched and then increases monotonically.

Figure 2. Variation in properties of a full stack containing a 5:3 Si alloy:graphite negative electrode by weight as a function of prelithiation (). Gain in energy density relative to a reference graphite full stack is plotted on the left axis while Li reservoir (relative to first lithiation capacity of the negative electrode) is plotted on the right axis. Insets schematically show the voltage curves corresponding to the different regions in the energy gain.
Figure 2 allows one to determine the maximum gain in energy density from prelithiation for this particular cell configuration. This gain will be dependent on the relative IRCs of the positive and negative electrodes. The peak in Figure 2 shows that energy density gains of 20% are possible in this cell configuration.
Figure 2 also allows one to qualitatively gauge the benefit to cycle life of prelithiation. The Li reservoir will be slowly consumed when cycling the full cell assuming typical capacity fade and slippage found in negative electrode materials. If one knows the fade caused by the negative electrode in a control full cell one can choose a Li reservoir level to approximately compensate for the fade. For example, Figure 2 shows that if one wants a 10% Li reservoir (to compensate for ∼10% fade) one needs ∼20% prelithiation and a significant increase in energy density will still be achieved. However, experimental results may be significantly better for two reasons. The first is that the capacity swing on the negative electrode will be lower than on the control and hence will lead to decreased capacity fade. The second is that the presence of a reservoir not only compensates the parasitic and mechanical failure losses and but also reduces them if it is present for a sufficient number of cycles. This is demonstrated in the cylindrical cell results.
In our experience, with commercially-sensible electrodes, a reservoir in the range of 10% to 20% provides a combined benefit of energy density and increased cycle life.
Finally, Figure 2 also suggests that a very large reservoir, and commensurately long cycle life can be achieved before the energy density returns to the unprelithiated control case. Figure 2 shows a prelithiation level of approximately 40% would yield the same energy density as the control case but would allow a large Li reservoir of 30%. One must be aware, however, that the coating thickness increase required to accommodate such a large prelithiation dosage might lead to other concerns such as impedance rise or delamination.
Methods
Electrodes
Negative electrodes
Table II lists the compositions and loadings of electrodes used in this study along with Table III which lists the material details. The LiPAA binder solution was prepared by neutralizing a 35 wt% aqueous solution of polyacrylic acid (PAA) (250K MW, Aldrich) with lithium hydroxide monohydrate (Aldrich) to obtain a 10 wt% LiPAA aqueous binder solution with a pH of approximately 7. Aqueous slurries for all anodes except N4 were mixed in a Ross PD-2 mixer and coated on 15 μm Cu foil using a TM-MC coater (Hirano Tecseed). The slurry for N4 was mixed in a Kurabo Mazerustar KK-250S and coated onto a 15 μm Cu foil using a hand coating bar and left to dry in ambient conditions overnight. Electrodes were calendered to 30–35% porosity. Si alloy A had a reversible capacity of 1080 mAh/g, a density of 3.43 g/cc and a surface area of 12 m2/g. Si alloy B had a reversible capacity of 1070 mAh/g, a density of 3.17 g/cc and a surface area of 12 m2/g. Further details on these types of alloys can be found in Reference 13.
Table III. Materials and used in electrodes.
| Key | Material | Name | Company |
|---|---|---|---|
| MAGE | Graphite | MAG-E | Hitachi |
| BTR-918 | Graphite | BTR-918 II | BTR New Materials |
| KS6 | Flake graphite | KS6L | Imerys |
| nSi | Si nanoparticles | Si 50–70 nm | Nanostructured and Amorphous Materials |
| SP | Carbon black | Super P | Imerys |
| LiPAA | Lithium polyacrylate | - | - |
| LCO | LiCoO2 | XD20 | Umicore |
| NMC622 | LiNi0.6Mn0.2Co0.2O2 | HX12 | Umicore |
| PVdF | Polyvinylidene fluoride | Kynar 761 | Arkema |
Positive electrode
Slurries for positive electrodes listed in Table II were prepared out of N-methyl-2-pyrrolidone (NMP, Sigma Aldrich) in a Ross PD-2 mixer and coated on 20 μm aluminum foil using a TM-MC coater.
Coin cells
All handling and assembly occurred in a dry room with a dew point of −50°C.
Negative electrode coin half cells
Electrodes were dried at 120°C under vacuum for 2 hours before cell assembly. Negative electrodes were punched (16 mm diameter) for use in 2325-button cells. Each cell contained an 18 mm diameter Cu spacer (900 μm thick), a 16 mm diameter disk of the alloy electrode, one 20 mm diameter microporous separator (Celgard 2400), 18 mm diameter disk of lithium (0.38 mm thick lithium ribbon, Aldrich) and an 18 mm Cu spacer (900 μm thick). One hundred micro liters of electrolyte solution was added to each cell. The electrolyte solution consisted of 90 wt% of 30/70 w/w EC/EMC in 1 M LiPF6 (Selectilyte LP57, BASF) and 10 wt% fluoroethylene carbonate (FEC) (Fujian Chuangxin Science and Technology Development). The coin cells were then cycled using a Maccor 4000 Series charger. The first two cycles were performed at C/10 with a C/40 trickle at 5mV and a delithiation up to 1.5V, subsequent cycles were performed at C/4 with a C/20 trickle at 5 mV and a delithiation up to 0.9 V.
Full coin cells
To prepare prelithiated full coin cells, negative electrode coin half cells were first assembled as described above and lithiated at C/10 until the desired capacity. The half cells were then disassembled and the negative electrodes were used in coin full cells (2325 type) and paired with a positive electrode. Control full coin cells used a fresh negative electrode. Each cell contained an 18 mm diameter Cu spacer (760 μm thick), a 16 mm diameter negative electrode, two 20 mm diameter separators (Celgard 2325), a 16 mm diameter positive electrode and an 18 mm Al spacer (790 μm thick). One hundred micro liters of electrolyte solution as described above was added to each cell. Full cells were cycled on a Maccor 4000 Series cycler. A first cycle was performed at C/20, charging to 4.35 V and discharging to 2.75 V. Forty nine subsequent cycles were performed by charging at C/2 to 4.1 V and holding until C/5, then C/5 to 4.2 V and holding until C/10, then C/10 to 4.35 V and discharging at C/2 to 2.75 V. The above sequence was repeated until the desired number of cycles was reached. A "C" current corresponded to 170 mA/g of LiCoO2 and 15 min rests occurred between all charges and discharges.
Cylindrical cells
Roll-to-Roll prelithiation
Roll-to-roll prelithiation was performed by Nanoscale Components. Rolls with 50 m of coated lengths were prelithiated in an electrochemical bath, as described in Nanoscale Components' patent.11 Lithium chloride, a safe, low-cost lithium salt, is used as a precursor in a prelithiation bath with a non-flammable solvent. After prelithiation the electrodes were rinse, dried, and sealed in aluminized bags without being exposed to ambient air, and then shipped to 3M. Cross-web and down-web prelithiation uniformity was confirmed by punching small electrodes and testing them in half cells at Nanoscale Components. The standard deviation of the measured prelithiation dosages was 0.33% of anode capacity.
Cylindrical control cells
Control cells were assembled in a dry room. Electrodes were cut, tabbed and wound with a separator (Celgard 2325) in order to fit into older 18650 cylindrical cell hardware, which was slightly smaller than modern 18650 cells. The dry cells were then dried in a vacuum oven at 70°C overnight. The cells were then filled with 5 g of electrolyte and placed under −95 kPA vacuum for 30 minutes to ensure proper wetting. The cells were then crimped and left to stand overnight. The electrolyte used was 30 FEC/30 EMC/30 DMC/10 PC by weight in 0.95M LiPF6 + 0.05 M LiBOB with 2 wt%VC. Acronyms correspond to fluoroethylene carbonate (FEC), ethyl methyl carbonate (EMC), diethyl methyl carbonate (DMC), propylene carbonate (PC), lithium bis(oxalato)borate (LiBOB), and vinylene carbonate (VC).
Cylindrical cells with prelithiated negative electrodes
Positive electrodes were dried at 120 °C under vacuum for at least 2 hours. Separators, tabs, tape, and all can hardware were dried in a 70°C vacuum oven overnight before cell assembly. Aluminized bags as received from Nanoscale Components were opened and negative electrodes immediately cut, tabbed, wound, and placed in cylindrical cell hardware. Handling was performed with face shields to minimize moisture contribution from breathing. Cells were filled and vacuumed in an identical manner to the control cells and left to stand overnight.
Results and Discussion
Coin cells
Electrodes N1 – N4 in Table II were used for coin cell studies. Electrodes N1 through N3 were coated with the same slurry containing 3M Si alloy at various thicknesses, and the N4 electrode was coated using the nano-Si (Table III), as described in the methods. A first set of negative electrode half cells were built to confirm the appropriate cycling of the electrodes. Electrodes N1, N2, N3, and N4 were cycled in half cells as described in the methods and had discharge capacity retentions (Cycle 20/Cycle 2) of 99%, 98%, 96%, 89%, respectively. These retentions were sufficient for further testing in full cells.
Negative electrodes N1 through N3 were coated at varying loadings in order to test various prelithiation levels while maintaining an identical safety factor when paired with cathode P1. Table IV lists the prelithiation amounts and resulting properties when paired with the positive electrode. Figure 1 can be consulted for a visual representation of these values.
Table IV. Prelithiated negative electrode obtained from the corresponding electrodes in Table I. Prelithiated full cell properties are listed when combined with the positive electrode.
| Electrode | Active Si Material | Prelithiation dosage in half cell  (mAh/cm2) (mAh/cm2) |
Prelithiation Percent(QP/Q−0) | Lithium Reservoir  (mAh/cm2) (mAh/cm2) |
Remaining capacity  (mAh/cm2) (mAh/cm2) |
|---|---|---|---|---|---|
| N1L | Alloy | 0.18 | 6% | 0 | 2.9 |
| N2L | Alloy | 1.16 | 29% | 0.76 | 2.9 |
| N3L | Alloy | 3.46 | 55% | 2.78 | 2.9 |
| N4L | Nano-Si | 0.85 | 22% | 0.45 | 2.6 |
Table V lists the first cycle properties of the full coin cells with control and prelithiated negative electrodes. The full cell with negative electrode N1 represents a control cell with a reasonable safety factor and a full cell efficiency dictated by the negative electrode. The N2 full cell has a thicker negative electrode resulting in a lower 1st cycle efficiency and higher safety factor. Both cells correspond to the first inset in Figure 2. The N1L full cell does not have sufficient prelithiation to form a reservoir but the first cycle efficiency has improved. The N2L, N3L and N4L full cells have lithium reservoirs, so that the full cell efficiencies correspond to that of the LCO cathode (P1), consistent with the third inset in Figure 2.
Table V. First cycle properties of coin full cells with identical LiCoO2 positive electrodes (P1) and negative electrodes as indicated. See Figure 1 for the safety factor definition.
| Negative | Active Si | First Charge (mAh/cm2) | First Discharge (mAh/cm2) | Efficiency | Safety factor |
|---|---|---|---|---|---|
| N1 | Alloy | 2.70 | 2.28 | 84.4% | 1.14 |
| N2 | Alloy | 2.78 | 2.29 | 82.4% | 1.44 |
| N1L | Alloy | 2.65 | 2.27 | 85.7% | 1.09 |
| N2L | Alloy | 2.60 | 2.53 | 97.3% | 1.10 |
| N3L | Alloy | 2.60 | 2.53 | 97.3% | 1.10 |
| N4L | Nano-Si | 2.64 | 2.54 | 96.2% | 1.00 |
Figure 3 shows the cycling performance of the full cells listed in Table V. Cells N1 and N2 have very similar fade rates resulting from a combination of mechanical and parasitic losses. Cell N1L has slightly higher initial capacity due to the prelithiation but the fade rate is similar at least for the first 100 cycles. Since the prelithiation dosage was insufficient to provide a lithium reservoir, the capacity retention improvements are negligible. Cell N2L has high initial capacity due to the full utilization of the LCO, and has a lithium reservoir of ∼0.76 mAh/cm2. For the first 100 cycles the capacity retention is excellent followed by a sharp change in fade rate beyond 100 cycles. After 100 cycles the fade rate is similar to cell N1L. During the first 100 cycles the lithium reservoir is gradually consumed through mechanical losses and parasitic reactions but the capacity retention of the full cell is not affected. Once the lithium reservoir is fully consumed the mechanical and parasitic losses of the negative electrode will lead to capacity fade in the full cell which is why the fade rate is now equivalent to cell N1L. However in the case of cylindrical cells with roll-to-roll prelithiation, excellent cycling was obtained even after depletion of the Li reservoir. Cell N3L has a high capacity due to the full utilization of the LCO and a very large lithium reservoir of ∼2.78 mAh/cm2. The cell can therefore cycle for at least 300 cycles without depleting its reservoir resulting in an excellent capacity retention (∼93% at 300 cycles) compared to less than 60% retention at 300 cycles for controls. Cell N4L has a high capacity due to the full utilization of the LCO thanks to the presence of a lithium reservoir. The ∼0.45 mAh/cm2 lithium reservoir is consumed after only 20 cycles followed by rapid capacity fade. The particular nano-Si used in N4L has a very high surface area and poor microstructure stability resulting in high parasitics (low coulombic efficiency) as has been shown in a previous study.13 The consequences of the low coulombic efficiency (∼99%) are immediately apparent in the rapid consumption of the lithium reservoir. Cells N2L and N4L are very similar in design in terms of areal capacities and prelithiation levels, however they differ in the type of Si-based material.

Figure 3. Discharge capacity of full coin cells with identical LiCoO2 cathodes. Negative electrodes are indicated in the legend. Symbols indicate every 5th cycle.
The coin cell study presented above exemplified the various considerations needed when pairing prelithiated electrodes and the consequences on cathode usage and capacity retention in a full cell. The consequence of a negative electrode with poor coulombic efficiency was also illustrated. Combining the above experiments and cell models allows one to conclude that even with prelithiation, negative electrodes with high ongoing coulombic efficiencies are required. Indeed prelithiation levels needed to compensate the low coulombic efficiencies of a material like generic nano-Si would be so high that they would negate any potential energy density gains from using nano-Si. Furthermore, Si-based materials with high first cycle efficiencies will require lower levels of prelithiation to reach a given lithium reservoir. As noted earlier the results in this section required disassembly of coin half cells. During disassembly and subsequent re-assembly of full cells, negative electrode damage as well as moisture exposure inevitably occurred so that the above results, while useful for understanding the model, should not be viewed as optimized. These problems were avoided with cylindrical cells where the anodes were prelithiated industrially in a roll-to-roll process as shown in the next section.
Cylindrical cells
Negative electrodes N5 and N6 were coated from the same slurry. Electrode N5 had a lower loading and was designed to be paired with positive electrode P2 as a control. N6 was prelithiated by 0.9 mAh/cm2 (N6L), and paired with P2, resulting in a prelithiated cell with approximately the same safety factor as control. The control cell (N5|P2), cycled on a Neware BTS3000, had a first cycle formation charge at C/20 up to 4.2 V and down to 2.75 V. Subsequent cycling was performed with constant current constant voltage charging (CCCV) with parameters C/2, 4.2 V, C/20, and constant current (CC) discharging with parameters C/20, 2.75 V. A C/20 CC characterization cycle with identical voltage cutoffs was performed every 50 cycles. The prelithiated cell (N6L|P2), cycled on an ultra high precision Novonix cycler at 30°C, were formed in a manner to avoid lithium plating by ensuring that losses of the anode are complete before full lithiation as described in Nanoscale's patent.15 Specifically, the cells had three formation cycles at C/20 with upper cutoff voltages of 3.8 V, 4.0 V, and 4.2 V and a common lower cutoff voltage of 2.75 V. Subsequent cycling was performed at C/2 up to 4.2 V, then C/10 up to 4.2 V and C/20 up to 4.2 V followed by a C/2 discharge to 2.75 V with a C/20 cycle every 20 cycles (this was changed to every 50 cycles after a power outage near 300 cycles). This protocol is adopted to mimic the CCCV charge of the control cell while avoiding a potential hold step, which could decrease the accuracy of a coulombic efficiency calculation. A nominal capacity of 2 Ah was used to calculate all currents.
Figure 4 shows the formation cycles for both N5|P2 and N6L|P2 cells. Both cells have identical first charge capacities since they are built with identical positive electrodes, however the prelithiated cell has a higher discharge capacity since its first cycle efficiency is determined by the positive electrode while the first cycle efficiency of the control is determined by the negative electrode. The curvature of voltage at end of discharge confirms this with the shallower and sharper curvatures being characteristic of silicon delithiation and NMC lithiation respectively. The initial first ∼100 mAh of charge on the control occur at lower voltage due to the initial SEI formation on the negative electrode, which already occurred for the prelithiated cell prior to cell assembly. The prelithiated cell has a slightly higher average voltage due to the slightly lower average voltage of the prelithiated negative electrode. All the differences between the formation voltage curves of the control and prelithiated cell can therefore be explained by the prelithiation of the negative electrode. First cycle discharge capacities divided by the cathode coated area yield areal capacities of 2.2 and 2.4 mAh/cm2 for the control and prelithiated cells respectively. Based on the half cell data of N6, one can conclude that after a 0.9 mAh/cm2 prelithiation, 0.9-(4.3–3.9)+(2.7–2.4) = 0.8 mAh/cm2 remains available as a reservoir, which corresponds to a reservoir of 19% of negative electrode first lithiation capacity.
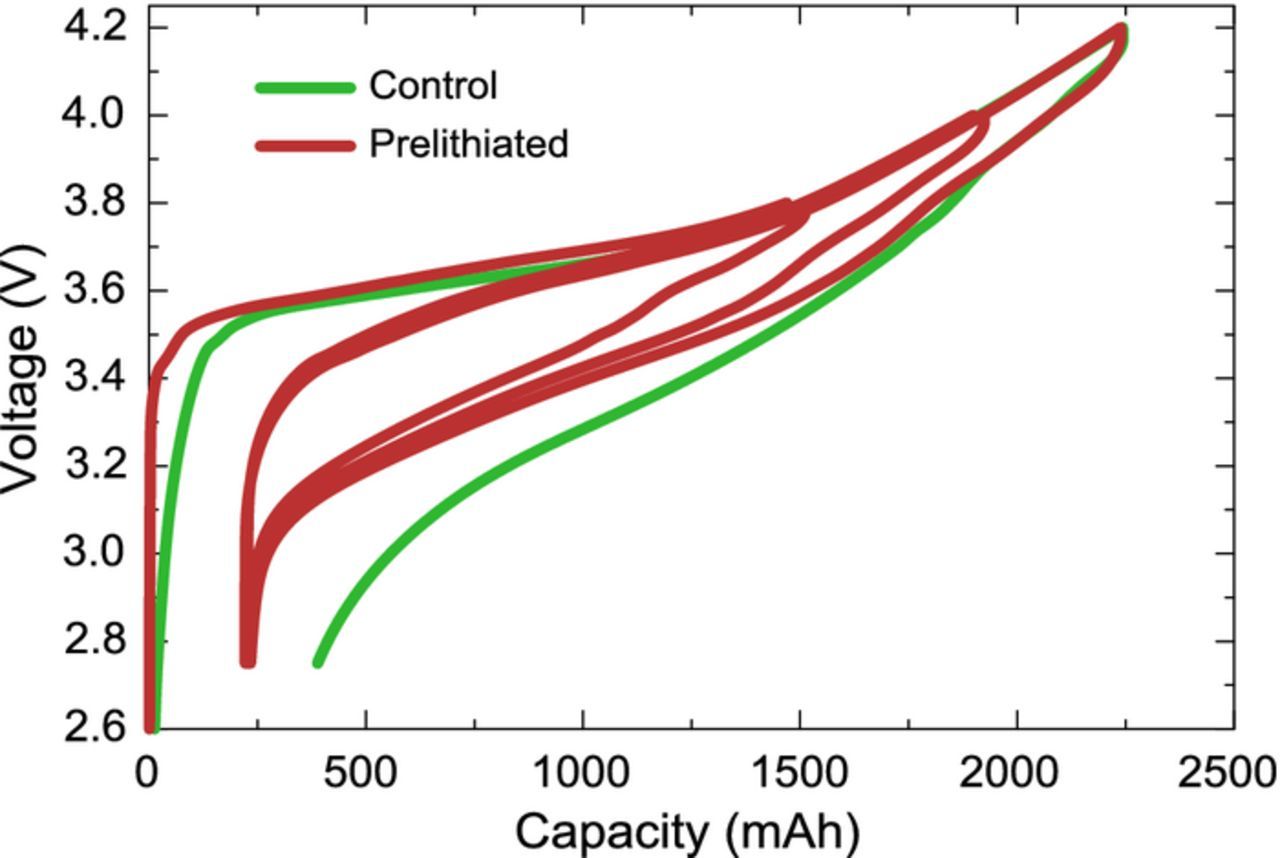
Figure 4. Voltage capacity curves of control (N5|P2) and prelithiated (N6L|P2) cylindrical cells with 55wt% Si alloy. See discussion for cycling protocol and explanation differing features.
Figure 5 shows the discharge capacity retention of the control and prelithiated cells. The negative electrodes in these cells contain 55 wt% Si alloy which corresponds to approximately 84% of the reversible capacity of the negative electrode. This is therefore a very high alloy content which usually leads to significant challenges concerning the effective long term cycling of the full cell. The control is seen to fade relatively quickly, on track to 80% capacity retention at approximately 150 cycles, before the cell was taken off the cycler. The prelithiated cell has a much better cycle life, reaching 80% at 500 cycles, and also shows much higher reversible capacity. The tremendous improvement in capacity retention for the first 300 cycles is due to the presence of the lithium reservoir, which reduces and compensates for the parasitic and mechanical losses of the negative electrode. A slight inflexion point can be seen at cycle 300 for the prelithiated cell. The origin of this inflexion point will be discussed below. Figure 6 shows the coulombic efficiency (CE) of the control and prelithiated cells. The control cell peaks at 99.8% CE, which while being good for a 55 wt% Si alloy cell, is not sufficient for commercial applications. On the other hand, the CE of the prelithiated cell peaks at above 99.95% near cycle 150, then decreases and levels slightly above 99.9%. It is noteworthy that after 700 cycles no sudden failure or drop in CE has occurred.

Figure 5. Discharge capacity retention of control (N5|P2) and prelithiated (N6L|P2) cylindrical cells. Characterization cycles at C/20 and others at C/2.
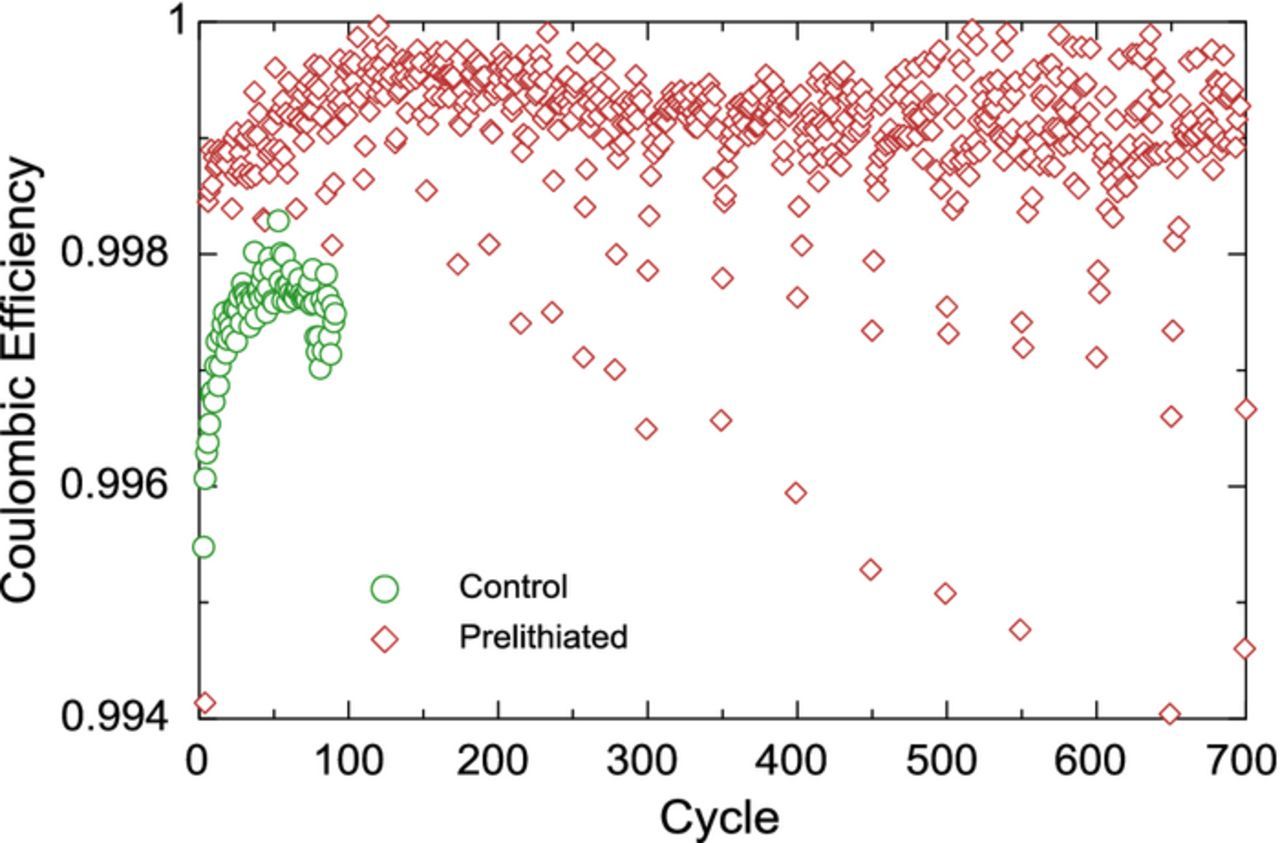
Figure 6. Coulombic efficiency of control (N5|P2) and prelithiated (N6L|P2) cylindrical cells. The points for the prelithiated cell with CEs lower than 99.9% are artifacts of the intermittent characterization cycles and are not representative of the true CE of the cell.
In order to understand the evolution of the lithium reservoir (QRes), dV/dQ fitting16 was performed using in-house software. Coin half cells were made from the parent electrodes and cycled in a Novonix cycler at 30°C at the same areal current as the C/20 cycles in the full cell. The third delithiation of the negative electrode and lithiation of the positive electrode were used to fit the discharge dV/dQ of the C/20 characterization cycles of the prelithiated cell. Figure 7 shows the fitting of the 22nd cycle (first characterization cycle after formation). The measured cell dV/dQ was aligned at 0. The fit is excellent and the majority of the features of the measured cell dV/dQ are reproduced. As expected, the negative electrode dV/dQ extends past the left of the positive electrode due to the prelithiated lithium reservoir.

Figure 7. dV/dQ fit of the first characterization cycle (cycle 22, C/20) of cell N6L|P2. Negative and positive reference curves were obtained from half cells at the same temperature and areal current density.
As the negative electrode is cycled and subjected to parasitic and mechanical losses, the lithium reservoir should decrease. To verify this, a dV/dQ fitting was performed for every characterization cycle. As the electrodes were cycled, the measured dV/dQ became harder to fit and was found impossible to reliably fit beyond 350 cycles. Indeed, the measured full cell voltage curve started to become smeared and the reference curves could no longer be used to fit it. The lithium reservoir, as illustrated in Figure 7 was tabulated for each characterization cycle. Figure 8 shows the evolution of the lithium reservoir with cycle number. A negative value indicates that the negative electrode has walked passed the cathode and the lower voltage cutoff in the full cell is now reached due to the delithiation of the negative electrode. Figure 8 shows the lithium reservoir varies monotonically and becomes depleted near 300 cycles, in agreement with the inflexion point seen in the cycling data of Figure 5. Calculating the lithium consumption rate of the negative electrode can therefore help determine the target prelithiation dosage, based on the desired cycle life. One must also take into account the positive effect of the reservoir on reducing ongoing parasitics and mechanical losses.
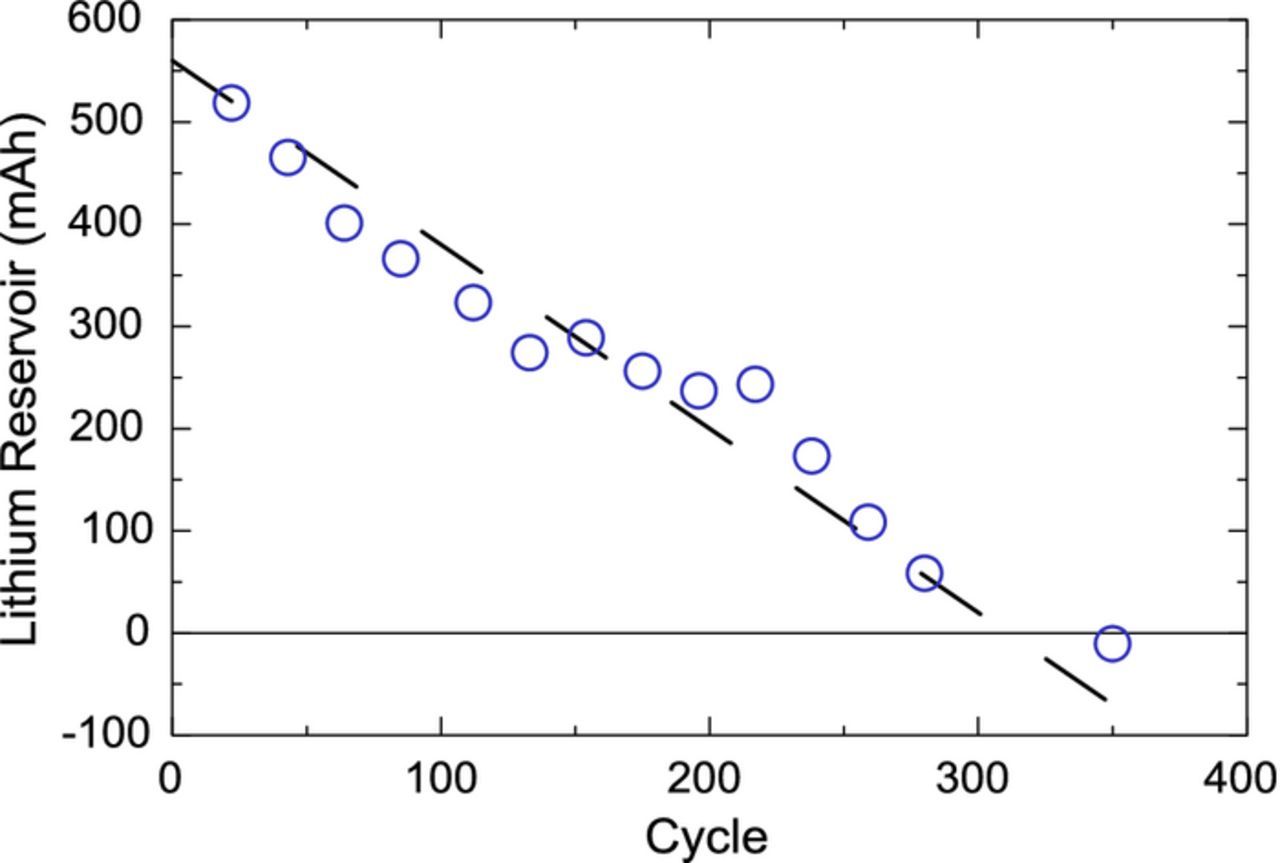
Figure 8. Lithium reservoir obtained from dV/dQ fitting of characterization cycles of cell N6L|P2. Dashed line is a guide to the eye.
The CE of Figure 6 can be reconsidered in light of the lithium reservoir data of Figure 8. Indeed, one can now conclude that from cycles 1 to 300, the measured CE is in fact primarily the CE of the positive electrode since both the UCV and LCV are triggered by the cathode and any losses occurring in the negative electrode are masked by the lithium reservoir. Beyond 300 cycles, the lithium reservoir is depleted and the LCV is triggered by the negative electrode, so the CE therefore primarily reflects the CE of the negative electrode. Consequently, Figure 6 shows that even after a 300 cycle runway during which the lithium reservoir is depleted, a 55 wt% 3M Si alloy negative electrode in a full cell can have a CE averaging 99.9%, a much higher CE than the control cell. This surprising result is not predicted by the cell model and highlights the positive impact prelithiation can have beyond the use of the reservoir on parasitics and mechanical degradation. One may speculate that a more stable SEI is achieved on the Si alloy once a sufficient number of cycles have occurred where a Li reservoir is present to compensate for the parasitics. Further study is needed on this topic.
A second series of cells with a higher areal capacity but lower Si alloy content (30 wt%) were coated and roll to roll prelithiated. Negative electrode N7 was prelithiated by 0.64 mAh/cm2 (N7L), and paired with P3, resulting in a prelithiated cell (N7L|P3) with a safety factor slightly above 1. Six cylindrical cells were assembled with the prelithiated electrodes as described above. The cells were cycled on a Maccor Series 4000 at 30°C. All cells were formed in a manner to protect from lithium plating.15 Cells 1–3 were formed at C/20 with upper cutoffs of 3.8, 4.0, and 4.2 V for cycles 1, 2, and 3 respectively, and a lower cutoff of 2.75 V. Cells 4–6 were charged at C/20 upper cutoffs of 3.9, and 4.2 V for cycles 1, and 2 respectively, and a lower cutoff of 2.75 V. Subsequent cycles for all cells was CCCV charging (C/2, 4.2 V, C/20) and CC discharging (C/2, 2.75 V). A C/20 cycle with the same voltage cutoffs was performed every 100 cycles. The variation in formation protocol did not yield a detectable impact. A nominal capacity of 2 Ah was used to calculate all currents.
Figure 9 shows the capacity retention of all the cells. Once more an excellent capacity retention is obtained with 80% capacity retention at 500 cycles for a full cell with 30 wt% 3M Si alloy. Good repeatability is obtained across cells, indicating that the prelithiation process is also repeatable. The design of these cells differs from the 55 wt% Si alloy cells in that the negative electrodes contain less Si alloy but also are thicker and have less prelithiation (0.64 mAh/cm2 instead of 0.9 mAh/cm2). Indeed, the need for prelithiation decreases as one reduces the Si-based material content leading to a reduction of capacity loss due to parasitics and mechanical losses. Based on the cathode coated area and characterization cycle discharge capacity, the N7L|P3 cylindrical cells had an average reversible areal capacity of 3.1 mAh/cm2. Of the prelithiated 0.64 mAh/cm2, approximately 0.64-(4.1–3.7)+(3.4–3.1) = 0.54 mAh/cm2 remains as a reservoir, which corresponds to a reservoir of 13% of the negative electrode lithiation capacity. This is less than the 19% of the N6L|P2 cells.
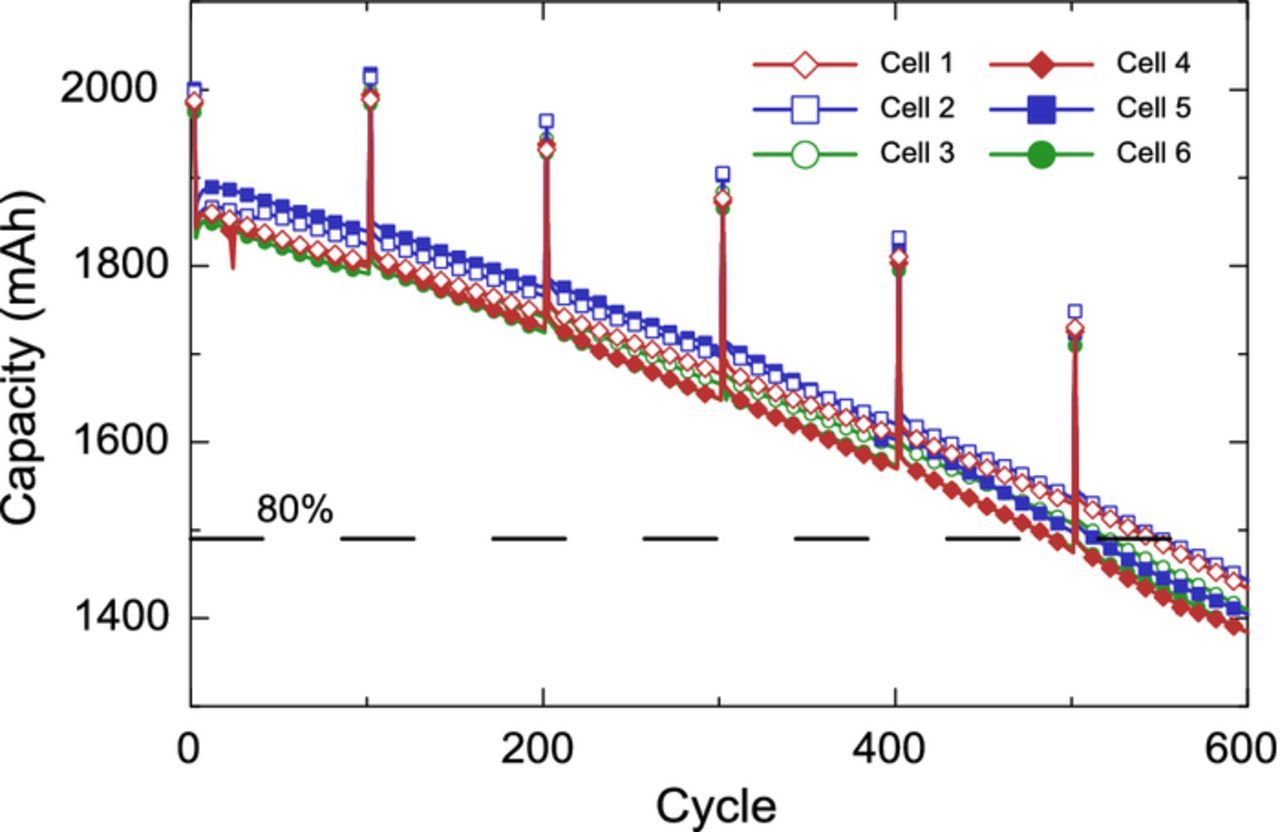
Figure 9. Discharge capacity retention of prelithiated (N7L|P2) cylindrical cells, showing repeatability across six cells. Characterization cycles at C/20 and others at C/2.
The results obtained with roll-to-roll prelithiation and cylindrical cells suggest prelithiation to be a viable method to increase the energy density and cycle life of Li-ion cells by enabling high-capacity materials. While prelithiation is often associated with increasing energy density, the theory and results presented above demonstrate how to leverage prelithiation to increase cycle life as well. The prelithiation method used in this study is highly controlled and allows one to achieve a desired prelithiation level, making this approach suitable for a broad range of applications. Indeed the ability of favoring energy density, cycle life, or both, as explained in the theoretical section means prelithiation and novel materials, such as Si-based negative electrode materials, can become suitable for different use cases. The high energy density case has been discussed at length above. In the design range exemplified, the negative electrode needs to be slightly thicker in order to accommodate the lithium reservoir but we found the rate capability of the negative electrode was not significantly impacted. The design range with extremely high prelithiation, and consequently significantly thicker negative electrode with lower rate capability, would likely have excellent cycle life but seems like an unlikely use case as other approaches are possible when cycle life is the primary target. Another more likely use case would be for high power cells, where the energy density of a Si-based material can be leveraged to obtain thinner negative electrodes, while the prelithiation would improve the energy density and possibly cycle life. In our opinion, industries which value energy density, such as portable electronics and electric vehicles, will spearhead the adoption of prelithiation.
Conclusions
Interest and activity related to prelithiation is growing in the field of Li-ion batteries in order to increase the energy density of full cells, to accommodate the irreversible capacity of novel materials, and to compensate ongoing losses with cycling. In this paper, the impact of prelithiation on cell design was derived and exemplified.
In a first part, a cell design model was derived to take into account prelithiation and the variation of energy density with prelithiation was described. This model is readily applicable by researchers and cell developers working with prelithiation to adjust their cell design and gauge the impact of prelithiation on energy density and electrode design. Two regimes were identified for prelithiated cells, the first where prelithiation allows one to increase energy density by compensating the irreversible capacity of the negative electrode and a second where further prelithiation can be used to provide a lithium reservoir to reduce and compensate ongoing losses during cycling.
In a second part coin and cylindrical 2Ah full cells were used to demonstrate the two regimes detailed in the cell design part. Coin cells were used to show the impact of the lithium reservoir as well as the impact of the coulombic efficiency of the negative electrode on the cycle life of a prelithiated cell. Cylindrical 2Ah cells were used to demonstrate the impact of accurate and repeatable roll-to-roll prelithiation. Two sets of cells with prelithiated negative electrodes containing 55 wt% and 30 wt% Si alloy were prelithiated to different levels in order to obtain 80% capacity retention at 500 cycles. Owing to the cycling with a lithium reservoir, the 55 wt% Si alloy cells had an average CE of above 99.9% even after 700 cycles.
In conclusion, these results suggest prelithiation to be a viable method to increase the energy density and cycle life of Li-ion cells by enabling high-capacity materials. Current state-of-the art cells contain low amounts of Si in order to maintain required cycle life characteristics. This study showed that much higher Si percentages are possible when carefully designing a prelithiated cell. The potential of roll-to-roll electrochemical prelithiation as an industrially scalable approach was also demonstrated.
ORCID
Vincent L. Chevrier 0000-0002-8725-0787