Abstract
The effects of various cationic substitutions in lithium-rich layered Li[Li0.2Mn0.4Co0.4-xMx]O2 (M = Cr, Fe, and Ni) on the electrochemical behavior and oxygen loss have been systematically investigated. Fe substitution dramatically decreases the reversible capacity of Li[Li0.2Mn0.4Co0.4-xFex]O2 due to the reduced oxygen loss from the lattice caused by a decrease in the metal-oxygen covalence and an irreversible migration of Fe3+ ions. With increasing Cr substitution, the reversible capacity of Li[Li0.2Mn0.4Co0.4-xCrx]O2 first increases due to the multi-electron transfer reaction of the Cr3+/6+ redox couple and then decreases due to reduced oxygen loss and irreversible migration of the smaller Cr6+ ions from octahedral to tetrahedral sites. With increasing Ni substitution, the reversible capacity of Li[Li0.2Mn0.4Co0.4-xNix]O2 also first increases because Ni3+ can be fully oxidized to Ni4+ before the oxygen loss begins while Co3+ can be oxidized only to around Co3.6+ and then decreases due to suppressed oxygen loss caused by the decrease in metal-oxygen covalence. Also, the Ni substitution raises the average discharge potential as Ni3+ ions will be reduced to Ni2+ before the Mn4+ ions are reduced to Mn3+. The study demonstrates the sensitivity and intricacies associated with the nature of the cations in lithium-rich layered oxide cathodes.
Export citation and abstract BibTeX RIS

This is an open access article distributed under the terms of the Creative Commons Attribution 4.0 License (CC BY, http://creativecommons.org/licenses/by/4.0/), which permits unrestricted reuse of the work in any medium, provided the original work is properly cited.
Since the successful commercialization of lithium-ion batteries by Sony in 1991, much attention has been focused on improving their electrochemical performance and safety by investigating new cathode materials,1–5 anode materials,6–10 and electrolyte additives.11–14 Currently, lithium-ion batteries are widely utilized as a power source for portable electronic devices, such as mobile phones and laptop computers. They are also being intensively pursued for large-scale applications in electric vehicles and grid storage of renewable energies, such as wind and solar.15,16 However, further improvement in energy density and cycle life as well as cost reduction are critical for utilizing the lithium-ion technology for these large-scale applications.
Lithium-rich layered oxides xLi2MnO3–(1-x)LiMO2 (LLOs, M = Co, Ni, Mn, et al.) are of great interest as promising cathodes for high energy lithium-ion batteries due to their high capacities of ∼ 250 mAh g−1 and low cost.17–22 During first charge, they exhibit an initial sloping region corresponding to the oxidation of transition-metal (TM) ions, and a subsequent plateau region assigned to an irreversible loss of oxygen from the lattice.23,24 The oxygen loss would induce the migration of TM ions from the surface to the bulk, leading to elimination of TM and Li vacancies in the bulk and formation of a spinel-defect phase on the surface. During first discharge, Li ions insert into the remaining Li vacancies and induce reduction of the TM ions. To compensate for the oxygen loss and Li vacancy reduction, some Mn4+ ions are reduced to Mn3+, producing a high discharge capacity. After the first cycle, reversible oxidation/reductions of the TM ions, including Mn, occur in subsequent charge/discharge cycles, without further oxygen loss. Obviously, the oxygen loss in the first cycle is special and plays an important role in determining the electrochemical performance of LLOs.
While previous studies have shown that factors such as the metal-oxygen bond strength and dimerization can affect the degree of oxygen loss,25,26 Wang et al. concluded that the metal-oxygen bond covalence and its subsequent effect on electron localization is the primary influence on the oxygen loss process.27 For instance, Ti substitution dramatically reduces the oxygen loss and reversible capacity due to the decrease in metal-oxygen bond covalence caused by a large separation between the Ti3+/4+: 3d and O2−: 2p bands and a strong binding of oxygen to Ti, while Co incorporation significantly enhances the oxygen loss and reversible capacity because of an increase in metal-oxygen covalence caused by an overlap of the Co3+/4+: t2g band with the top of the O2−: 2p band and a weak binding of oxygen to Co. Because of the critical and advantageous role of cobalt in LLOs, the xLi2MnO3–(1-x)LiNi1/3Mn1/3Co1/3O2 and xLi2MnO3–(1-x)LiCoO2 series of lithium-rich layered oxides have drawn much attention.28–31 Many approaches have been pursued to improve the electrochemical performance of the xLi2MnO3–(1-x)LiNi1/3Mn1/3Co1/3O2 series, including surface modification,32–35 cationic doping,25,36 and synthesis optimization.37,38 However, the focus on the xLi2MnO3–(1-x)LiCoO2 series has been mainly on the synthesis, structure, and electrochemistry,39–41 and other areas such as surface coating and cationic doping have yet to be explored.
With an aim to broaden the knowledge of designing LLOs with improved performance, we present here a systematic investigation of the effect of cationic substitutions on the oxygen loss, reversible capacity, and electrochemical behavior in the first cycle of the Li[Li0.2Mn0.4Co0.4-xMx]O2 (M = Cr, Fe, and Ni) series as a representative of the xLi2MnO3–(1-x)LiCo1-yMyO2 series where x = 0.5. These samples were carefully synthesized with a sol-gel method and characterized by X-ray diffraction (XRD), scanning electron microscopy (SEM), and electrochemical measurements.
Experimental
All samples were synthesized with a sol-gel method as described in our previous report.30 Required amounts of various TM acetates and lithium acetate were slowly added to a citric acid solution, in which the molar ratio of TM ions to citric acid was 1 : 1 and 5 wt% excess lithium acetate was used to compensate for the volatilization of lithium at high temperatures. Subsequently, the solution was evaporated under magnetic stirring at ∼160°C. The dried powder was heated at 450°C for 4 h to remove the residual organics. After being ground with a pestle and mortar, the powder was transferred into a furnace and fired at 900°C for 12 h. The heating and cooling rates were 3°C min−1.
The compositions of the samples were confirmed by inductively coupled plasma (ICP) analysis (Varian 715-ES). The morphology was observed with an SEM (JEOL JSM-5610). The crystalline phases were characterized by XRD (Philips diffractometer) with Cu Kα radiation, a scanning step of 0.02°, and a dwell time of 3 s. The lattice parameters were obtained by refining the XRD profile based on an α-NaFeO2 structure, with the Jade software.
For electrochemical measurements, the cathode was fabricated by uniformly mixing 80 wt% active material (LLOs), 10 wt% binder (polyvinylidene fluoride, PVDF), and 10 wt% conductive agent (Super P carbon) in N-methyl pyrrolidone solvent and then coating the mixture onto an aluminum sheet. CR2032 coin cells were assembled with the LLO as the cathode, lithium metal as the anode, 1 M LiPF6 in ethylene carbonate/diethyl carbonate (1 : 1 by volume) as the electrolyte, and Celgard polypropylene separator. The cells were charged/discharged on an Arbin battery cycler at 0.02 C rate, where the theoretical capacity was defined as 250 mAh g−1. For the first charge curves, the separation of the sloping and plateau regions was identified as the onset potential of the oxygen loss reaction obtained from the dQ/dV curves. Galvanostatic intermittent titration technique (GITT) testing was carried out with alternating 0.1 C charges of 10 min, followed by a 40 min rest, to probe the open-circuit potential (OCP) of the samples at different depths of charge.
Results and Discussion
As shown in Figure 1, Li[Li0.2Mn0.4Co0.4]O2 (x = 0 sample) exhibits the typical XRD pattern of the lithium-rich layered oxides, which can be well fitted based on a O3-type α-NaFeO2 structure with  space group, except for some weak peaks between 20° and 30° that are assigned to superlattice peaks resulting from an ordering of Li+ and Mn4+ ions in the TM layers.21,42 With increasing Fe substitution in Figure 1a, the peaks shift to lower angles due to the substitution of larger Fe3+ ions (0.63 Å) for Co3+ ions (0.545 Å). This is also supported by the linear increase in the lattice parameters (a, b and V) of Li[Li0.2Mn0.4Co0.4-xFex]O2 with increasing Fe content (Figure 2a). However, when the Fe content increases to x = 0.3–0.4, the samples show several additional peaks located at 30.5°, 35.9°, 43.6°, 57.7°, and 63.4° and enhanced intensity of the superlattice peaks. The additional peaks can be well indexed with a spinel-like
  structure, with the peaks corresponding to (220), (311), (400), (511), and (440) planes, indicating the formation of an impurity phase and the instability of the LLO phase at high Fe content. The enhanced intensity of the superlattice peaks with increasing Fe content suggests better cationic ordering between Li+ and Mn4+, signaling greater Li2MnO3-like behavior of the LLO phase. This means the spinel impurity phase is likely Fe-rich. Figures 1 and 2 also, respectively, present the XRD patterns and lattice parameters of the Li[Li0.2Mn0.4Co0.4-xCrx]O2 and Li[Li0.2Mn0.4Co0.4-xNix]O2 (0 ≤ x ≤ 0.4) series. Clearly, all samples exhibit similar XRD patterns, indicating that Cr and Ni substitutions do not affect the LLO structure. With increasing degree of Cr or Ni substitution, the lattice parameters almost linearly increase because of the substitution of larger Cr3+ (0.61 Å) and Ni3+ (0.56 Å) ions for Co3+ (0.545 Å) ions. As observed from the SEM images in Figure 3, the particle size and distribution of the samples do not significantly vary with Cr, Fe, and Ni substitutions, avoiding any influence of particle size on electrochemical behavior.
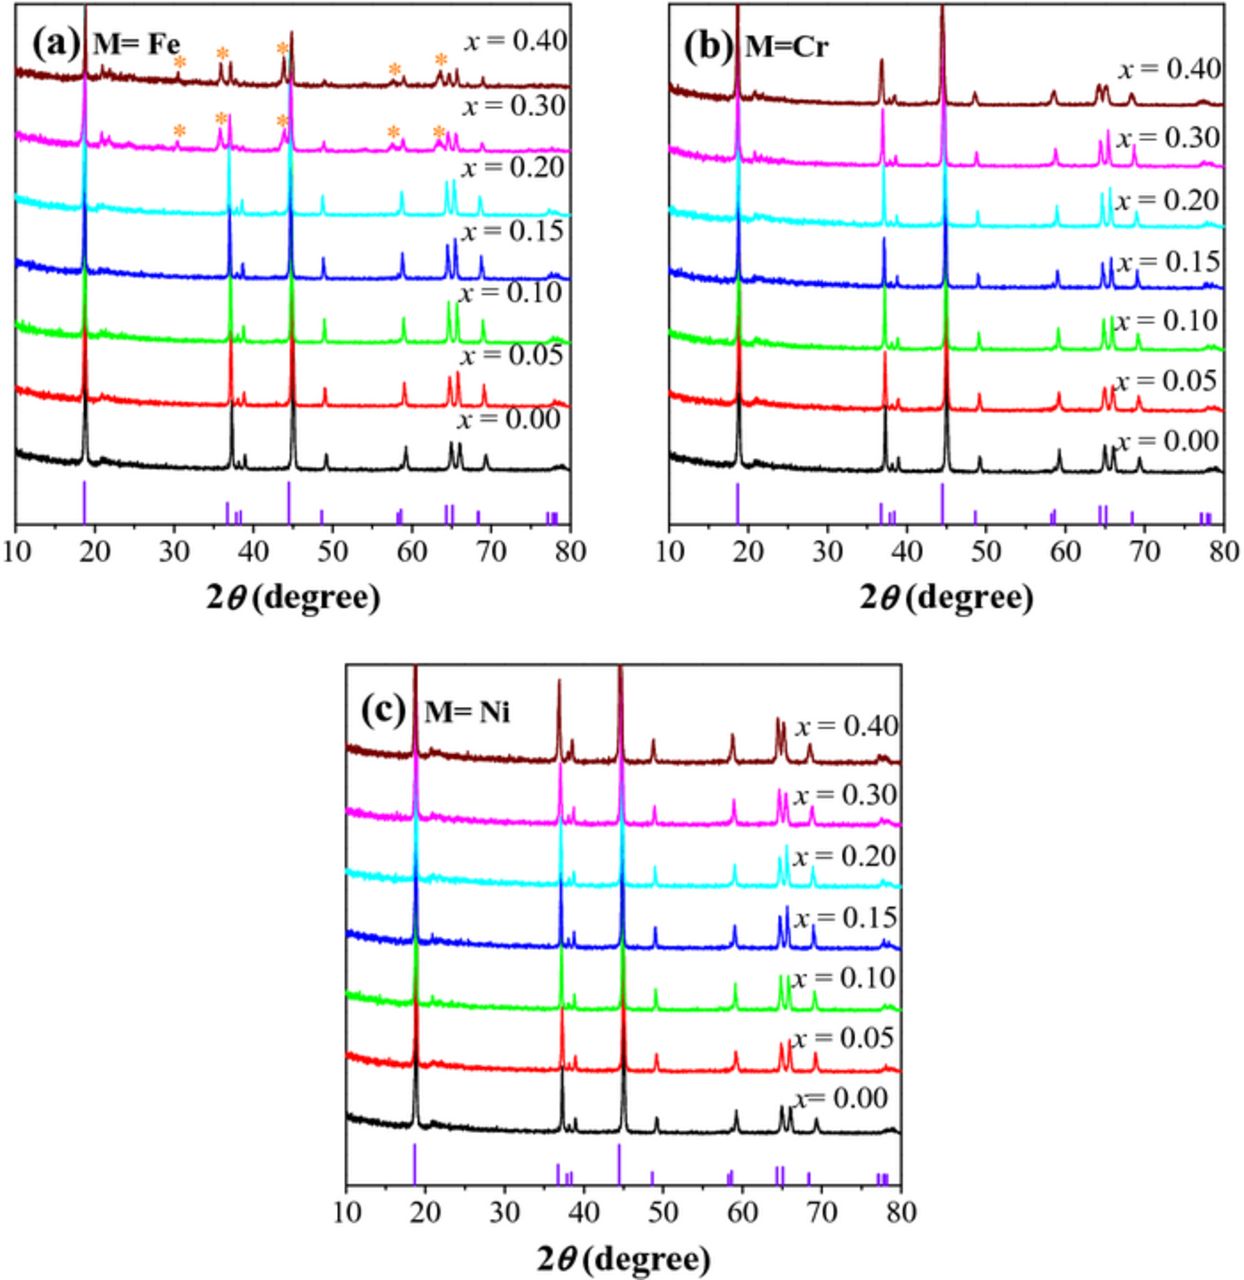
Figure 1. XRD patterns of Li[Li0.2Mn0.4Co0.4-xMx]O2: (a) M = Fe, (b) M = Cr, and (c) M = Ni.
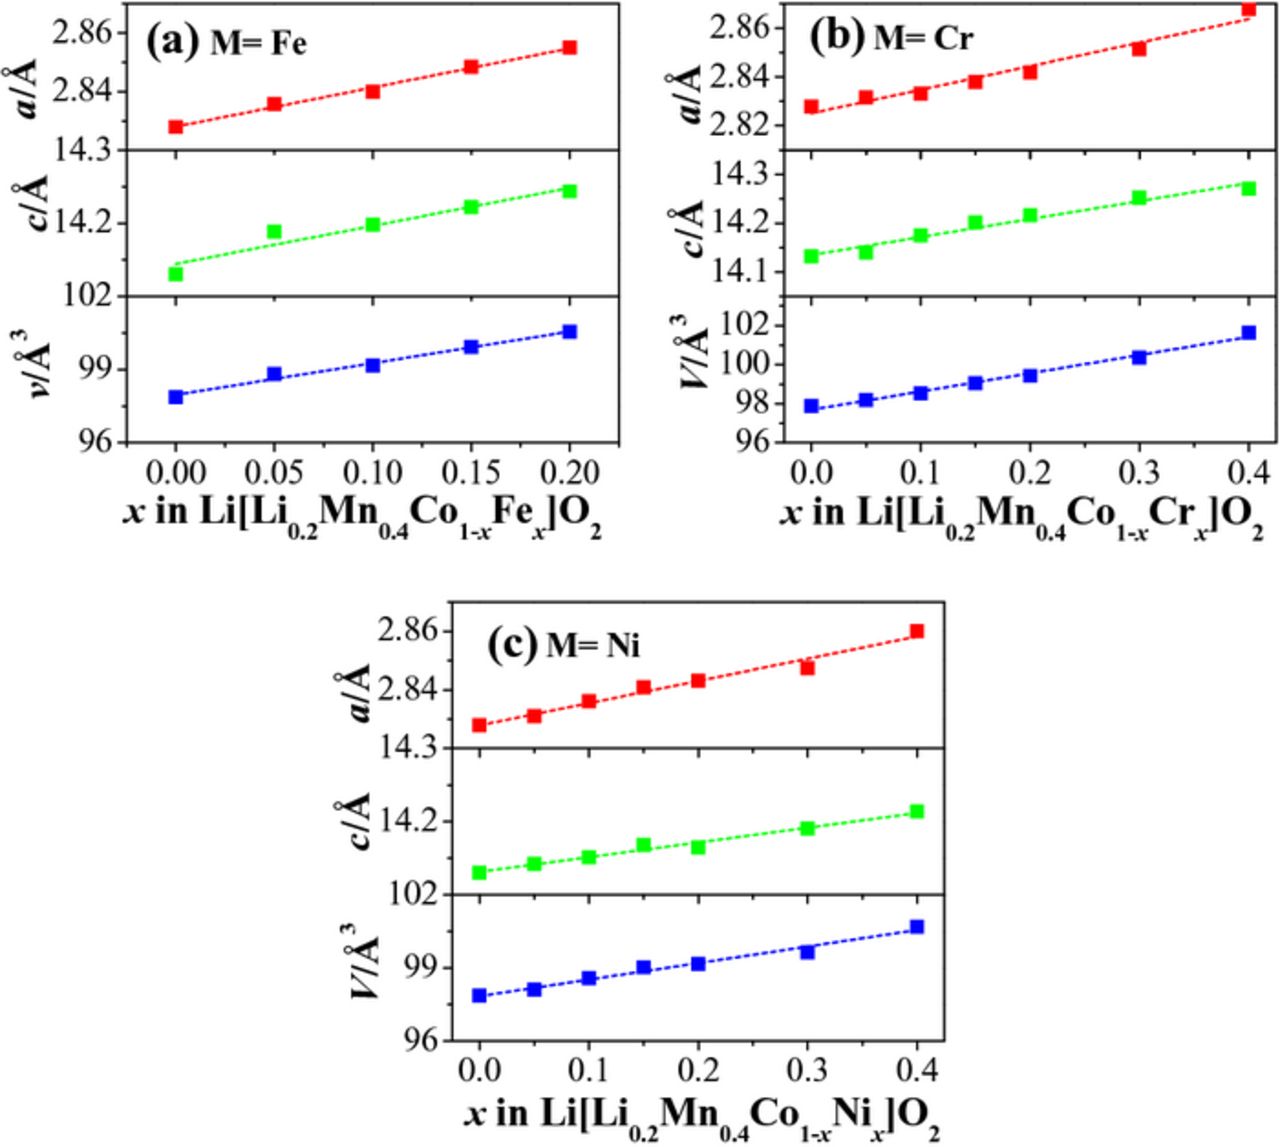
Figure 2. Lattice parameters of Li[Li0.2Mn0.4Co0.4-xMx]O2: (a) M = Fe, (b) M = Cr, and (c) M = Ni.
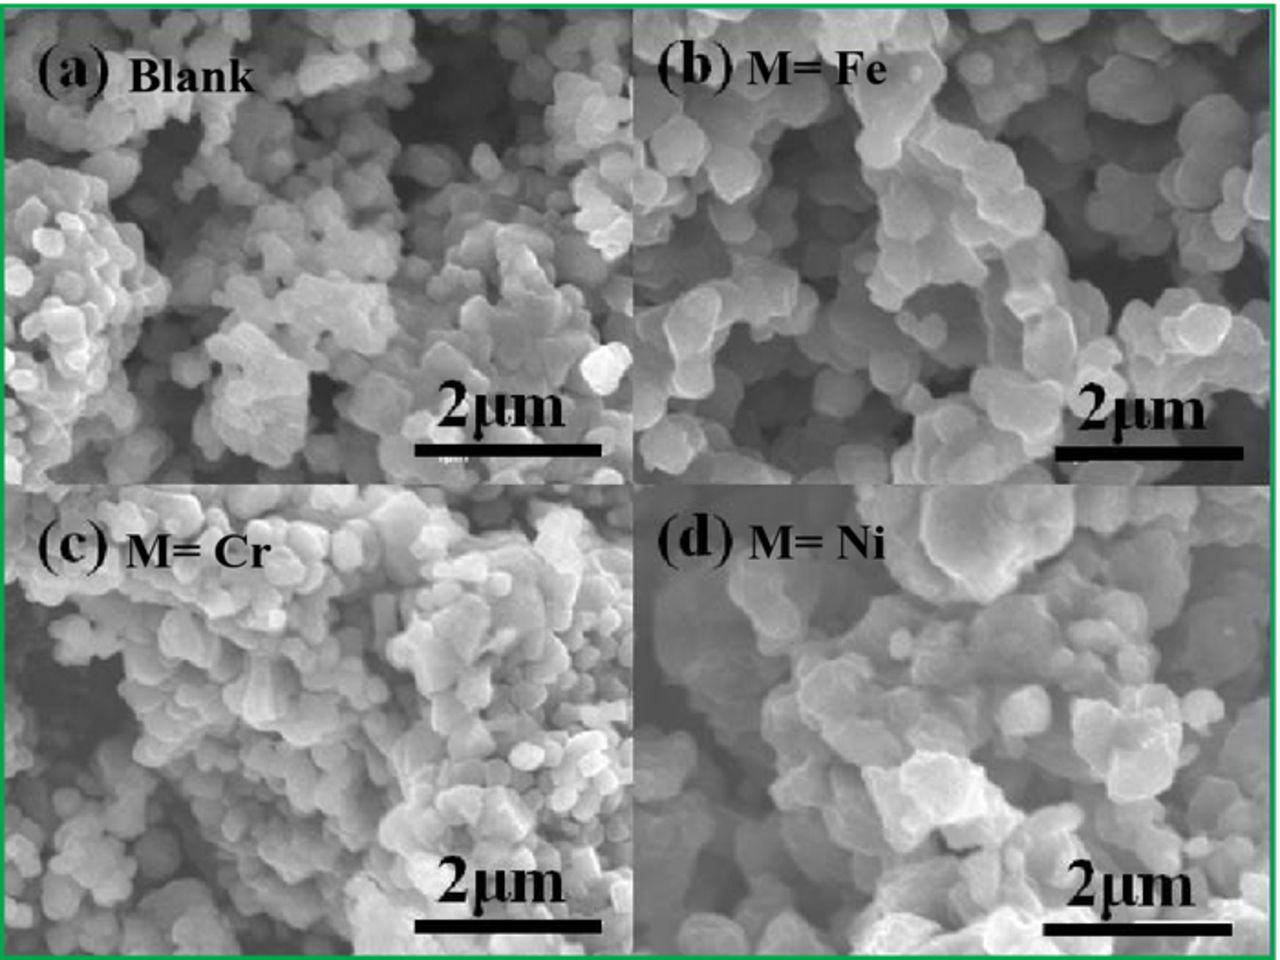
Figure 3. SEM images of (a) Li[Li0.2Mn0.4Co0.4]O2 and Li[Li0.2Mn0.4Co0.25M0.15]O2: (b) M = Fe, (c) M = Cr, and (d) M = Ni.
As seen in Figure 4, Li[Li0.2Mn0.4Co0.4]O2 exhibits the typical LLO first charge profile, with a sloping region corresponding to the oxidation of TM ions, followed by a plateau region assigned to the irreversible oxygen loss from the lattice. There is a large irreversible capacity (IRC) loss in the first cycle, due to the elimination of some oxygen vacancies and a corresponding number of lithium sites at the end of first charge. As revealed in Figure 4a, the substitution of Fe for Co in Li[Li0.2Mn0.4Co0.4-xFex]O2 does not change the general characteristics of the charge/discharge profiles of LLOs in the range of x = 0.0–0.2, but leads to a dramatic shortening of the sloping region and a complete disappearance of the plateau region in the range of x = 0.3–0.4. In the x = 0.0–0.2 region, the capacity in the sloping region increases, while the capacity in the plateau region generally decreases with increasing Fe content, as seen in Figure 5a. The increase in capacity in the sloping region is due to the ability of Fe3+ to be fully oxidized to Fe4+ before the oxidation of O2− ions begins as the Fe3+/4+: t2g band may not overlap with the top of the O2−: 2p band compared to that in the Li[Li0.2Mn0.4Co0.4]O2 (x = 0) sample (see Figure 6) and the lower covalence of the Fe-O bond. In the case of Li[Li0.2Mn0.4Co0.4]O2, a significant overlap of the Co3+/4+: t2g band with the top of the O2−: 2p band results in a beginning of the oxidation of O2− ions to oxygen and the plateau region around Co3.6+, resulting in a smaller sloping region than would be expected.22 On the other hand, the capacity in the plateau region decreases slightly with increasing Fe content due to the decrease in the metal-oxygen covalence caused by the lying of the Fe3+/4+: t2g band above the top of the O2−: 2p band. Although the Fe substitution suppresses the oxygen loss, the IRC loss is not significantly reduced possibly due to the migration of Fe3+ ions from octahedral sites in TM layers to tetrahedral sites in Li layers.43 Nonetheless, the discharge capacity decreases with increasing Fe content due to the reduced oxygen loss along with the irreversible migration of Fe3+ ions.
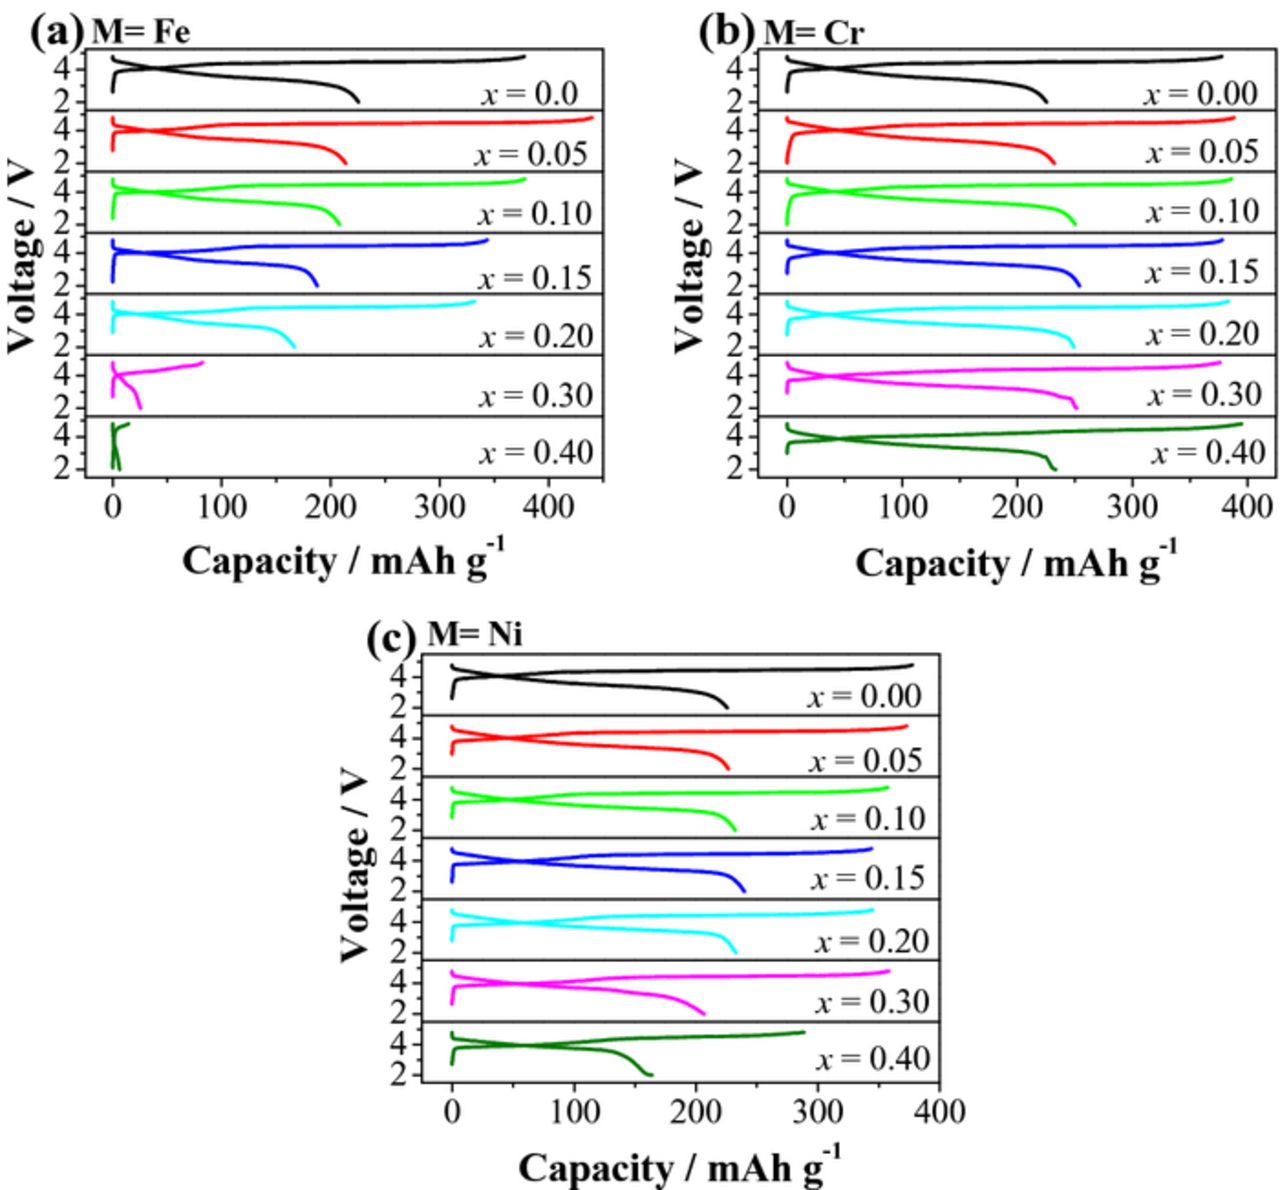
Figure 4. First charge/discharge curves of Li[Li0.2Mn0.4Co0.4-xMx]O2: (a) M = Fe, (b) M = Cr, and (c) M = Ni.
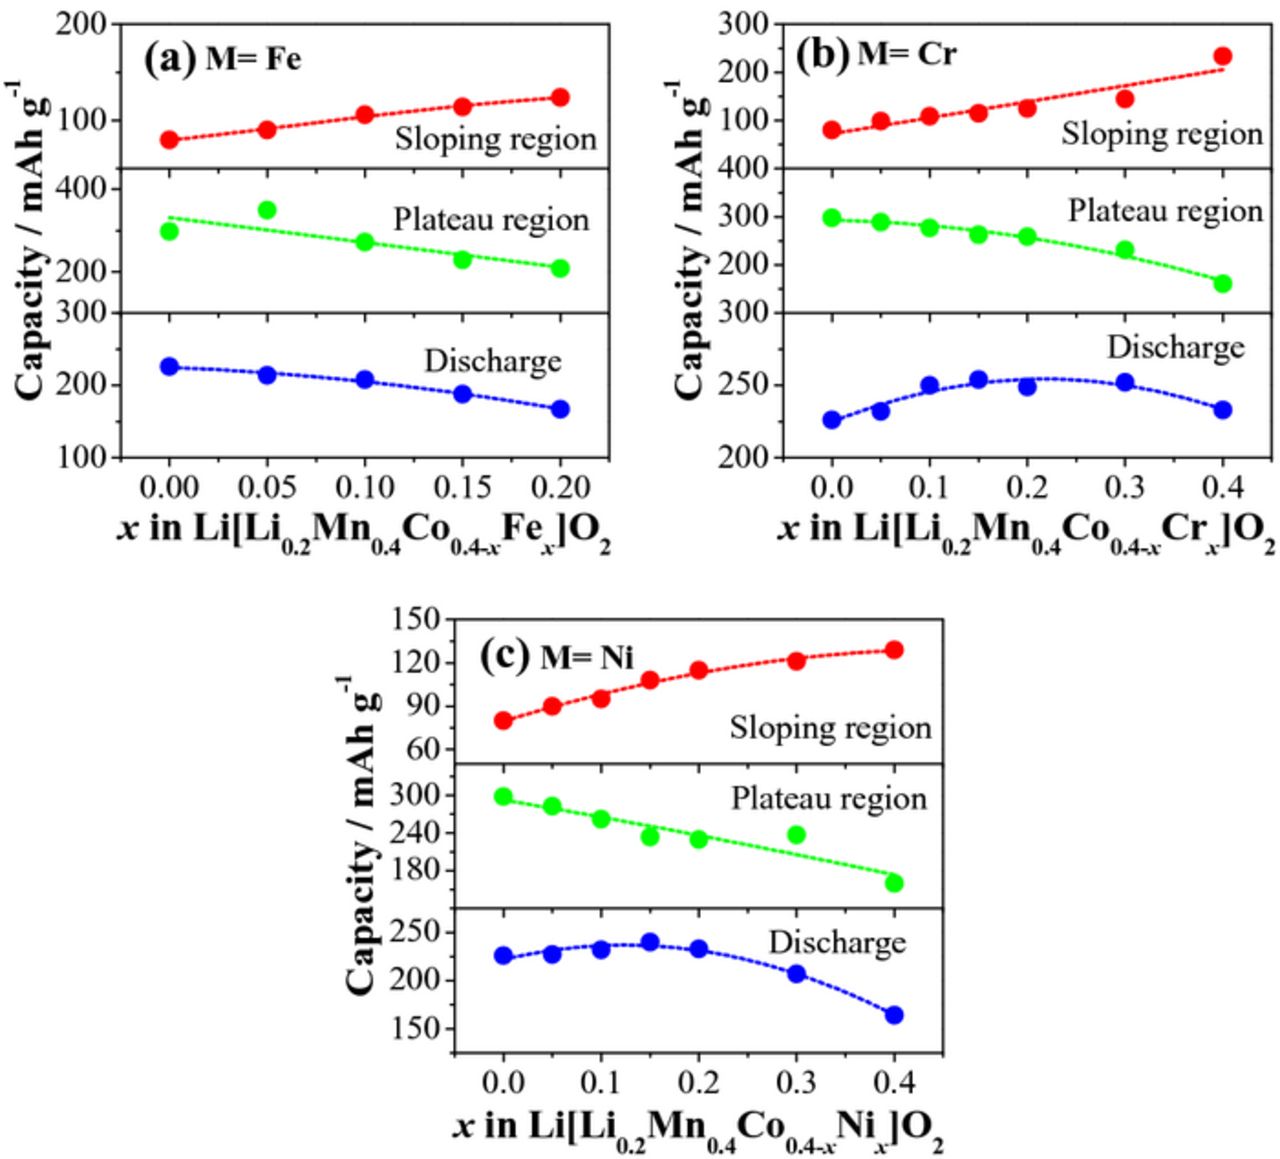
Figure 5. Sloping region, plateau region, and discharge capacities of Li[Li0.2Mn0.4Co0.4-xMx]O2: (a) M = Fe, (b) M = Cr, and (c) M = Ni.
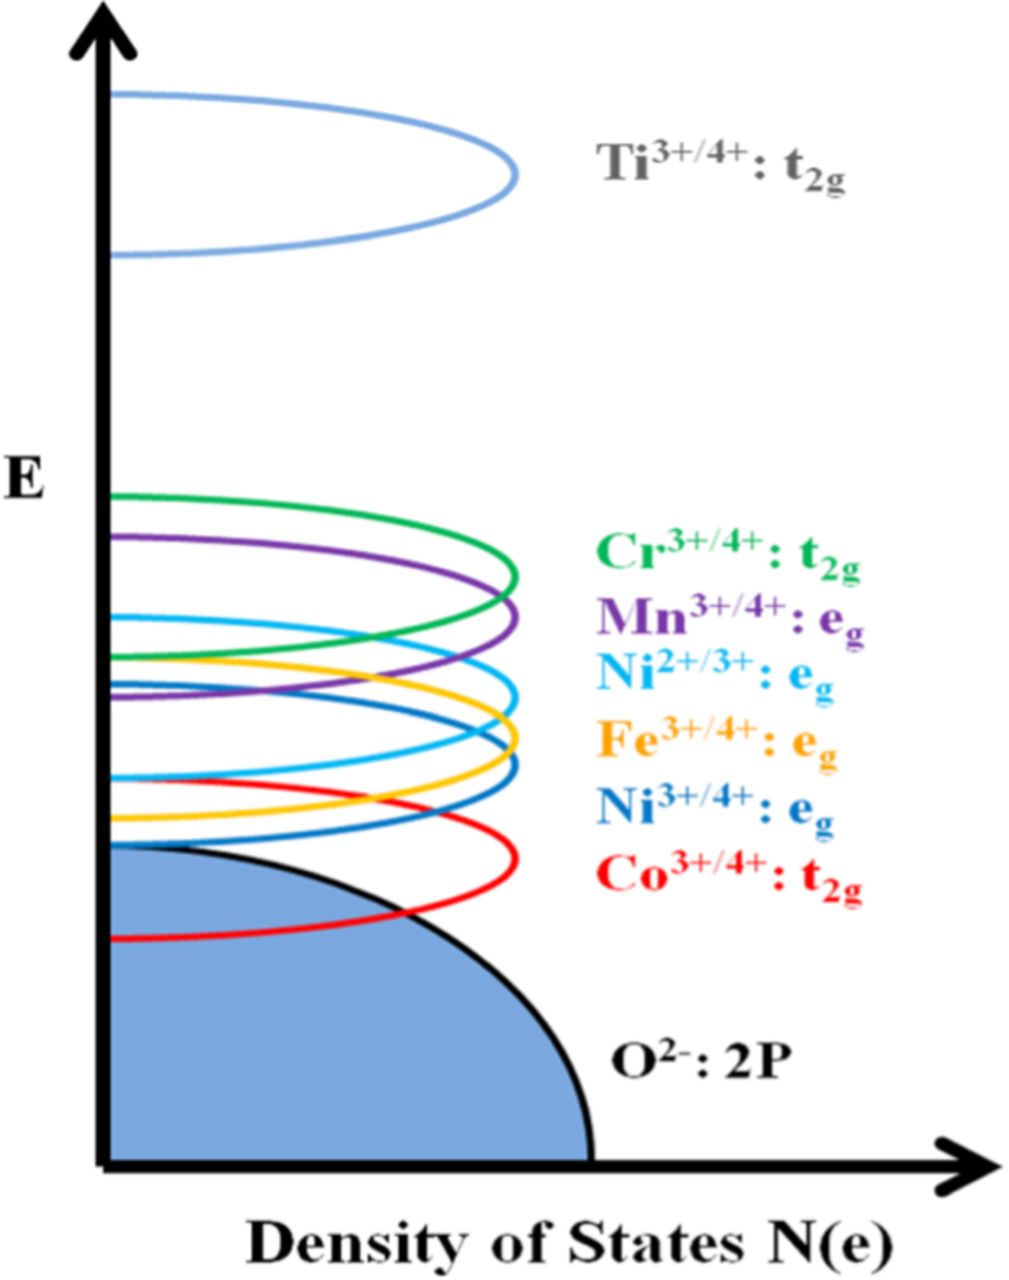
Figure 6. Qualitative energy diagram depicting the positions of metal: 3d bands with respect to the top of the O2−: 2p band, which was drawn based on the experimental voltages and chemical stability of materials in lithium-ion cells.
Figures 4b and 5b show, respectively, the first charge/discharge profiles and capacities of Li[Li0.2Mn0.4Co0.4-xCrx]O2 (0 ≤ x ≤ 0.4). As seen, the Cr substitution increases the capacity in the sloping region but decreases the capacity in the plateau region. The increase in the sloping region is associated with the multi-electron transfer reaction associated with the Cr3+/6+ redox couple,44 while the decrease in the plateau region is attributed to the reduction of available Li ions after extensive Li extraction during the sloping region and the reduced covalency of the Cr-O bond compared to the Co-O bond. As has been previously reported,45,46 the oxidation of Cr3+ to smaller Cr6+ ions results in a migration of Cr from the octahedral sites in TM layers to the tetrahedral sites in Li layers, and the migration is not fully reversible. Therefore, although the plateau region is decreasing, the occurrence of large IRC loss at high Cr contents is a result of the partial irreversible migration of Cr. Consequently, the discharge capacity of Li[Li0.2Mn0.4Co0.4-xCrx]O2 first increases from x = 0 to 0.15 due to the multi-electron oxidation of Cr3+ and then generally decreases due to the increasing irreversible migration of Cr6+ ions to tetrahedral sites. This interesting behavior is due to the counteracting forces of the increasing sloping region with the decreasing oxygen loss and increasing Cr ion migration.
Figures 4c and 5c illustrate the effect of Ni3+ substitution on the first charge/discharge characteristics and capacities of Li[Li0.2Mn0.4Co0.4-xNix]O2 (0 ≤ x ≤ 0.4). The Ni3+ substitution increases the capacity in the sloping region as Ni3+ can be fully oxidized to Ni4+ before the oxygen loss begins since the Ni3+/4+: eg band barely touches the top of the O2−: 2p band, compared to that in the x = 0 sample (Figure 6). More importantly, the capacity in the plateau region decreases rapidly as the Ni content increases due to the weaker covalence of the Ni-O bond compared to the Co-O bond. Consequently, the discharge capacity of Li[Li0.2Mn0.4Co0.4-xNix]O2 increases from x = 0 to x = 0.15 and decreases from x = 0.15 to x = 0.40 due to the opposite trends in the sloping and plateau region capacities and the delicate interplay between them.
To clearly probe the effect of cationic substitutions on the electrochemical behavior in the first cycle of the Li[Li0.2Mn0.4Co0.4-xMx]O2 (M = Cr, Fe, and Ni) series, Figure 7 presents the differential capacity profiles of the charge/discharge curves. As seen, the positive peaks around 4.0 V correspond to the oxidation of the TM ions, while the positive peaks around 4.4 V are ascribed to the oxidation of the O2− ions and the irreversible loss of oxygen. All of the negative peaks are assigned to the reduction of TM ions. The peak around 3.3–3.5 V originates mainly from the reduction of Mn4+ to Mn3+. As seen in Figure 7a, with increasing Fe content, the 4.0 V peak becomes sharper, due to the enhanced oxidation reaction of TM ions before the oxygen loss begins, and shifts to a more positive potential, while the 4.4 V peak remains unchanged. In contrast, the reduction peaks shift to lower potentials. As exhibited in the inset of Figure 7b, Li[Li0.2Mn0.4Cr0.4]O2 shows an additional positive peak located at 3.75 V, which may be related to the multi-electron transfer process of Cr3+/6+ redox reaction. As a large amount of Li+ ions is extracted during the TM oxidation process in the sloping region, Li[Li0.2Mn0.4Cr0.4]O2 exhibits a weaker 4.5 V peak. Apparently, despite the weak oxygen loss peak during first charge, the Mn reduction peak at 3.3 V is still strong because of the fact that some Mn reduction still occurs due to the irreversible migration of some Cr6+ ions into the tetrahedral sites and not participating in the discharge process. When substituting Cr for Co in the Li[Li0.2Mn0.4Co0.4-xCrx]O2 series, the oxidation and reduction peaks of TM ions slightly move to be more positive and negative, respectively, due to the increasing ohmic polarization caused by the more localized Cr ions, while the O2−-ion oxidation peak is relatively constant. Interestingly, with Li[Li0.2Mn0.4Ni0.4]O2 (see the inset of Figure 7c), the strong reduction peak does not appear in the 3.3–3.5 V range, but appears at a higher potential of 3.75 V because the Ni3+ ions are reduced to Ni2+ first before the reduction of Mn4+ ions to Mn3+. As the Ni content increases in the Li[Li0.2Mn0.4Co0.4-xNix]O2 series, the TM oxidation peak sharpens and shifts negatively as the Ni3+/4+: eg band lies above the Co3+/4+: t2g band, while the reduction peak moves positively to a slight extent due to the occurrence of Ni3+ reduction at a higher potential compared to the Mn4+ reduction. However, the peak for the oxygen loss is unchanged.
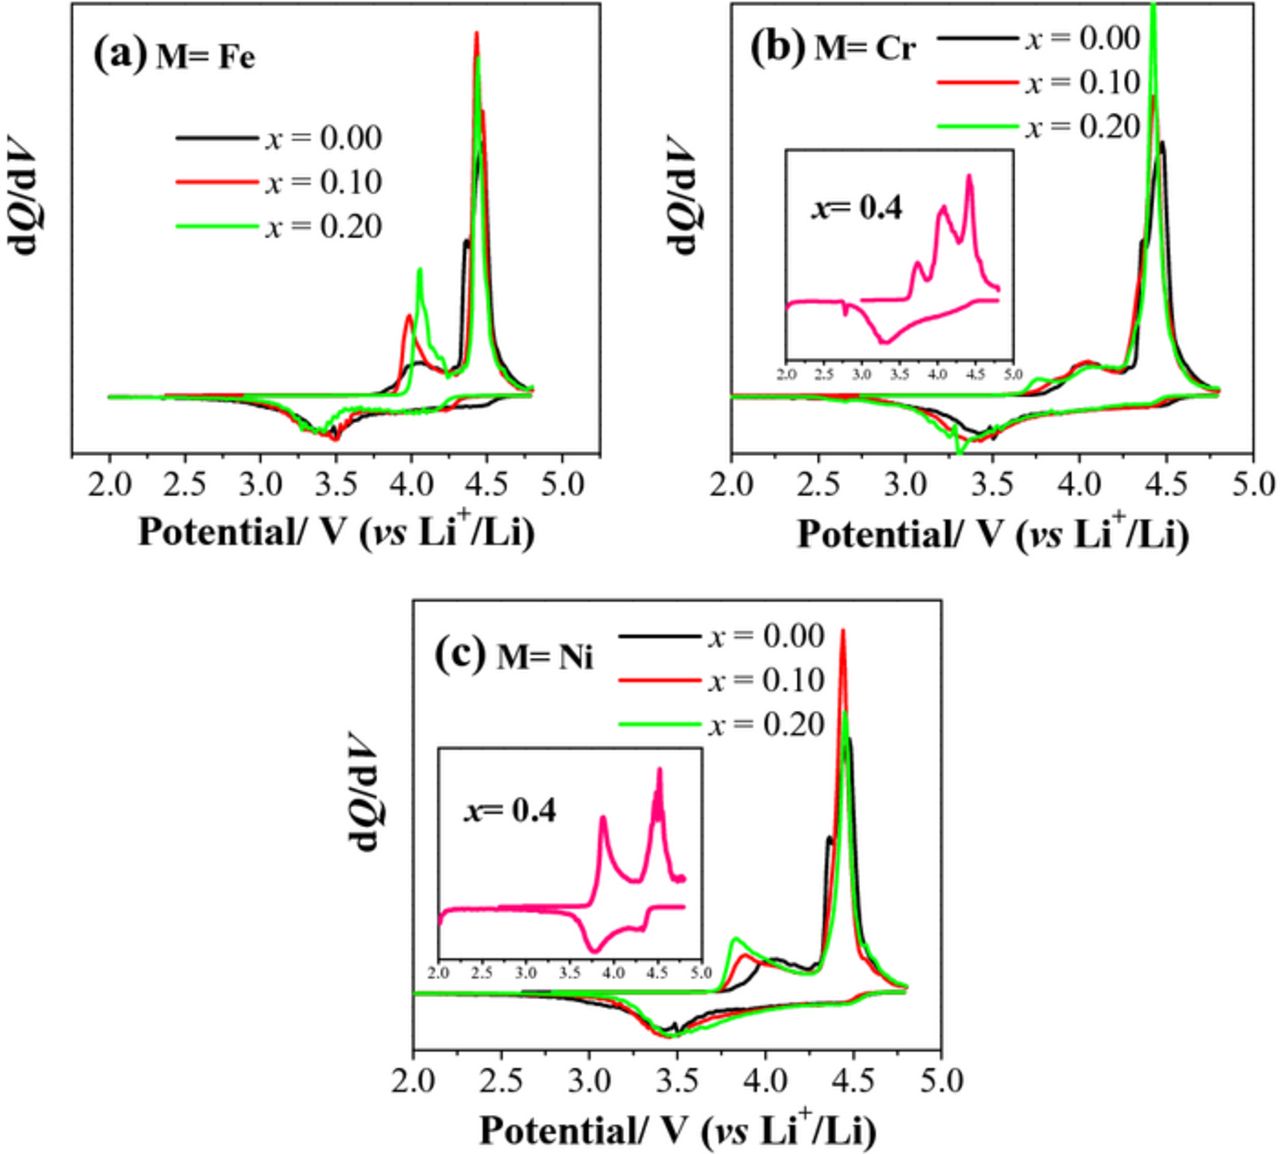
Figure 7. dQ/dV curves of Li[Li0.2Mn0.4Co0.4-xMx]O2: (a) M = Fe, (b) M = Cr (the inset corresponds to Li[Li0.2Mn0.4Cr0.4]O2) and (c) M = Ni (the inset corresponds to Li[Li0.2Mn0.4Ni0.4]O2).
Generally, there are two ways of influencing the TM-ion oxidation potential in solid state materials. The first is a change in the electrochemical polarization. The second is a change in the intrinsic redox potential, which depends on crystal structure, metal-ion coordination, and metal-nonmetal bond covalence.47,48 In order to identify the cause of the peak shifts in Li[Li0.2Mn0.4Co0.4-xMx]O2 (M = Cr, Fe, and Ni), we utilized GITT measurements to estimate the electrochemical polarization and the intrinsic redox potential of the materials during the first charge/discharge cycle. A large spike or drop during the resting period means a large electrochemical polarization, while the lowest potential of the spike depicts the open-circuit potential (OCP) of the redox couples at different stages of Li de-intercalation. Here, the lowest potential of the first spike in the charging slope is taken as the intrinsic potential of the TM redox couples. As depicted in Figure 8, with increasing Cr, Fe, and Ni substitution, the spike length does increase in both the sloping and plateau regions, suggesting a larger electrochemical polarization in the whole charging process due to the increase in electron localization. On the other hand, the OCP potential of the oxygen loss stays very near 4.4 V, regardless of substitutions, which is consistent with the dQ/dV results obtained at low currents. The redox potential of the TM ions in the materials increases from 3.78 to 3.85 V as the Fe content increases from x = 0 to 0.2, decreases from 3.78 to 3.35 V as the Cr content increases from x = 0 to x = 0.4, and decreases from 3.78 to 3.68 V as the Ni content increases from x = 0 to x = 0.4, suggesting that the shift of the dQ/dV peak (∼4.0 V) is mainly attributed to the change in the redox energy position induced by the cationic substitutions.
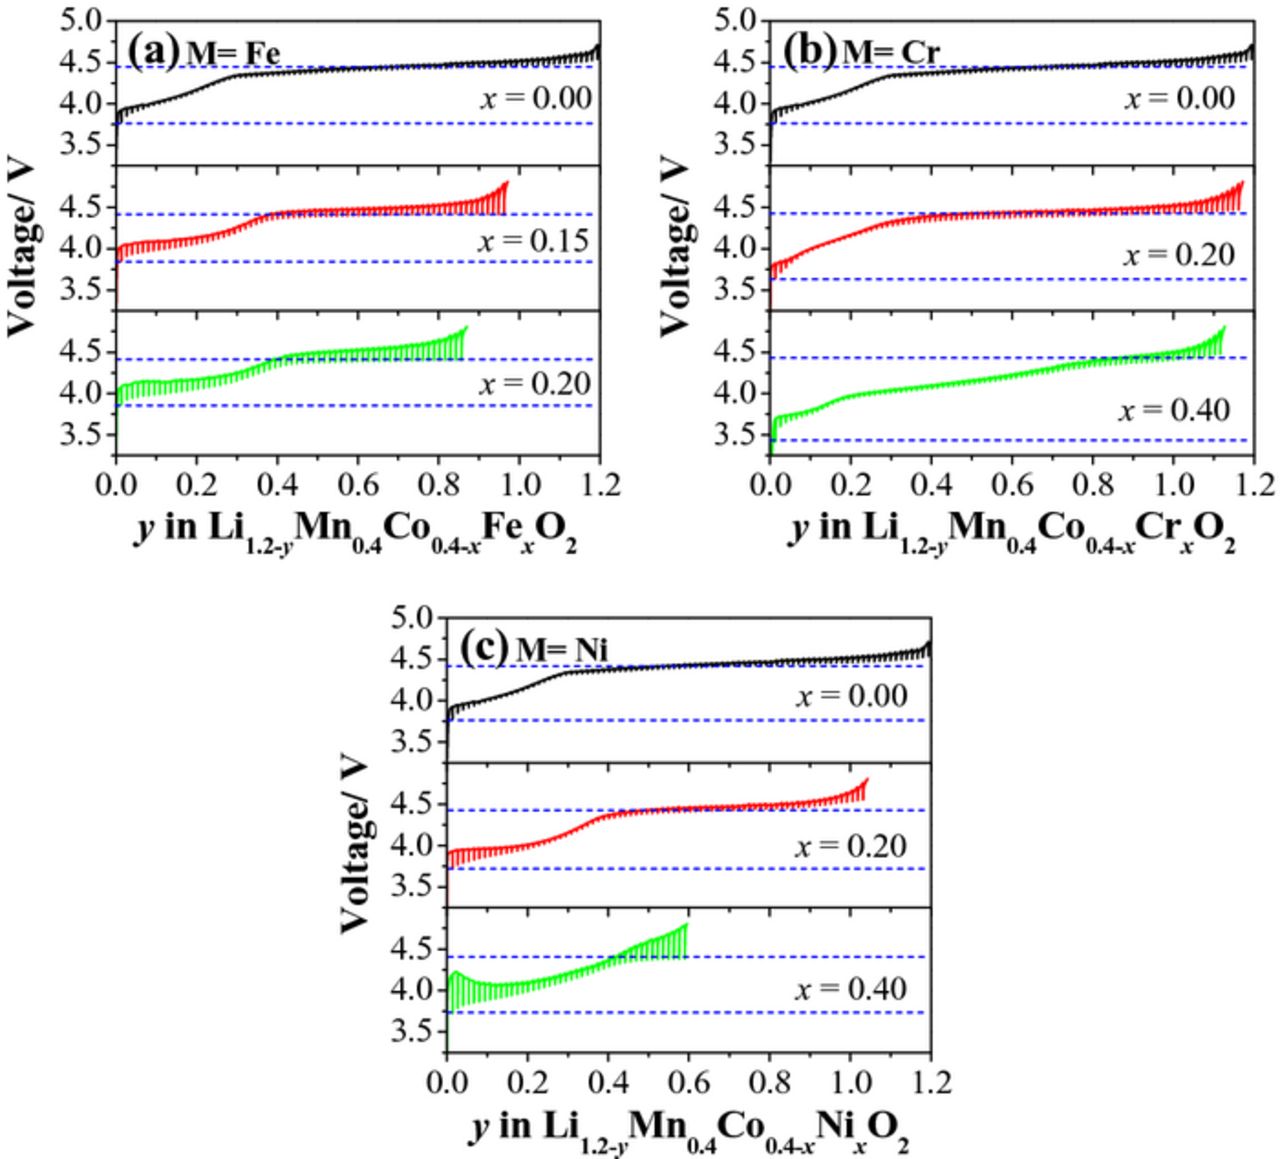
Figure 8. GITT curves of Li[Li0.2Mn0.4Co0.4-xMx]O2: (a) M = Fe, (b) M = Cr, and (c) M = Ni.
Conclusions
The Li[Li0.2Mn0.4Co0.4-xMx]O2 (M = Cr, Fe, and Ni, and 0 ≤ x ≤ 0.4) series of lithium-rich layered oxides have been systematically investigated to understand the effects of various cationic substitutions on Co-containing lithium-rich layered oxides. The Fe substitution affects the charge-discharge profiles drastically and decreases the reversible capacity rapidly for x ≤ 0.2 due to the decrease in the metal-oxygen bond covalence caused by a lying of the Fe3+/4+: t2g band above the top of the O2−: 2p band, while the Co3+/4+: t2g band overlaps with the top of the O2−: 2p band. The Cr substitution is able to greatly increase the charge capacity in the sloping region due to the multi-electron Cr3+/6+ redox couple, but decreases the plateau capacity due to the availability of less Li+ ions after the increased Li extraction in the sloping region. As a result, the reversible capacity of Li[Li0.2Mn0.4Co0.4-xCrx]O2 first increases due to the enhanced sloping-region capacity and then decreases because of the diminished oxygen loss and irreversible migration of the smaller Cr6+ ions from octahedral to tetrahedral sites. With Li[Li0.2Mn0.4Co0.4-xNix]O2, the reversible capacity first increases because Ni3+ can be fully oxidized to Ni4+ but Co3+ can be oxidized only to around Co3.6+ before the oxygen loss begins. However, as the Ni content increases further, the reversible capacity decreases due to reduced plateau-region capacity caused by the decrease in metal-oxygen covalence. Additionally, Ni substitution increases the average discharge potential since Ni3+ ions will be reduced to Ni2+ before the Mn4+ ions are reduced to Mn3+. The findings could benefit the design of lithium-rich layered oxide cathodes with optimal properties.
Acknowledgments
This work was supported by the office of Vehicle Technologies of the U.S. Department of Energy under Contract DE-AC0205CH11231 and the Welch Foundation grant F-1254. One of the authors (X. Xiang) was supported as a visiting scholar by the National Natural Science Foundation in China (Grant No. 21273084).