Abstract
Molecular dynamics (MD) simulations of acetonitrile (AN) mixtures with LiBF4, LiCF3SO3 and LiCF3CO2 provide extensive details about the molecular- and mesoscale-level solution interactions and thus explanations as to why these electrolytes have very different thermal phase behavior and electrochemical/physicochemical properties. The simulation results are in full accord with a previous experimental study of these (AN)n-LiX electrolytes. This computational study reveals how the structure of the anions strongly influences the ionic association tendency of the ions, the manner in which the aggregate solvates assemble in solution and the length of time in which the anions remain coordinated to the Li+ cations in the solvates which result in dramatic variations in the transport properties of the electrolytes.
Export citation and abstract BibTeX RIS

This is an open access article distributed under the terms of the Creative Commons Attribution 4.0 License (CC BY, http://creativecommons.org/licenses/by/4.0/), which permits unrestricted reuse of the work in any medium, provided the original work is properly cited.
Understanding the origin of the widely varying transport properties (e.g., viscosity, ionic conductivity and diffusion coefficients) of battery electrolytes remains a key challenge. The present work continues a detailed study into the solution structure of electrolytes—ion solvation and ionic association interactions—to provide mechanistic explanations for electrolyte properties. Previous manuscripts have examined in detail acetonitrile electrolytes with numerous lithium salts: (AN)n-LiX.1–6 Electrolytes with the most strongly associated anions studied (i.e., CF3SO3− and CF3CO2−), in which anion...Li+ cation coordination (i.e., ionic association interactions) is a prominent feature of solvate formation, were found to have a much lower ionic conductivity than electrolytes with more weakly coordinating anions (e.g., PF6− and ClO4−).3 This is as one might expect once the ionic association tendency of the salts is well understood, but the details of why the conductivity values are low are missing.
Two particularly notable points from the previous studies are that:
- (1)The average solvation numbers, obtained from a Raman spectroscopic analysis, for the (AN)n-LiCF3CO2 solutions were found to be almost constant near a value of 1 (i.e., one AN molecule per Li+ cation) over a wide concentration range, even for very dilute solutions. It remains unclear, however, as to why such electrolytes have such a low degree of solvation and why highly concentrated (>5 M) liquid electrolytes—perhaps contrary to expectations—can be prepared with LiCF3CO2 with this being the case.
- (2)Experimental measurements of the solution structure and transport properties of (AN)n-LiCF3SO3 mixtures were unobtainable due to the rapid crystallization of a solid solvate phase (i.e., (AN)1:LiCF3SO3) from the electrolytes.1 Liquid electrolytes with this salt can, however, be readily studied using molecular dynamics (MD) simulations to better understand how and why solution interactions differ for differing anions.
The present work therefore delves deeper into the molecular- and mesoscale-level interactions using MD simulations applied to the characterization of (AN)n-LiCF3SO3 and -LiCF3CO2 electrolytes, as well as those for (AN)n-LiBF4 for which a newly revised BF4− force field was utilized to improve the agreement between the computational and experimental results relative to the previously reported simulation results1 for such electrolytes. A detailed understanding of such interactions will greatly aid in the development and utilization of diverse lithium salts for electrolyte formulations.7
Computational Methods
Force field development
In order to investigate the highly associated electrolytes, the previously developed Atomistic Polarizable Potential for Liquids, Electrolytes, and Polymers (APPLE&P) many-body force fields (FFs) have been extended to (AN)n-LiCF3SO3 and (AN)n-LiCF3CO2 electrolytes and revised for the (AN)n-LiBF4 electrolytes. A detailed description of the FF functional form is given elsewhere,8 but the main features are listed below. APPLE&P utilizes a Buckingham potential, also called exp-6, in conjunction with permanent charges situated on the atomic sites for the electrolyte components simulated in this work. The polarization interactions are represented by the induced isotropic atomic dipoles. Thole screening with the parameter aT = 0.2 was used to screen the interactions between the induced dipoles in the short range. Atoms connected by bonds (1-2) and bends (1-2-3) were excluded from the list of non-bonded interactions. Atoms connected by 3 or more bonds (1-4 interactions) had full non-bonded interactions with the exception of the 1-4 interaction between the permanent charges and the induced dipoles which were scaled by 0.8.
Permanent charges for the anions (BF4−, CF3SO3− and CF3CO2−) were determined by fitting the electrostatic potential around the anions calculated at the MP2/Tz level, where Tz denotes the aug-cc-pvTz basis set.8 The bond length and natural bending angles were fit to geometries obtained at the MP2/aug-cc-pvTz level. The dihedral parameters for the CF3-group rotation were fit to MP2/Tz energies. For the CF3CO2− anion, a set of atomic polarizabilities was transferred from the CH3OCO2− anion FF.9 For the CF3SO3− anion, the atomic polarizabilities for O, C and F were taken from the revised N(SO2CF3)2− (i.e., TFSI−) FF,10 while the S polarizability was adjusted to match the average anion molecular polarizability of 7.35 Å3 obtained from the M05-2X/aug-cc-pvTz calculations. The atomic polarizabilities of BF4− were taken from the previous version of the FF without modification.8 The exp-6 repulsion-dispersion parameters obtained from the TFSI− and CH3OCO2− FFs2,9 were transferred to CF3SO3− and CF3CO2−, respectively. After this, additional small adjustments were made to the Li...F and Li...S repulsive parameters in order to improve the description of the Li+BF4− and Li+CF3SO3− binding energies obtained from the high-level quantum chemistry (QC) calculations described below.
In order to evaluate the ability of the developed FFs to predict the binding energies of (Li+CF3SO3−)m and (Li+CF3CO2−)m complexes (m = 1, 2, 3), a set of QC calculations was performed using the Gaussian g09 package11 for the geometries shown in SI Figs. S1 and S2. The most accurate G4MP2 calculations were performed only for the smallest salt complexes with m = 1 and 2 because the G4MP2 calculations become prohibitively expensive (computationally) for the larger clusters with m = 3. DFT methods are the most suitable for the calculations of binding energies for the larger m = 3 clusters, provided that an adequate functional is used. A number of DFT functionals have therefore been evaluated with regard to their ability to describe the binding energies of the (Li+anion−)m clusters with the results reported in Tables I and II and Figs. S1 and S2. These latter binding energies were not corrected for the basis set superposition error (BSSE), however, as many DFT functionals are parameterized without BSSE corrections. Instead, the BSSE corrections are given in parentheses as an estimation of the accuracy of the DFT calculations (Tables I and II).
Table I. Binding energies (in kcal mol−1) of (Li+CF3SO3−)m clusters from QC and molecular mechanics (MM) using the developed force field (FF) with BSSE corrections shown in parentheses.
| G4MP2 | MP2/Tza | M05-2X/6-31+G** | B3LYP/6-31+G** | M06-L/6311+G(d,p) | FF (e49) | |
|---|---|---|---|---|---|---|
| (Li+CF3SO3−)1 | −138.6 | −140.2 (0.6) | −142.0 (1.0) | −141.4 | −139.7 (1.2) | −137.1 |
| (Li+CF3SO3−)2 | −318.7 | −326.9 (3.0) | −326.1 | −321.8 (4.2) | −320.5 | |
| (Li+CF3SO3−)3 (I) | −504.5 | −503.3 (8.4) | −496.3 | |||
| (Li+CF3SO3−)3 (II) | −510.3 (8.8) | −507.1 |
Table II. Binding energies (in kcal mol−1) of (Li+CF3CO2−)m clusters from QC and molecular mechanics (MM) using the developed force field (FF) with BSSE corrections shown in parentheses.
| G4MP2 | MP2/Tza | M05-2X/aug-cc-pvTz | M05-2X/6-31+G** | B3LYP/6-31+G** | M06-L/6-311+G(d,p) | FF | |
|---|---|---|---|---|---|---|---|
| (Li+CF3CO2−)1 (I) | −150.5 | −151.5 | −155.4 | −152.8 | −151.8 (0.5) | −150.3 (0.3) | −150.9 |
| (Li+CF3CO2−)1 (II) | −142.6 | −143.5 | −147.3 | −144.8 | −144.8 (0.5) | −143.7 (0.5) | −133.0 |
| (Li+CF3CO2−)2 | −346.1 | −352.6 (1.6) | −346.0 (1.2) | −346.1 | |||
| (Li+CF3CO2−)3 (I) | −408.7 (2.7) | −405.0 | −407.3 | ||||
| (Li+CF3CO2−)3 (II) | −542.8 | −535.1 (2.6) | −528.0 | ||||
| (Li+CF3CO2−)3 (III) | −533.7 | −533.6 (3.4) | −532.1 |
The M06-L functional predicts binding energies that have the best agreement with the G4MP2 benchmark calculations with an accuracy comparable to or even better than the significantly more computationally expensive MP2/Tz calculations. Specifically, the M06-L results yielded binding energies slightly larger than those from the G4MP2 calculations if uncorrected for BSSE, while after BSSE correction the M06-L results tend to be slightly lower than the G4MP2 values. The M05-2X and B3LYP functionals, on the other hand, predict significantly higher binding energies than those from the G4MP2, MP2/Tz and M06-L calculations. Such high values are consistent with earlier calculations for solvent-Li+ and anion-Li+ complexes.1–5 The M06-L/6-311+G** level was therefore chosen as the most reliable for the investigation of the larger ion clusters.
An examination of Tables I and II reveals that the binding energies of the (Li+CF3CO2−)m complexes obtained from both the QC and FF calculations are systematically higher than the binding energies in the corresponding (Li+CF3SO3−)m complexes. Moreover, the FFs predict that the coordination in the (Li+CF3CO2−)m and (Li+CF3SO3−)m complexes (m = 1, 2, 3) is due to Li+ cation coordination by the anion oxygens, with the exception of the (Li+CF3CO2−)1 (II) and (Li+CF3CO2−)3 (II) complexes (Fig. S2) for which a Li+ cation is coordinated to a fluorine atom from the CF3 group. For the later complexes, the binding energies from the MM calculations using the FF are significantly lower than the binding energies from the DFT and QC calculations (Table II). Attempts to improve the agreement for (Li+CF3CO2−)1 by reducing the F-Li repulsion shifted the Li+ cation too close to the fluorine atom (relative to the QC results). The binding energy of the (Li+CF3CO2−)1 (II) complex, however, is more than 8 kcal mol−1 higher than the binding energy of the (Li+CF3CO2−)1 (I) complex where the Li+ cation has bidentate coordination with the CF3CO2− oxygen atoms. It is therefore reasonable to assume that the population of such higher energy complexes will be quite low and are thus not critical to the realistic representation of the solvates within the MD simulations. An examination of the binding energies indicates that the (Li+CF3SO3−)3 (II) complex (Fig. S1) is approximately 10 kcal mol−1 more stable than than the corresponding (I) complex from both the DFT and FF calculations (Table I). The FF calculations indicate that the stabilization of complex (II) vs. (I) is largely due to a significantly larger polarization (5 kcal mol−1) from the two Li+ cations grouped together in complex (II). In addition, complex (II) also has less bend distortion than is found for complex (I).
Molecular dynamics (MD) simulations
MD simulations were performed on the solvent AN doped with LiCF3SO3 or LiCF3CO2 (AN:Li = 30, 20, 10, 5, 2) and LiBF4 (AN:Li = 30, 20, 10, 5). The compositions of the simulation cells are given in Tables III–V. A previously used MD simulation methodology for the (AN)n-LiX mixtures has been followed.1 Equilibration and production runs were performed using NPT and NVT ensembles, respectively. The NPT and NVT run times are summarized in Tables III–V. The distribution of residence times for the solvent and anions present in the Li+ cation first coordination shells were calculated using:
where H(t) is 1 if a particular AN molecule or anion is involved in coordinating a given Li+ cation...and zero otherwise. The brackets indicate averaging over all of the Li+ cations and multiple time origins, as well as normalization such that PLi-X(0) = 1. The residence time for each species in the Li+ cation coordination shells was calculated as the time integral of stretched exponential exp(−(t/τ)β) fits to the PLi-X(t) distribution functions.
Table III. MD simulation data for the (AN)n-LiBF4 mixtures at 60°C.
| Property (AN:Li ratio): | 30 | 20 | 10 | 5 |
|---|---|---|---|---|
| No. solvent in MD box | 480 | 640 | 640 | 640 |
| No. LiBF4 in MD box | 16 | 32 | 64 | 128 |
| Concentration (M) from MD | 0.58 | 0.88 | 1.72 | 3.24 |
| Molality (mol kg−1) from MD | 0.75 | 1.09 | 1.98 | 3.34 |
| Simulation run lengtha (ns) | 28 (10) | 13 (3) | 29 (8) | 46 (8) |
| Simulation box length (Å) | 35.68 | 39.28 | 39.55 | 40.33 |
| Density (MD) (g cm−3) | 0.775 | 0.802 | 0.866 | 0.969 |
| Density (Expt) (g cm−3) | 0.781 | 0.804 | 0.860 | 0.958 |
| Conductivity (MD) (mS cm−1) | 33.0 | 34.4 | 46.9 | 34.3 |
| Conductivity (Expt) (mS cm−1) | 19.7 | 23.4 | 24.8 | 20.2 |
| Viscosity (MD) (mPa s) | 0.32 | 0.33 | 0.52 | 1.15 |
| Viscosity (Expt) (mPa s) | 0.35 | 0.41 | 0.64 | 1.82 |
| Fraction of free Li+ (rLi–B > 3.60 Å) | 0.35 | 0.29 | 0.20 | 0.11 |
| Fraction of free BF4− (rLi–B > 3.60 Å) | 0.32 | 0.25 | 0.15 | 0.07 |
| Fraction of free AN (rLi–N > 2.40 Å) | 0.90 | 0.86 | 0.74 | 0.56 |
| Li+ coordination numbers | ||||
| # N (within 2.40 Å of Li+) | 2.97 | 2.86 | 2.59 | 2.22 |
| # F (within 2.40 Å of Li+) | 0.88 | 1.01 | 1.30 | 1.70 |
| # B (within 3.60 Å of Li+) | 0.83 | 0.96 | 1.26 | 1.65 |
| Probability of finding the following number of Li+ cations within 3.60 Å of B of BF4− | ||||
| 0 Li+ within 3.60 Å of B (SSIP) | 0.32 | 0.25 | 0.15 | 0.07 |
| 1 Li+ within 3.60 Å of B (CIP) | 0.54 | 0.56 | 0.50 | 0.37 |
| 2 Li+ within 3.60 Å of B (AGG-I) | 0.13 | 0.18 | 0.30 | 0.42 |
| 3 Li+ within 3.60 Å of B (AGG-II) | 0.01 | 0.02 | 0.05 | 0.13 |
| Li-N(AN) residence time (ps) | 57.5 | 65.5 | 80.7 | 112 |
| Li-B(BF4−) residence time (ps) | 341 | 311 | 337 | 394 |
Table V. MD simulation data for the (AN)n-LiCF3CO2 mixtures at 60°C.
| Property (AN:Li ratio): | 30 | 20 | 10 | 5 | 2 |
|---|---|---|---|---|---|
| No. solvent in MD box | 960 | 640 | 640 | 640 | 512 |
| No. LiCF3CO2 in MD box | 32 | 32 | 64 | 128 | 256 |
| Concentration (M) from MD | 0.57 | 0.84 | 1.60 | 2.91 | 5.65 |
| Molality (mol kg−1) from MD | 0.74 | 1.06 | 1.89 | 3.08 | 4.95 |
| Simulation run lengtha (ns) | 17 (17) | 7 (19) | 20 (19) | 16 (14) | 31 (9) |
| Simulation box length (Å) | 45.41 | 39.90 | 40.53 | 41.80 | 42.23 |
| Density (MD) (g cm−3) | 0.767 | 0.787 | 0.847 | 0.946 | 1.141 |
| Density (Expt) (g cm−3) | 0.773 | 0.797 | 0.852 | 0.944 | – |
| Conductivity (MD) (mS cm−1) | 11.1 | 10.3 | 11.0 | 12.9 | 5.5 |
| Conductivity (Expt) (mS cm−1) | 3.3 | 3.9 | 5.2 | 4.0 | – |
| Viscosity (MD) (mPa s) | 0.27 | 0.30 | 0.39 | 0.74 | 3.00 |
| Viscosity (Expt) (mPa s) | 0.30 | 0.33 | 0.50 | 1.16 | – |
| Fraction of free Li+ (rLi–C > 3.52 Å) | 0.14 | 0.12 | 0.10 | 0.10 | 0.05 |
| Fraction of free CF3CO2− (rLi–C > 3.52 Å) | 0.00 | 0.00 | 0.00 | 0.00 | 0.00 |
| Fraction of free AN (rLi–N > 2.40 Å) | 0.95 | 0.93 | 0.87 | 0.75 | 0.44 |
| Li+ coordination numbers | |||||
| # N (within 2.40 Å of Li+) | 1.42 | 1.40 | 1.35 | 1.28 | 1.12 |
| # O (within 2.40 Å of Li+) | 2.50 | 2.50 | 2.58 | 2.69 | 2.91 |
| # C (within 3.52 Å of Li+) | 2.45 | 2.50 | 2.53 | 2.63 | 2.85 |
| Probability of finding the following number of Li+ cations within 3.52 Å of carboxyl C of CF3CO2− | |||||
| 0 Li+ within 3.52 Å of C (SSIP) | 0.00 | 0.00 | 0.00 | 0.00 | 0.00 |
| 1 Li+ within 3.52 Å of C (CIP) | 0.03 | 0.00 | 0.00 | 0.00 | 0.00 |
| 2 Li+ within 3.52 Å of C (AGG-I) | 0.54 | 0.60 | 0.54 | 0.43 | 0.29 |
| 3 Li+ within 3.52 Å of C (AGG-II) | 0.38 | 0.35 | 0.40 | 0.48 | 0.58 |
| 4 Li+ within 3.52 Å of C (AGG-III) | 0.05 | 0.04 | 0.05 | 0.08 | 0.13 |
| Li-AN residence time (ps) | 53.0 | 55.3 | 60.0 | 75.5 | 138.2 |
| Li-C(CF3CO2−) residence time (ps) | 13625 | 10234 | 7843 | 4883 | 3324 |
aNPT equilibration run times are shown in parentheses; C refers to the carboxyl carbon.
Results and Discussion
Ionic association interactions
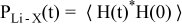
MD simulations were previously reported for (AN)n-LiBF4 mixtures,1 but these have been revised here as it was found that a newly refined FF for the BF4− anion provided results which are in better agreement with the experimental analyses previously reported.1 Fig. 1a shows a snapshot of the simulation box for the n = 10 composition (i.e., the simulation box captured at a particular time during the equilibrium run period). To more fully access the information contained within this simulation (i.e., to scrutinize the computed solution structure), visualization of the solvates and their distribution is necessary. To this end, the snapshots (at select time intervals during the equilibrium portion of the simulations) were modified by coloring the AN molecules light gray if they were > 2.70 Å from the Li+ cations (i.e., uncoordinated and not in close proximity) and the solvent molecules and ions were unwrapped/periodic boundary conditions were applied so as not to divide the anions and solvates across the periodic box boundaries (Fig. 1b). The individual uncoordinated anions and solvates were then extracted from the dissected simulation box snapshot and assembled into a visual list (Fig. 2). A number of notable features are evident:
- (a)this particular simulation snapshot contains 13 uncoordinated BF4− anions (out of 64), but only 11 fully solvated Li+ cations;
- (b)aggregate solvates with either excess Li+ cations or excess anions are present, but there are more of the former as is evident by the larger number of uncoordinated anions than fully solvated Li+ cations;
- (c)in addition to contact ion pair solvates (12 of these), several of the aggregate solvates also contain equal numbers of anions and Li+ cations (and thus are electrically neutral for the lifetime of these solvates);
- (d)the BF4− anions coordinated to three Li+ cations serve as central linkage sites for the larger aggregates;
- (e)nearly all of the Li+ cations have 4-fold coordination to anions and/or solvent molecules;5
- (f)very few of the BF4− anions have bidentate coordination (i.e., two fluorine atoms from the same anion coordinated to a single Li+ cation) and none of them have tridentate coordination (i.e., three fluorine atoms from the same anion coordinated to a single Li+ cation); and
- (g)many of the aggregate solvates contain anions coordinated to a single Li+ cation with the cations, however, coordinated to multiple anions—thus these former anions would result in a spectral signature (Raman and/or FTIR spectroscopy) identical to that for contact ion pair solvates when conducting an anion spectroscopic vibrational band analysis to determine the solution ionic association interactions even though the anions are actually part of larger aggregate solvates.
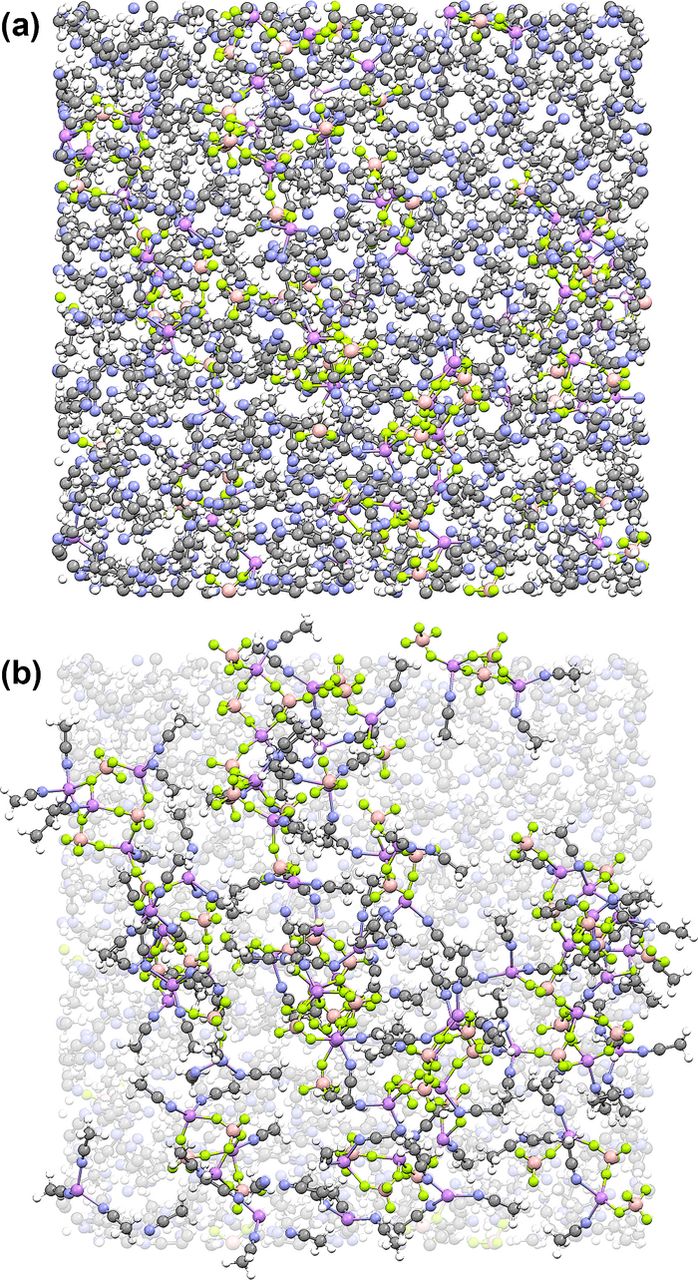
Figure 1. MD simulation box snapshot (viewed along one axis) for the (AN)n-LiBF4 (n = 10) electrolyte at 60°C: (a) unmodified and (b) the same box after coloring (light gray) the uncoordinated (to a Li+ cation) AN solvent molecules and growing the anions/solvates across the periodic boundaries (Li-purple, N-blue, B-tan, F-light green).
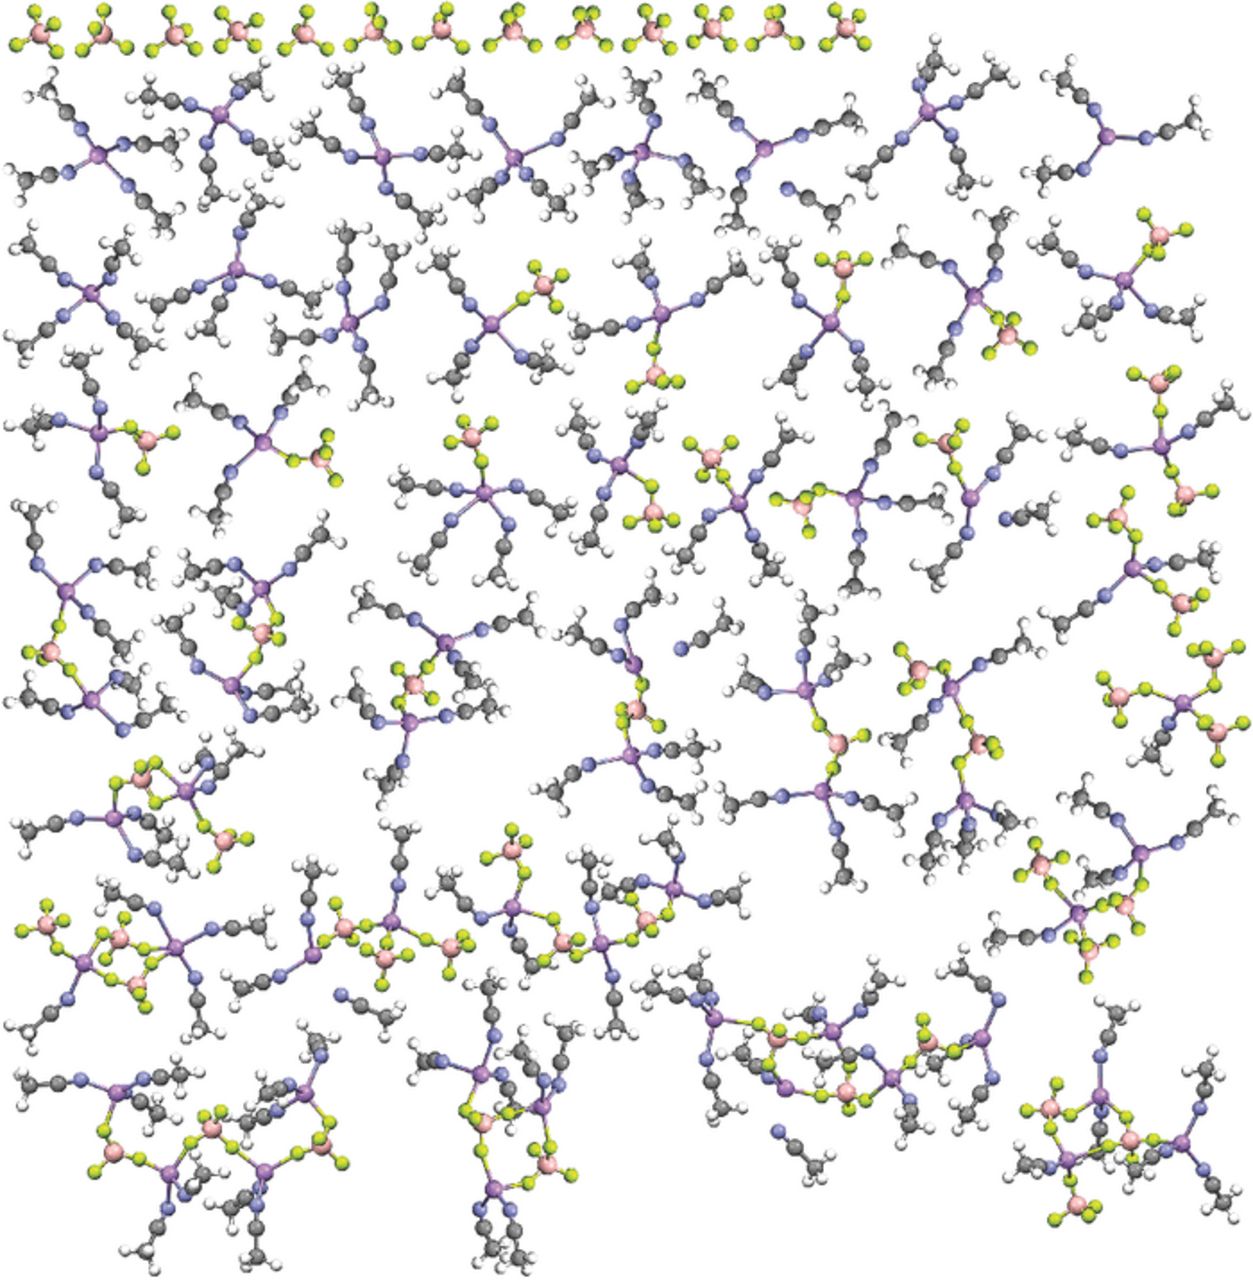
Figure 2. Visual list of the uncoordinated anions and solvates extracted from one of the dissected MD simulation snapshots at 60°C for the (AN)n-LiBF4 (n = 10) electrolyte (Li-purple, N-blue, B-tan, F-light green).
Fig. 2 can be compared with the data obtained from the (AN)n-LiX (n = 10; X = ClO4−, TFSI− and PF6−) electrolyte simulations previously reported.1–3 Figs. 3 and 4 consist of similar plots for the (AN)n-LiX (n = 10) electrolytes with the LiCF3SO3 and LiCF3CO2 salts, respectively (plots for the n = 30 simulations are provided in the Supporting Information). The electrolytes with LiCF3SO3 (Fig. 3) are considerably more associated than the comparable electrolytes with LiBF4 (less uncoordinated anions, less fully solvated Li+ cations, more aggregates) which, in turn, are more associated than the electrolytes with LiClO4, LiTFSI and LiPF6. This difference is even more evident for the electrolytes with LiCF3CO2 (Fig. 4), which is in accord with the largest binding energy observed for the (Li+CF3CO2−)m complexes in the QC calculations. Notably, the latter simulations contain no uncoordinated CF3CO2− anions and very few CF3CO2− anions coordinated to a single Li+ cation as contact ion pairs, even for the n = 30 composition. The snapshot of the n = 10 mixture (Fig. 4), however, does contain 8 fully solvated Li+ cations (out of 64). These cations become available for full solvation due to the coordination of the remaining cations within aggregate solvates which contain a greater number of CF3CO2− anions.
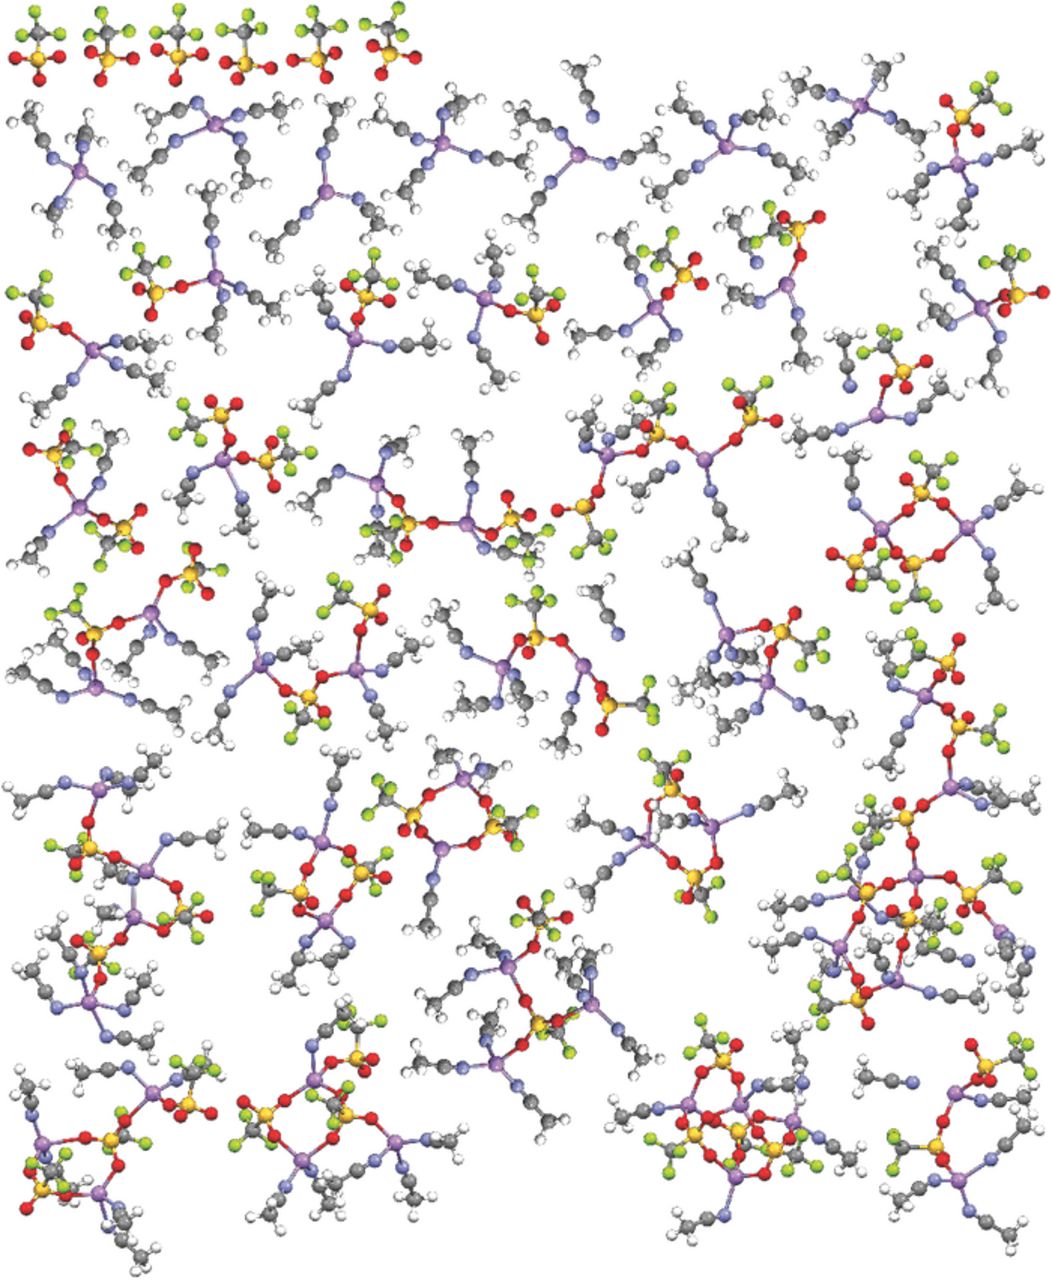
Figure 3. Visual list of the uncoordinated anions and solvates extracted from one of the dissected MD simulation snapshots at 60°C for the (AN)n-LiCF3SO3 (n = 10) electrolyte (Li-purple, N-blue, O-red, S-yellow, F-light green).
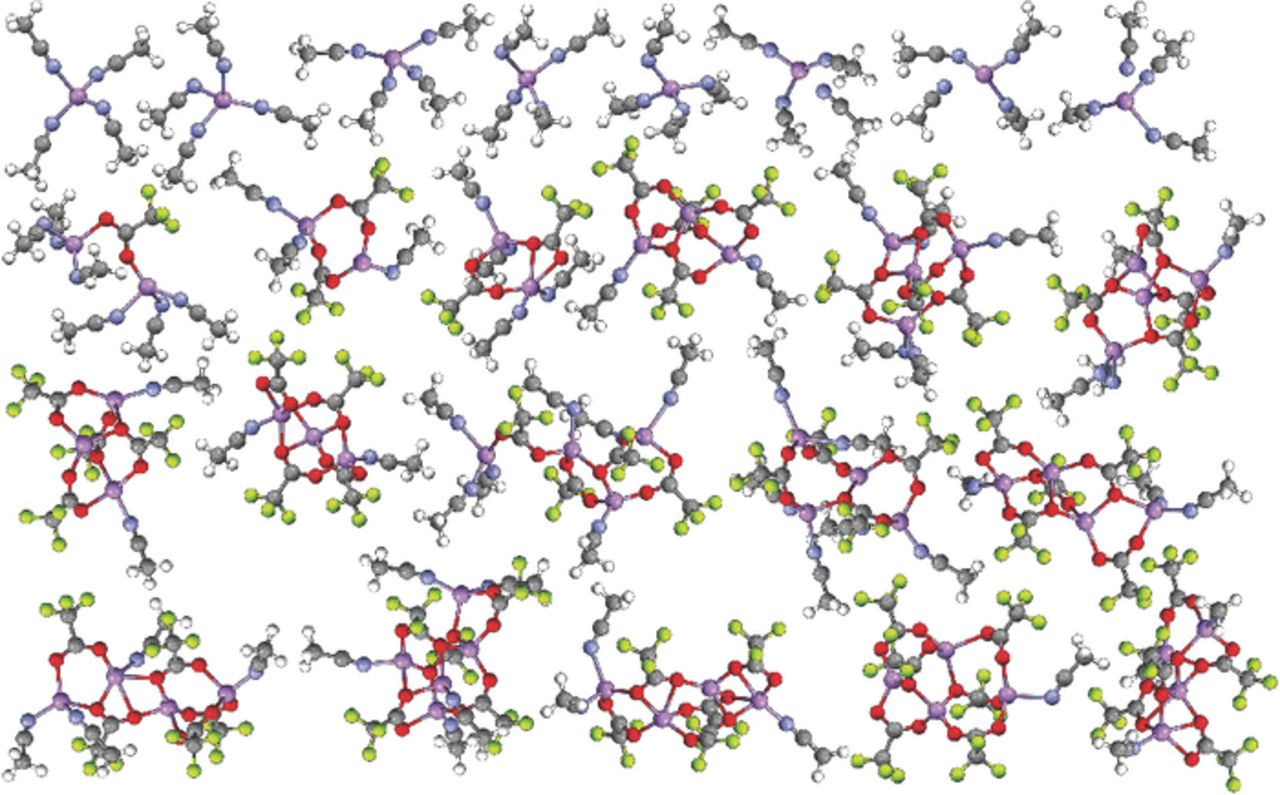
Figure 4. Visual list of the uncoordinated anions and solvates extracted from one of the dissected MD simulation snapshots at 60°C for the (AN)n-LiCF3CO2 (n = 10) electrolyte (Li-purple, N-blue, O-red, F-light green).
Given that the (AN)n-LiX electrolyte mixtures with LiCF3SO3 and LiCF3CO2 are more highly associated than comparable mixtures with salts such as LiClO4 or LiPF6, it is instructive to examine the differences between these electrolytes. The modes of CF3SO3−...Li+ cation coordination in the liquid solvates (MD simulations) closely resemble the interactions noted for the BF4−...Li+ cation coordination (Figs. 2 and 3) (as well as for ClO4− and PF6− anions).1–3 It is the extent of this coordination which differs for the different anions resulting in differences in the ionic association and thus overall solution structure. Specifically, all of these anions tend to be coordinated to zero-three Li+ cations with each coordinated anion oxygen (or fluorine) atom forming a single coordinate bond to a single Li+ cation using a single electron lone-pair. This Li+ cation coordination from the MD simulations is in excellent agreement with the coordination found in solvate crystalline structures with LiCF3SO3, LiBF4, LiClO4 and LiPF6.12–36 None of these crystalline solvate structures, even for highly aggregated solvates, have single donor atoms from the anions coordinated to two Li+ cations. Note that the crystal structures for the neat LiCF3SO3 and LiClO4 salts do, however, have single anion oxygen atoms coordinated to two Li+ cations.37–39
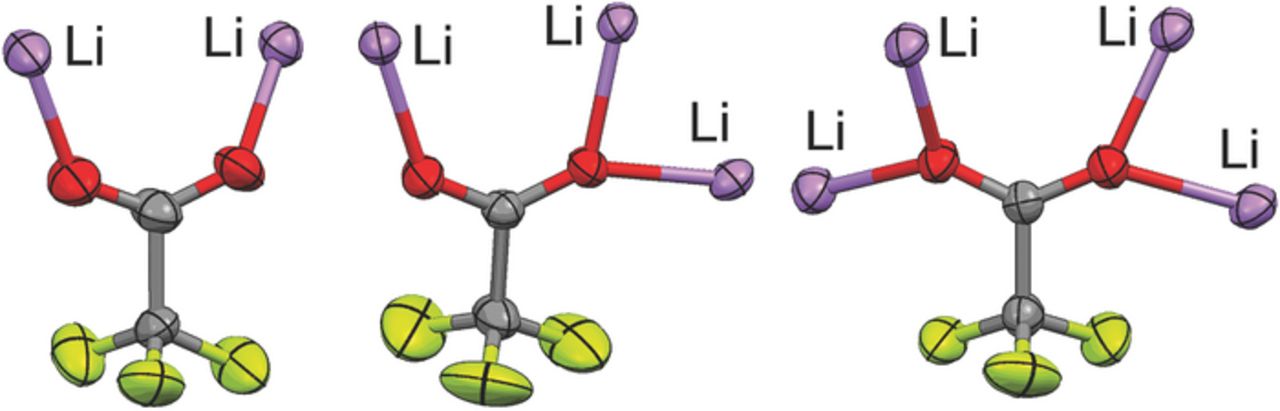
This single anion donor atom...Li+ cation coordination is not what is found, however, in the MD simulations of the electrolytes with LiCF3CO2. The simulations instead indicate that the CF3CO2− anions are nearly always coordinated to two or three Li+ cations, even for the dilute compositions (see Supporting Information), and thus are usually present as aggregate solvates (Fig. 4). The aggregate solvates with the CF3CO2− anions, however, differ from those formed with other anions, such as CF3SO3−, BF4−, ClO4− and PF6−, due to the tight clustering of ions which results from the coordination of the anions to multiple Li+ cations through the use of several of the electron lone-pairs on the CF3CO2− anion oxygen atoms. Crystalline solvate structures—i.e., (G2)1/3:LiCF3SO3 and (G4)2/5:LiCF3CO2 with diglyme and tetraglyme, respectively—also have CF3CO2− anions coordinated to two, three and even four Li+ cations using the available electron lone-pairs (Fig. 5).24,25 These structures therefore strongly supports the MD simulation results (Fig. 4). Some differences, however, are found between the coordination in the MD simulations and the solvate crystal structures. For example, some of the CF3CO2− anions in the simulations are coordinated to three Li+ cations with one of the Li+ cations having bidentate coordination by two of the oxygen atoms. Such coordination is not found in the two known solvate crystal structures, but it may be present within liquid electrolytes.
As noted above for the mixtures with BF4− anions, scrutiny of the solvates in Figs. 2–4 indicates that the vast majority of the Li+ cations have a coordination number of 4—irregardless of the anion present—due to both solvent and anion coordination. Thus, although the (AN)n-LiCF3CO2 electrolytes have a very low degree of solvation (<1.5 AN molecules per Li+ cation on average over a wide concentration range) as determined from both experimental1 and computational (Table V) analyses, highly concentrated liquid electrolytes (>5 M) can be prepared at room temperature due to the extensive anion coordination.1 In fact, some of the Li+ cations within the solvates are unsolvated (i.e., the cations are coordinated solely by four CF3CO2− anions) (Fig. 4).
Dynamics of solvate formation
The snapshots of the MD simulations (e.g., Fig. 1) do not provide any insight into the dynamics of the solvent and anion exchange in the Li+ cation coordination shells. One way in which this can be visualized is shown in Fig. 6. A similar plot was provided in an earlier publication which showed both the AN solvent and BF4− anion coordination to a specified Li+ cation from the previous (AN)n-LiBF4 simulations (many additional plots were also provided in the Supporting Information for varying electrolytes).3 Typical AN solvent residence times (i.e., time coordinated to a specified Li+ cation) from the simulations for the (AN)n-LiX (n = 10) mixtures at 60°C were 75–80 ps for the mixtures with LiBF4, LiClO4 and LiPF6. Significant differences were noted, however, for the residence times of the anions (i.e., individual anion...Li+ cation coordination bonds). A direct comparison of this is shown in Fig. 6 (note that the x-axis has been scaled up by an order of magnitude relative to the previously reported plots—i.e., 10,000 ps instead of 1000 ps). For each of the different electrolytes, the plot data consists of the anion residence times for the different anions within a single specified Li+ cation's coordination shell over the 10,000 ps time period. For example, for the electrolyte with the LiBF4 salt, 29 different BF4− anions are coordinated to the specified Li+ cation over 10,000 ps of the electrolyte simulation run. A dot is marked on the plot if a particular anion is coordinated for at least 40 ps during the 100 ps intervals. This Li+ cation is initially coordinated to three BF4− anions (and, presumably, one AN solvent molecule). At the beginning of the time period scrutinized, the first anion remains coordinated for ∼300 ps. The second anion remains coordinated for ∼100 ps, while the third anion remains coordinated for ∼400 ps. A fourth BF4− anion coordinates this Li+ cation around this time period, but for <40 ps so no dot is shown in the figure. This same anion then later recoordinates the same Li+ cation at a time of 5100 ps (this is attributed to the limited number (64) of anions present in and size of the simulation box). This particular Li+ cation in the LiBF4 electrolyte transitions back and forth between an aggregated state and coordination to a single anion (i.e., contact ion pair), with only brief periods when it is uncoordinated to BF4− anions (i.e., fully solvated). In contrast, Fig. 6 indicates that the specified Li+ cation in the LiPF6 simulation is typically either fully solvated or exists as short-lived contact ion pairs. The cation in the LiClO4 simulation behaves similarly, but the contact ion pairs are longer lived and some aggregation occurs as well. The cation in the LiCF3SO3 simulation exists as long-lived contact ion pairs or aggregates. In fact, for 1000 ps or so near the beginning of the time period reported in Fig. 6, the Li+ cation is coordinated to four CF3SO3− anions (and presumably uncoordinated by AN solvent molecules). This, coordination only by anions is uncommon in the LiCF3SO3 simulations, but coordinated to three anions is more frequently observed (Figs. 3, S7–S11, S21 and S22). The Li+ cation noted in Fig. 6 for the LiCF3CO2 simulation, however, is coordinated to three or four anions for much of the observed simulation period, although at one point it rapidly sheds all of the coordinated anions and for 1300 ps or so it becomes fully solvated. The on-off-on coordination for the same CF3CO2− anions in Fig. 6 is understandable given that the anions are bonded to multiple Li+ cations in tight ion clusters. When a coordination bond is broken with a Li+ cation, the anion remains located in close proximity enabling it to readily become recoordinated again. The solvates consisting of aggregated clusters of ions in the (AN)n-LiCF3CO2 electrolytes are thus expected to be quite long-lived, although it is evident that exchanges of the solvent molecules and ions do occur (Figs. S12–S14 and S23).
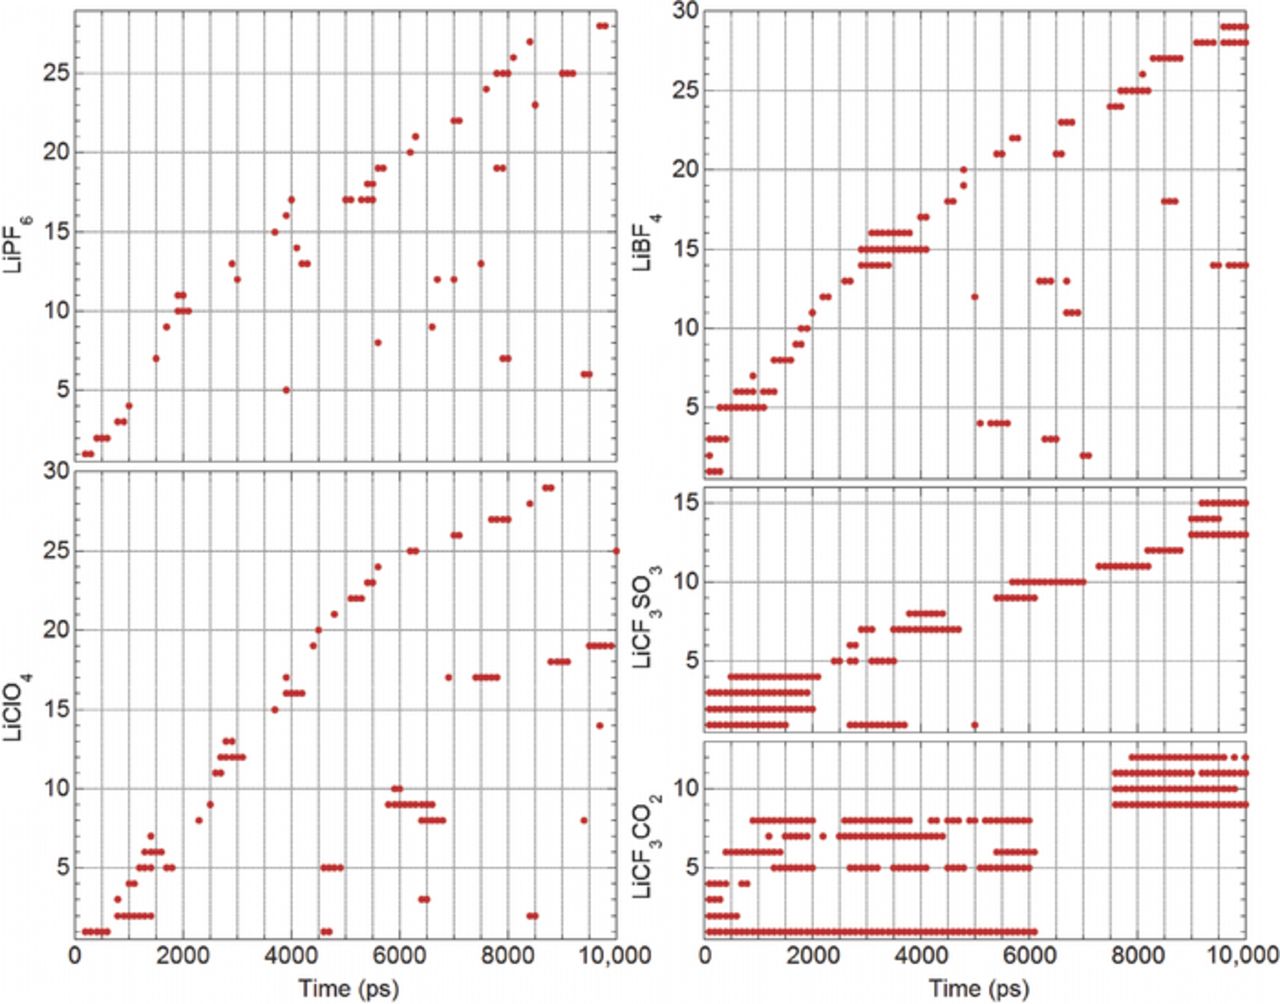
Figure 6. Examples of residence times for anions in the coordination shell of individual Li+ cations from the MD simulations of the (AN)n-LiX (n = 10) electrolytes at 60°C.
Fig. 7 summarizes the solvent and anion residence times (on average) for coordination to the Li+ cations as a function of the salt concentration obtained from the MD simulations. The solvent residence times are in good agreement with the values previously obtained for (AN)n-LiX electrolytes with other salts.3 For the most concentrated (n = 2) mixtures, most of the Li+ cations are extensively coordinated by anions. The long residence times of the anions (relative to the AN solvent molecules) and extensive polymeric aggregation of the ions perhaps restricts the ability of the solvent molecules to disengage from the coordinated Li+ cations and reorient (to be replaced by other solvent molecules or anions). Instead, the solvent molecules may break the coordination bond, but then shortly thereafter reform the bond resulting in the very long effective residence times noted.
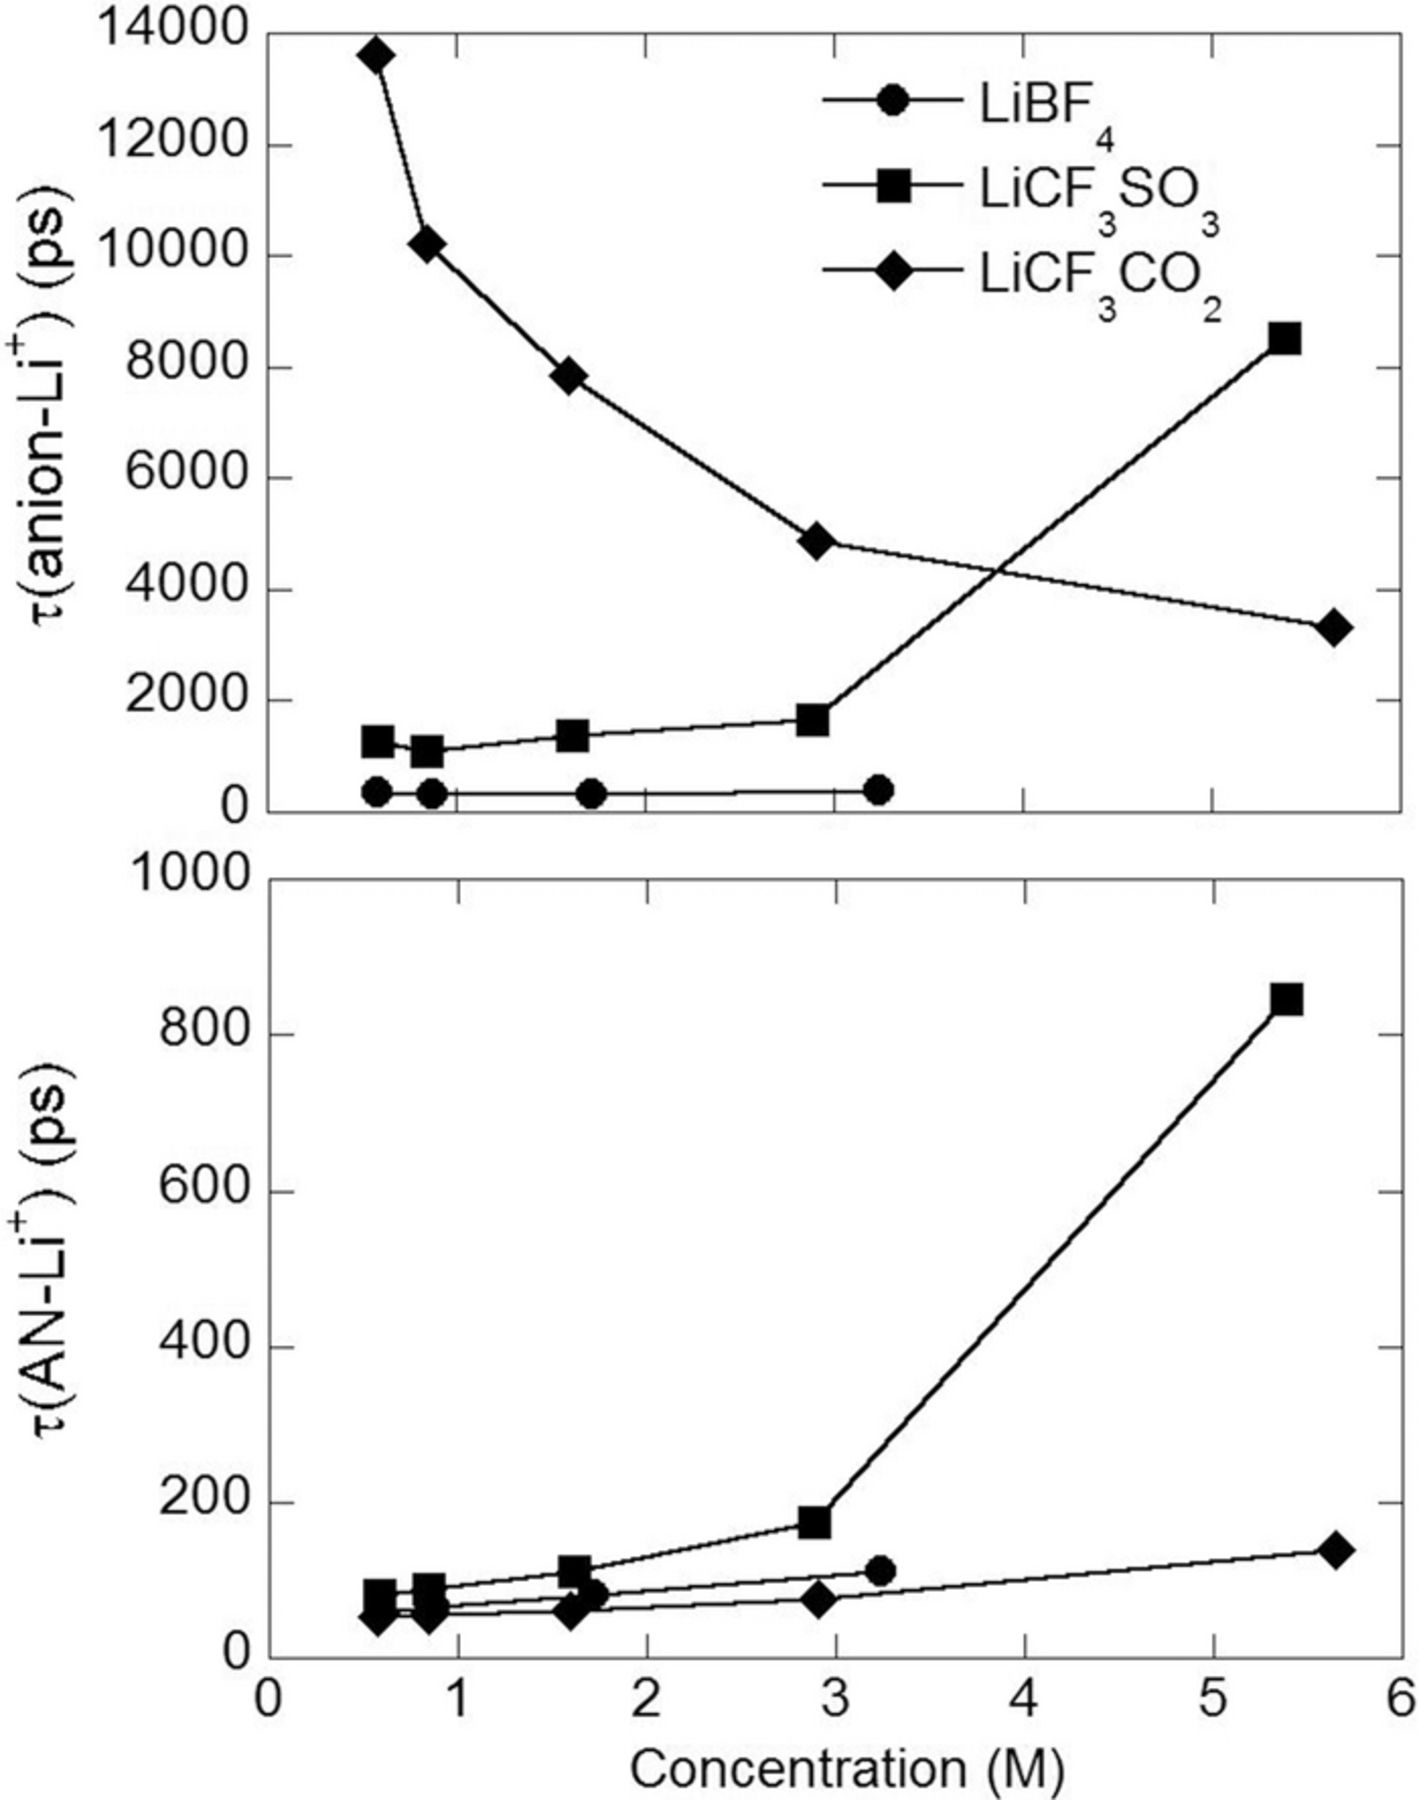
Figure 7. The AN-Li+ and anion-Li+ cation residence times (τ) from the MD simulations.
Additional insight into the mechanism(s) of the Li+ cation mobility is obtained by calculating the distance that a Li+ cations travels in one Li+-anion residence time period, as shown in Table S1. In the dilute (AN)n-LiCF3CO2 (n = 30) electrolyte, the Li+ cations travel (on average) > 100 Å before they exchange anions indicating that the Li+ cations within the aggregrate solvates move significant distances as either neutral or charged complexes and that these aggregates, and the few fully solvated Li+ cations, are therefore the dominant species present for charge transfer. As the salt concentration increases, however, the Li+ cations move up to 5 times shorter distances (< 20 Å) before exchanging anions indicating that an anion exchange mechanism becomes more important for more concentrated mixtures in which the aggregated solvates are in closer proximity to one another. In the dilute (AN)n-LiBF4 and (AN)n-LiCF3SO3 (n = 30) electrolytes, however, the Li+ cations move 5 and 3 times shorter distances with anions, respectively, than occurs for the (AN)n-LiCF3CO2 electrolytes. Nevertheless, in the dilute (AN)n-LiBF4 (n = 30) electrolyte, the Li+ cations move 20 Å (on average) before they exchange anions, which is the size of a few solvent molecules suggesting that motion with anions is still dominant in this concentration regime.
The data in Figs. 6 and 7 are only indicative of the anion residence times within the coordination spheres of the given cations. These figures provides no direct information about the types of solvates present—information which is instead obtained from the simulation snapshots (Figs. 2–4). The residence times of the anions are well correlated with the ionic association strength of the anions which increases in the order:1–3

As noted above, with increasing ionic association strength, the anions also tend to remain coordinated longer to the Li+ cations. This is quite significant as it indicates that the contact ion pair and aggregate solvates in the (AN)n-LiPF6 electrolytes have short lifetimes before the Li+ cations become fully solvated or transform into another form of solvate structure. In contrast, the aggregate solvates in the (AN)n-LiCF3CO2 electrolytes are long-lived, although they evolve and change in structure over time. Fig. 8 summarizes the total number of anions coordinated to the 64 different Li+ cations in the simulation boxes over the 10,000 ps simulation run period for each (AN)n-LiX electrolyte (e.g., 1 of the Li+ cations is coordinated to a total of 4 CF3CO2− anions, 10 are each coordinated to a total of 5 CF3CO2− anions, etc.). A direct correlation is found between the ionic association strength of the anions and the total number of coordinated anions. The Li+ cations in the electrolytes with the more associated salts are coordinated to the fewest number of different anions. The exception to this trend is the LiPF6 electrolyte (Fig. 8)—the probable explanation for the lower numbers of anions for the LiPF6 mixture, relative to the LiClO4 and LiBF4 mixtures, is that the PF6− anion is very weakly coordinating so less coordination occurs overall. Thus, the total number of anions coordinated to a given Li+ cation is a function of both the length of time in which the anions remain coordinated and the tendency of the anions to form coordinate bonds to the Li+ cations.

Figure 8. Number of anions coordinated to the 64 individual Li+ cations over the course of 10,000 ps of the MD simulations of the (AN)n-LiX (n = 10) electrolytes at 60°C (average values are shown in the labels).
One additional important aspect of this study pertains to electrolyte-electrode interactions. Generally, when a Li+ cation intercalates into or is plated onto an electrode or solid-electrolyte interphase,40 desolvation occurs. Based upon the information noted above, however, the shedding of the coordinated species is expected to be much slower if anions are part of the cation's coordination shell, although the polarized electrode surface may influence these dynamics. Thus, the ionic association state of the electrolyte (solution structure) likely impacts battery performance as a key determinant of both the ionic conductivity3,4 (and diffusion) and the electrode intercalation/plating kinetics (with the associated cell impedance).
Ion transport
The degree of ion uncorrelated motion (αd), sometimes called ionicity, determined from the simulations is shown in Fig. 9. In accord with the Li+ cation solvation numbers, αd is the largest for the (AN)n-LiBF4 electrolyte, followed by the (AN)n-LiCF3SO3 and -LiCF3CO2 electrolytes. It is instructive, however, to compare the fraction of fully solvated Li+ cations (i.e., labeled SSIP) shown in Fig. 9 with the behavior of αd. While the fraction of fully solvated Li+ cations for the simulations with LiBF4 and LiCF3SO3 drops monotonically, changes in αd with concentration are less pronounced. Large error bars (∼0.1) are expected, however, for αd for the n = 5 and 2 mixtures due to the slow ion dynamics in this range for the simulations with LiCF3SO3 and LiCF3CO2. Thus, the significant variance of αd for these salt concentrations is likely to be exaggerated. Interestingly, αd for the simulation with LiCF3CO2 shows an initial drop from 0.23 to 0.10 and then stays constant afterwards, while the fraction of fully solvated Li+ cations (SSIP) shows a similarly weak concentration dependence indicating that the LiCF3CO2 electrolyte is heavily aggregated over the wide concentration range studied.
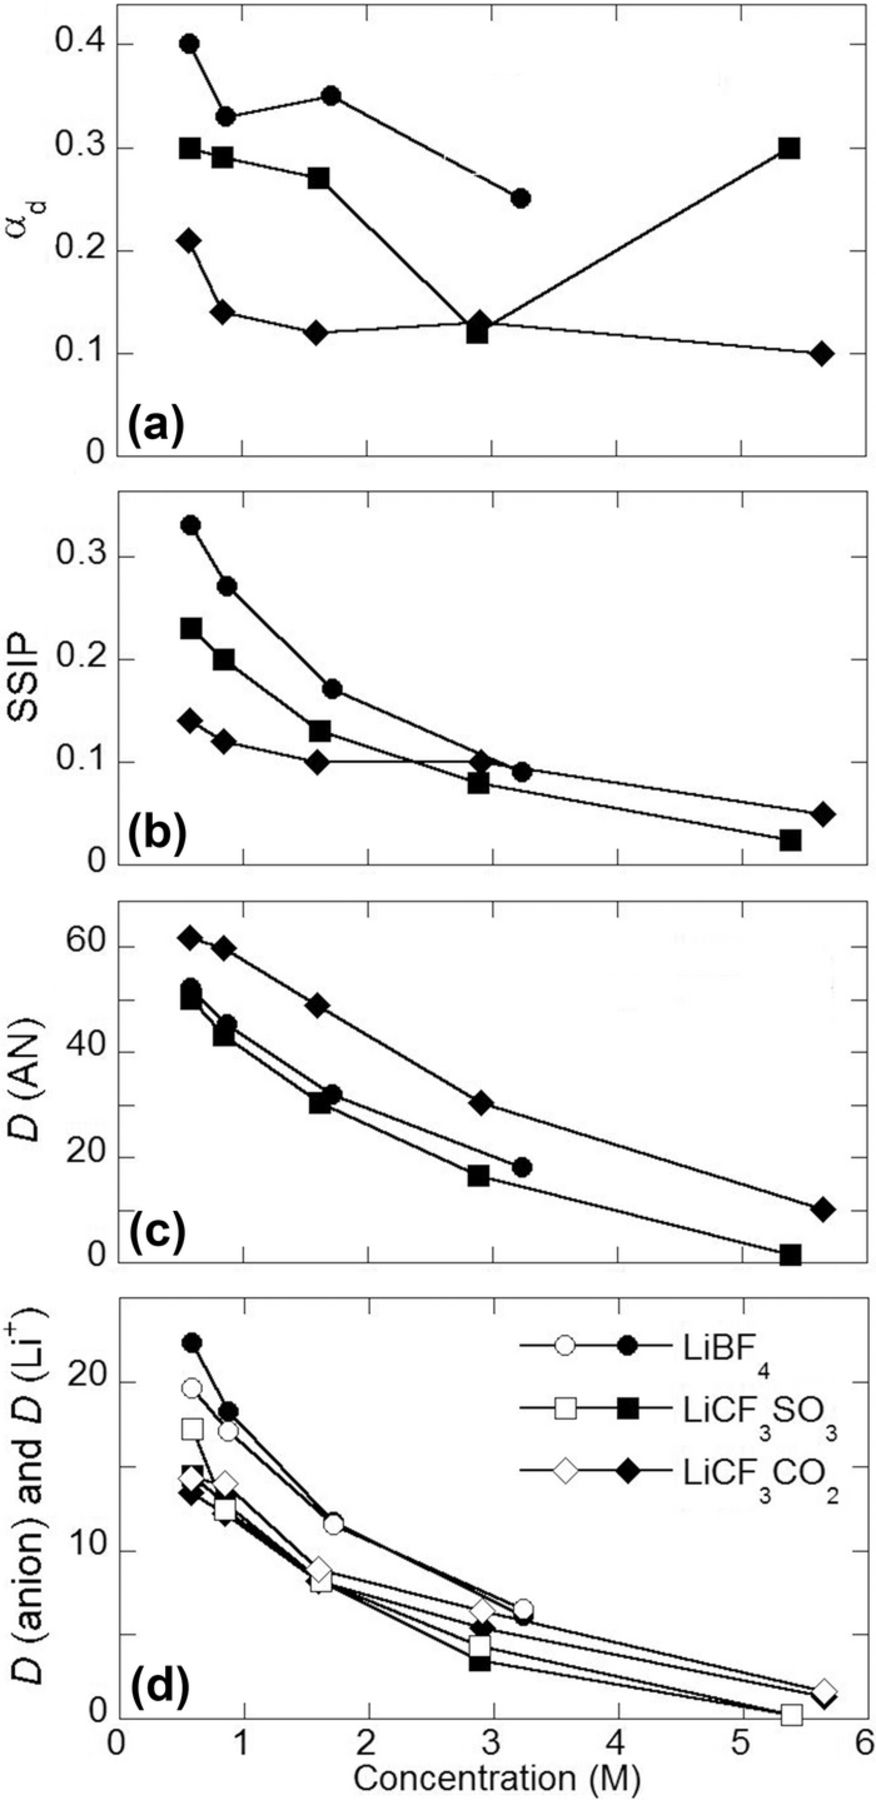
Figure 9. MD simulation calculated values: (a) degree of uncorrelated ion motion (αd), (b) fraction of fully solvated Li+ cations (solvent-separated ion pairs or SSIP), (c) AN solvent diffusion coefficients (10−10 m2 s−1) and (d) anion (filled symbols) and Li+ cation (open symbols) diffusion coefficients (10−10 m2 s−1).
The viscosity values (Tables III–V) were extracted from MD simulations using the Einstein relation, as described in the Supporting Information. The calculated viscosity of the electrolytes with LiCF3CO2 is lower than the viscosity of those with LiCF3SO3 due to the significantly higher fraction of uncoordinated AN solvent molecules in the former, while the smaller size of the BF4− anions, relative to the CF3SO3− anions, may perhaps explain the comparable or lower viscosity values for electrolytes with LiBF4 as compared to those with LiCF3SO3.
To further examine the relationship between the structural and transport properties, solvent and ion self-diffusion coefficient (D) and ionic conductivity (κ) values were also extracted from the MD simulations using the Einstein relations. For the AN solvent molecules, the highest diffusion coefficients (Fig. 9 and Table S1) are for the dilute electrolytes with LiCF3CO2. This likely reflects the greater fraction of uncoordinated solvent molecules in these electrolytes relative to those with LiCF3SO3 and LiBF4. The solvent diffusion coefficients decrease with increasing salt concentration as a greater fraction of the solvent becomes coordinated to the Li+ cations. For the calculated ion diffusion coefficients, the BF4− anions have higher values than the Li+ cations for the dilute electrolytes (<1 M or n = 30 and 20) (Fig. 9), but the diffusion coefficients become closely correlated for the more concentrated LiBF4 electrolytes perhaps due to increased aggregation of the ions. This is supported by the similar anion and Li+ cation diffusion coefficients for the LiCF3SO3 and LiCF3CO2 simulations (Fig. 9).
Validation of MD simulations
The experimental analysis of the AN solvent Raman vibrational bands indicated that the (AN)n-LiCF3CO2 mixtures have average solvation numbers of close to 1 over a wide composition range, even for the very dilute solutions.1 An examination of the MD simulation snapshot results for the (AN)n-LiCF3CO2 (n = 10) mixture shown in Fig. 4 finds that 91 AN molecules are coordinated to the 64 Li+ cations giving an average solvation number of about 1.42. Over the course of the entire equilibrium run, however, the solvation number is 1.35 (Table V). The solvation numbers from the MD simulations for the LiCF3CO2 mixtures over the entire concentration range studied only vary from 1.42–1.12 (Table V). These results are in excellent agreement with the experimental data.1 The corresponding solvation numbers from the MD simulations for the (AN)n-LiBF4 and -LiCF3SO3 (n = 10) mixtures shown in Figs. 2 and 3 are 2.80 and 2.42 (2.59 and 2.34, respectively, for the entire simulations—Tables III and IV). The calculated values for the (revised) LiBF4 mixtures are also in excellent agreement with the experimental data, while no experimental data is available for (AN)n-LiCF3SO3 mixtures.1 The phase diagram for the (AN)n-LiCF3CO2 mixtures indicates that bulk (uncoordinated) AN can be crystallized from the dilute mixtures, but a small amount can even be crystallized for the n = 2 composition (with no crystalline solvates forming).1 This is readily understandable from the low extent of solvation and extensive CF3CO2−...Li+ cation coordination found in these mixtures (Fig. 4).
Table IV. MD simulation data for the (AN)n-LiCF3SO3 mixtures at 60°C.
| Property (AN:Li ratio): | 30 | 20 | 10 | 5 | 2 |
|---|---|---|---|---|---|
| No. solvent in MD box | 960 | 640 | 640 | 640 | 512 |
| No. LiCF3SO3 in MD box | 32 | 32 | 64 | 128 | 256 |
| Concentration (M) from MD | 0.58 | 0.85 | 1.61 | 2.89 | 5.39 |
| Molality (mol kg−1) from MD | 0.72 | 1.02 | 1.77 | 2.77 | 4.20 |
| Simulation run lengtha (ns) | 22 (14) | 13 (9) | 30 (11) | 25 (8) | 28 (10) |
| Simulation box length (Å) | 45.09 | 39.62 | 40.384 | 41.88 | 42.89 |
| Density (MD) (g cm−3) | 0.804 | 0.835 | 0.914 | 1.045 | 1.283 |
| Density (Expt) (g cm−3) | – | – | – | – | – |
| Conductivity (MD) (mS cm−1) | 20.5 | 21.0 | 24.1 | 9.0 | 2.6 |
| Conductivity (Expt) (mS cm−1) | – | – | – | – | – |
| Viscosity (MD) (mPa s) | 0.31 | 0.37 | 0.54 | 1.38 | 30 |
| Viscosity (Expt) (mPa s) | – | – | – | – | – |
| Fraction of free Li+ (rLi–S > 3.75 Å) | 0.23 | 0.20 | 0.13 | 0.08 | 0.024 |
| Fraction of free CF3SO3− (rLi–S > 3.75 Å) | 0.20 | 0.15 | 0.08 | 0.03 | 0.005 |
| Fraction of free AN (rLi–N > 2.40 Å) | 0.91 | 0.81 | 0.77 | 0.59 | 0.25 |
| Li+ coordination numbers | |||||
| # N (within 2.40 Å of Li+) | 2.73 | 2.60 | 2.34 | 2.04 | 1.51 |
| # O (within 2.40 Å of Li+) | 1.1 | 1.23 | 1.51 | 1.83 | 2.38 |
| # S (within 3.75 Å of Li+) | 1.1 | 1.24 | 1.52 | 1.84 | 2.39 |
| Probability of finding the following number of Li+ cations within 3.75 Å of S of CF3SO3− | |||||
| 0 Li+ within 3.75 Å of S (SSIP) | 0.20 | 0.15 | 0.08 | 0.03 | 0.01 |
| 1 Li+ within 3.75 Å of S (CIP) | 0.54 | 0.50 | 0.41 | 0.28 | 0.08 |
| 2 Li+ within 3.75 Å of S (AGG-I) | 0.23 | 0.30 | 0.42 | 0.50 | 0.43 |
| 3 Li+ within 3.75 Å of S (AGG-II) | 0.03 | 0.04 | 0.09 | 0.19 | 0.48 |
| Li-N(AN) residence time (ps) | 82 | 88 | 112 | 175 | 846 |
| Li-S(CF3SO3−) residence time (ps) | 1260 | 1093 | 1387 | 1673 | 8522 |
Experimental values for the viscosity and ionic conductivity of the (AN)n-LiX mixtures with LiPF6, LiClO4, LiBF4 and LiCF3CO2 were previously reported.3 The lower viscosity values for the mixtures with LiCF3CO2 (relative to the other electrolytes)3 are explained by the solvate structure distribution (shown in Figs. 4 and S14–S17) and anion residence time (Fig. 6) information since this demonstrates that much of the solvent in the mixtures remains uncoordinated. Similarly, the low values for the ionic conductivity3 for the electrolytes with LiCF3CO2 are explained by the presence of large, long-lived aggregate solvates (Fig. 6) with only a few fully solvated Li+ cations and no uncoordinated anions present (Fig. 4).
Conclusions
This is principally a fundamental, computational study of electrolyte interactions rather than an effort to develop practical electrolytes, but the study does provide guidance for electrolyte design efforts. For example, in addition to providing mechanistic explanations for electrolyte transport properties,3 it may be important to understand the solvate species present and their populations (i.e., extent of ionic aggregation) as a function of electrolyte salt (i.e., anion) and salt concentration because anion reduction at an anode may dominate over solvent reduction in the highly aggregated regime,41,42 whereas solvent reduction may instead dominate when most of the Li+ cations are fully solvated. MD simulations of (AN)n-LiX mixtures with LiBF4, LiCF3SO3 and LiCF3CO2 have been analyzed in detail. A newly revised force field has been used for the BF4− anion resulting in simulations with significantly improved agreement with the previously reported experimental analyses. The simulations with LiCF3SO3 enabled the features of (AN)n-LiCF3SO3 electrolytes to be scrutinized which is not possible experimentally due to the formation of a solvate with a high melting point which forms even in very dilute mixtures. The simulations with LiCF3CO2, in particular, have a number of notable differences from the other simulations due to the strongly coordinating nature of the CF3CO2− anions. The results are in strong accord with the experimental data for the electrolytes. The simulated solution structures obtained for the electrolytes are therefore extremely insightful for delineating explanations for the properties of the electrolytes based upon the molecular and mesoscale interactions within the liquids.
Supporting Information
This file includes schematics for solvates complexes, the methods used for the transport property calculations from the MD simulations and additional plots showing examples of the solvate distributions/structures and anion residence times in the Li+ cation coordination shells obtained from the simulations. This file is linked to the electronic version of this manuscript.43
Acknowledgments
The computational work was partially supported by an Interagency Agreement between the U.S. Department of Energy and the U.S. Army Research Laboratory under DE-IA01-11EE003413 for the Office of Vehicle Technologies Programs including the Batteries for Advanced Transportation Technologies (BATT) Program. The authors wish to also express their gratitude to the U.S. Department of Energy, Office of Basic Energy Sciences, Division of Materials Sciences and Engineering which supported the evaluation of the computational work and preparation of the manuscript under Award DE-SC0002169.