Abstract
The U.S. Department of Energy (DOE) set the 2020 durability target for polymer electrolyte membrane fuel cell transportation applications at 5000 hours. Since it is impractical to test every fuel cell for this length of time, there is ever increasing interest in developing accelerated stress tests (ASTs) that can accurately simulate the material component degradation in the membrane electrode assembly (MEA) observed under automotive operating conditions, but over a much shorter time frame. In this work, a square-wave catalyst AST was examined that shows a 5X time acceleration factor over the triangle-wave catalyst AST and a 25X time acceleration factor over the modified wet drive-cycle catalyst durability protocol, significantly decreasing the testing time. These acceleration factors were correlated to the platinum (Pt) particle size increase and associated decrease in electrochemical surface area (ECSA). This square-wave AST has been adopted by the DOE as a standard protocol to evaluate catalyst durability. We also compare three catalyst-durability protocols using state-of-the-art platinum-cobalt catalysts supported on high surface area carbon (SOA Pt-Co/HSAC) in the cathode catalyst layer. The results for each of the three tests showed both catalyst particle size increase and transition metal leaching. Moreover the acceleration factors for the alloy catalysts were smaller due to Co leaching being the predominant mechanism of voltage decay in ∼5 nm PtCo/C catalysts. Finally, an extremely harsh carbon corrosion AST was run using the same SOA Pt-Co/HSAC catalyst. This showed minimal change in particle size and a low percentage Co loss from the cathode catalyst particles, despite a significant loss in catalyst layer thickness and cell performance. The carbon corrosion rates during these various ASTs were directly measured by monitoring the CO2 emission from the cathode, further confirming the ability of the square-wave AST to evaluate the electro-catalyst independently of the support.
Export citation and abstract BibTeX RIS

This is an open access article distributed under the terms of the Creative Commons Attribution 4.0 License (CC BY, http://creativecommons.org/licenses/by/4.0/), which permits unrestricted reuse of the work in any medium, provided the original work is properly cited.
Polymer electrolyte membrane fuel cells (PEMFCs) have the potential to be excellent alternative energy conversion devices; however, one of the biggest obstacles to their commercialization is the durability of the materials comprising the cathode catalyst layer (CCL). The U.S. Department of Energy (DOE) Fuel Cell Technologies Office (FCTO) has set a 2020 durability target of 5000 hours for PEMFCs used in transportation applications and 60,000 hours for PEMFCs used in stationary systems.1 To meet the automotive target, the U.S. DOE-FCTO, in conjunction with the U.S. DRIVE Fuel Cell Technical Team (FCTT), developed a 5000 hr drive cycle durability protocol to simulate the different degradation mechanisms a fuel cell experiences under normal transportation operating conditions (Table P.7 from Reference 1). This drive cycle is used to determine the durability of the entire membrane electrode assembly (MEA) and not the individual fuel cell components. The drive cycle varies operating conditions including potential, load, and humidity cycling; conditions that are known to degrade the catalyst, catalyst support, membrane, and bipolar plates. The U.S. DRIVE-FCTT drive cycle durability protocol is shown schematically in Figure 1.
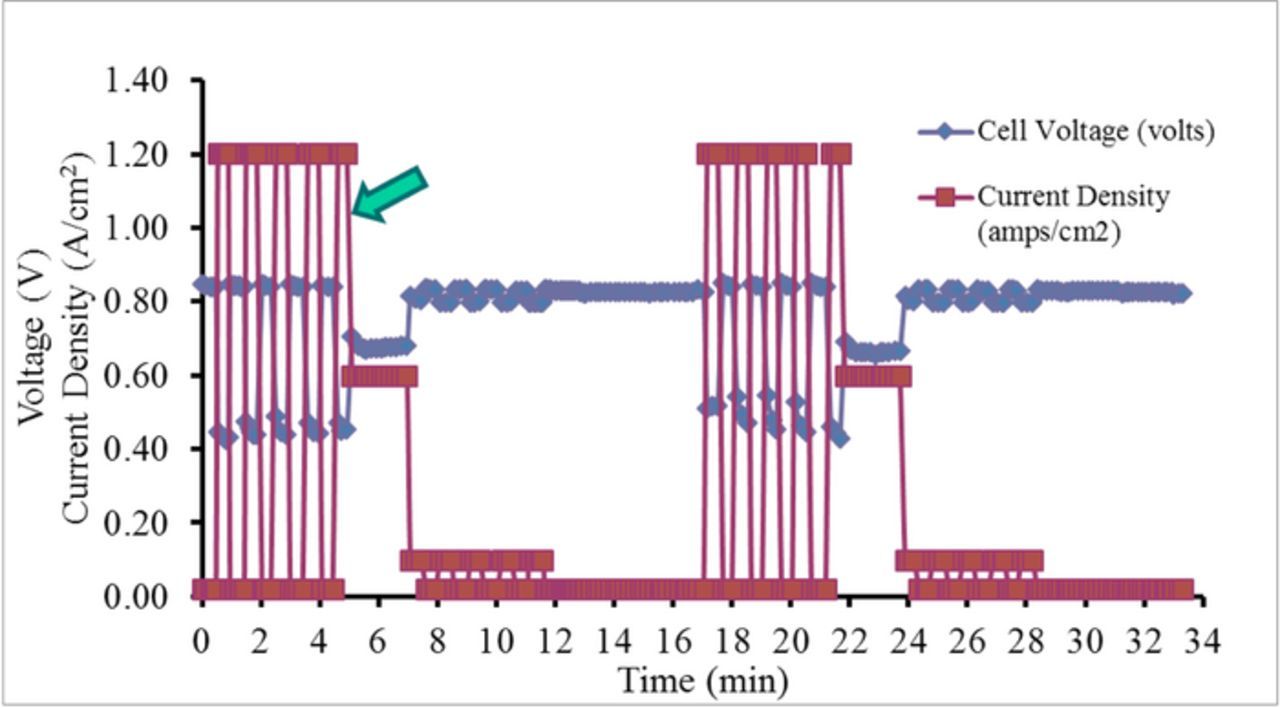
Figure 1. U.S. DRIVE-FCTT drive cycle durability protocol (2 cycles shown). First half of cycle (0–5 min.) operates under high humidity to accelerate catalyst and support degradation. Second half of cycle (7–17 min.) is at low humidity to accelerate membrane degradation.
It is not realistic to test every new fuel cell component that is developed for the full 5000 hrs. Thus, over the past several years, accelerated stress tests (ASTs) have been developed and refined to simulate the different materials/component degradation mechanism(s) experienced within the MEA of a PEMFC during operation. In particular, durability of the electro-catalyst is a key topic of interest for recent AST development efforts. Platinum (Pt) dissolution and re-precipitation, and the resulting increase in the catalyst particle size coupled with the leaching of the transition metal out of an alloy catalyst particle, and migration of Pt and/or alloying elements out of the CCL into the membrane, that occur during potential cycling, are the primary degradation mechanisms.2,3
Wang et. al showed that in acid media the equilibrium concentration of dissolved Pt was found to increase monotonically from 0.65 to 1.1 V then decrease above 1.1 V.4 This dissolution was increased by three to four orders of magnitude by cycling between these platinum reduction and oxide formation voltages.4–7 This potential range coincides with the main operational range of a PEMFC. It must also be noted that carbon corrosion rates are significantly accelerated above 1.15 V.2 Multiple organizations, including the DOE, the former U.S. Fuel Cell Council (USFCC), the Japan Automotive Research Institute (JARI), Fuel Cell Commercialization Conference of Japan (FCCJ), and Nissan, have all explored different potential cycling protocols that focused on optimizing the potential range and the scan profile for catalyst ASTs as summarized in Figure 2. The majority of these ranges focused on staying under 1 V where carbon corrosion is limited while including the Pt oxidation and reduction voltages. Results from the study done by M. Uchimura and S. Kocha at Nissan showed that Pt dissolution occurred at higher rates during a slower cathodic sweep rather than during the high potential hold. When held at a relatively low upper potential of 0.95 V the dissolution of bare Pt was very low with little change over 21 hours held. However during a slow cathodic sweep of 10 s, more time was available for the dissolution of platinum oxides.3,8–13 The hold time at the upper potential limit will control the degree of surface oxidation, and hence will affect the amount of dissolution occurring during the subsequent cathodic sweep, as demonstrated recently by Harzer et al.14

Based on these initial findings, and a 2012 DOE Hydrogen and Fuel Cells Program and Vehicle Technologies Program Annual Merit Review and Peer Evaluation Meeting presentation by Randal Perry from DuPont, a faster and more efficient catalyst AST was developed by Nissan that involved a square-wave from 0.6 V to 0.95 V with a 3 sec dwell time at each potential, Figure 2C.15 This catalyst durability AST was evaluated in detail in this study, validated, and adopted by U.S. DRIVE FCTT. The adoption of this protocol can be found in Table P.1 of the DOE FCTO Fuel Cells 2016 Multi-Year Research, Development, and Demonstration Plan.1
The goals of this work were three-fold. The first objective was to determine whether the catalyst AST was dependent on the support utilized. Here we performed both triangle-wave and square-wave ASTs on Pt catalysts supported on three different types of carbon. A high surface area carbon (HSAC), medium surface area carbon (Vulcan, V), and low surface area (highly graphitized) carbon (LSAC) were utilized for these experiments and the cathode Pt loading was kept constant at 0.2 mgPt/cm2. The carbon dioxide emission from the cathode during this test was also examined to measure the carbon corrosion rate during this AST. The second objective was to compare two different catalyst AST protocols; a square-wave and triangle-wave; and determine their respective acceleration factors with respect to a modified (just the wet/high-humidity portion) U.S. DRIVE-FCTT drive cycle durability protocol. These experiments were performed not only on standard Pt/C catalysts, but also compared with a SOA Pt-Co/HSAC cathode catalyst. These square-wave and triangle-wave catalyst ASTs and their parameters were selected because they are the FCTT's current and former standard AST.16,17 Lastly, the third objective was aimed to examine the durability of the same SOA Pt-Co/HSAC catalyst during a harsher carbon corrosion AST. This was also done in order to further determine the ability of these ASTs to evaluate the electrocatalyst independently of the support and distinguish the different particle growth mechanisms operational in these tests.
Experimental
Materials
Three different MEAs each with a different type of Pt/C used in the cathode (Pt/HSAC, Pt/V, and Pt/LSAC) were tested with the catalyst AST protocols. Pt/HSAC = TEC10E20E, Pt/V = TEC10V20E, Pt/LSAC = TEC10EA20E). All loadings were nominally 0.2 ± 0.05 mgPt/cm2 at the cathode, using 20% Pt/C. All Pt/C MEAs were prepared by Ion Power Inc. using their proprietary MEA techniques. The I/C ratio was 1.0 for Pt/HSAC and 0.5 for Pt/V-carbon and Pt/LSAC. The SOA MEAs incorporated Pt loadings of 0.1 mgPt/cm2 in MEAs with a 4.7 nm average particle size and a composition of 85% Pt 15% Co alloy. These MEAs were fabricated by General Motors Company (GM) using DuPont Nafion XL membranes. SGL SIGRACET 25BC GDLs were utilized for this study. All experiments were performed on a commercial 50 cm2 Fuel Cell Technologies hardware using either a single serpentine (all ASTs unless otherwise specified) or quadruple serpentine hardware (all drive cycles).The MEA containing Pt/HSAC was the only MEA tested using the modified wet drive cycle durability protocol.
There was a conditioning procedure for the MEAs that involved a overnight hold of 0.6 V and cycling between 0.3 and OCV for up to 2 hours. While this was sufficient for the Pt/C catalyst, it is seen that this is sometimes not sufficient for the alloy catalysts.
Catalyst ASTs
The triangle-wave catalyst AST consisted of potential cycling between 0.6 V–1.0 V at 16 s per cycle (50mV/s) for 30,000 cycles for a total test time of 133 hr. It was conducted in H2(anode)/N2(cathode) at 200 and 75 sccm respectively at 100% relative humidity (RH) and atmospheric pressure. The high flow square-wave catalyst AST consisted of potential cycling between 0.6 V–0.95 V at 3 s at each potential for 30,000 cycles for a total test time of 50 hr (Potential changed at ∼700 mV/s). This AST was run at 200 sccm H2/N2, 100% RH and atmospheric pressure. Electrochemical characterization for these two tests included measuring the catalytic mass activity at the beginning and end of each test, polarization curves, electrochemical surface area (ECSA), and hydrogen crossover after 0, 1000, 5000, 10,000, and 30,000 cycles.
The modified wet drive-cycle durability protocol consisted of cycling in H2/Air at 0.65/1.8 LPM at 100% RH between 0.02 A/cm2 (30 s) and 1.2 A/cm2 (30 s). Operation at 60 s per cycle for 72,000 cycles provided a total test time of 1200 hrs. The upper potential was ∼0.85 to 0.9 V whereas the lower potential was 0.4 V to 0.6 V. The variation in the potential is due to the difference in the loading, catalyst (PtCo vs Pt), and ageing time. Electrochemical characterization for the modified wet drive-cycle durability protocol included measuring catalytic mass activity at the beginning and end of each test, polarization curves, ECSA, and hydrogen crossover measured every few hundred hours. This drive cycle was also run on the three different MEAs using different carbon supports.
Another series of AST tests were run using just a Pt/HSAC catalyst with a Pt loading of 0.15 mg/cm2. For this test, two additional square-wave catalyst ASTs were run, one with the N2 flow lowered to 75 sccm (low flow) in a quad serpentine (4-serp) flow field and another with the lowered N2 flow in a single serpentine flow field (1-serp). Final Pt particle size was measured using X-ray diffraction (XRD).
Catalytic mass activity was measured at 900 mV iR-corrected in H2/O2, 100% RH, 80°C at 150 kPa absolute back pressure with high flows (500 sscm) at the anode and cathode. This is based on a protocol by Gasteiger, et al.18 ECSA and hydrogen crossover were measured in H2/N2 at 80°C, 100% RH and 275 kPa. The ECSA was calculated by integrating the H2 desorption region of a cyclic voltammogram measured in H2/N2. This is based on work by M. Inaba, et al.19 Specific protocols for all these characterizations can be found in the Fuel Cells 2016 Multi-Year Research, Development, and Demonstration Plan.1 It should be noted that this work focuses on comparing durability as a function of ECSA loss therefore mass activity and hydrogen crossover data are not presented.
In addition to the catalyst AST, the durability of the same SOA Pt-Co/HSAC catalyst was examined during a carbon corrosion AST, where MEAs were subjected to potential cycling between 1.0 V–1.5 V at 500 mV/s in H2/N2 at 100% RH, 80°C. Electrochemical measurements were acquired at 0, 500, and 1000 cycles. Durability was assessed by measuring the electrode thickness, kinetic performance, and the catalyst particle size and composition for beginning-of-test (BOT) and end-of-test (EOT) MEAs.
Carbon corrosion was measured in situ by monitoring the carbon dioxide in fuel cell exhaust gases through non-dispersive infrared spectroscopy (NDIR). Quad-serpentine 50 cm2 cells were connected to a fuel cell test station with gas flows of 200 sccm H2 (anode) and 75 sccm N2 (cathode). Cathode potential was controlled by a potentiostat and three different conditions were examined vs anode (RHE); 1.2 V hold, 0.6–0.95 V cycling, and 1.0 V–1.5 V cycling. A Pt/HSAC (50% Pt/C) catalyst based MEA was utilized in this study and the carbon corrosion rate was calculated based on the CO2 concentration monitored by the NDIR and recorded every 2 sec.
Post AST S/TEM analysis
Post-AST transmission electron microscopy (TEM) and scanning transmission electron microscopy (STEM) analyses was conducted at Oak Ridge National Laboratory (ORNL). MEA cross-sections were prepared by embedding the MEA in epoxy and sectioning (∼70 nm thick cross-sectional slices) using diamond-knife ultramicrotomy (Leica EM UC7). TEM analysis of the microtomed MEA sections was performed on a Hitachi HF-3300 TEM/STEM operated at 300 kV. Equivalent diameters of individual particles were measured using Fiji/ImageJ following intensity threshold segmentation, counting approximately 500 particles, plotting the distribution and calculating the average based on this distribution. STEM-based tomography, imaging, and energy dispersive X-ray spectroscopy (EDS) were performed on a 200 kV FEI Talos F200X. STEM tomography 3D reconstruction of Pt-Co/HSAC at BOT and EOT was performed, the protocols of which are described in a recent publication.20–22 The 3D reconstruction allowed for the measurement of average Pt-Co size and average Pt-Co composition.
Results and Discussion
US DOE adopted Square-wave catalyst AST
The US DOE adopted square-wave catalyst AST was compared to both the triangle-wave catalyst AST and the modified wet drive-cycle catalyst durability protocol by tracking the catalyst ECSA loss (degradation rate) during each test. Figure 3 shows the ECSA measured and correlates that to the average volume weighted crystallite size measured by XRD for various MEAs. As expected there is a very good correlation of the Pt particle size and ECSA with the larger particles showing a dramatic drop in ECSA. The trend holds whether the MEAs were fresh or subjected to different ageing conditions including catalyst cycling AST and carbon corrosion AST. The 3 fresh samples are Pt/HSAC, Pt-V-carbon and Pt-LSAC in increasing order of particle size and decreasing order of ECSA. This is consistent with the fact that the amount of platinum particles sites available on the surface of the Pt nanoparticles controls the ECSA. Given this trend, the ECSA was used as the primary parameter to track acceleration factors and degradation rates of various samples subjected to the drive cycle and AST protocols. Moreover, all acceleration factors in this paper are based on the change in ECSA with time.
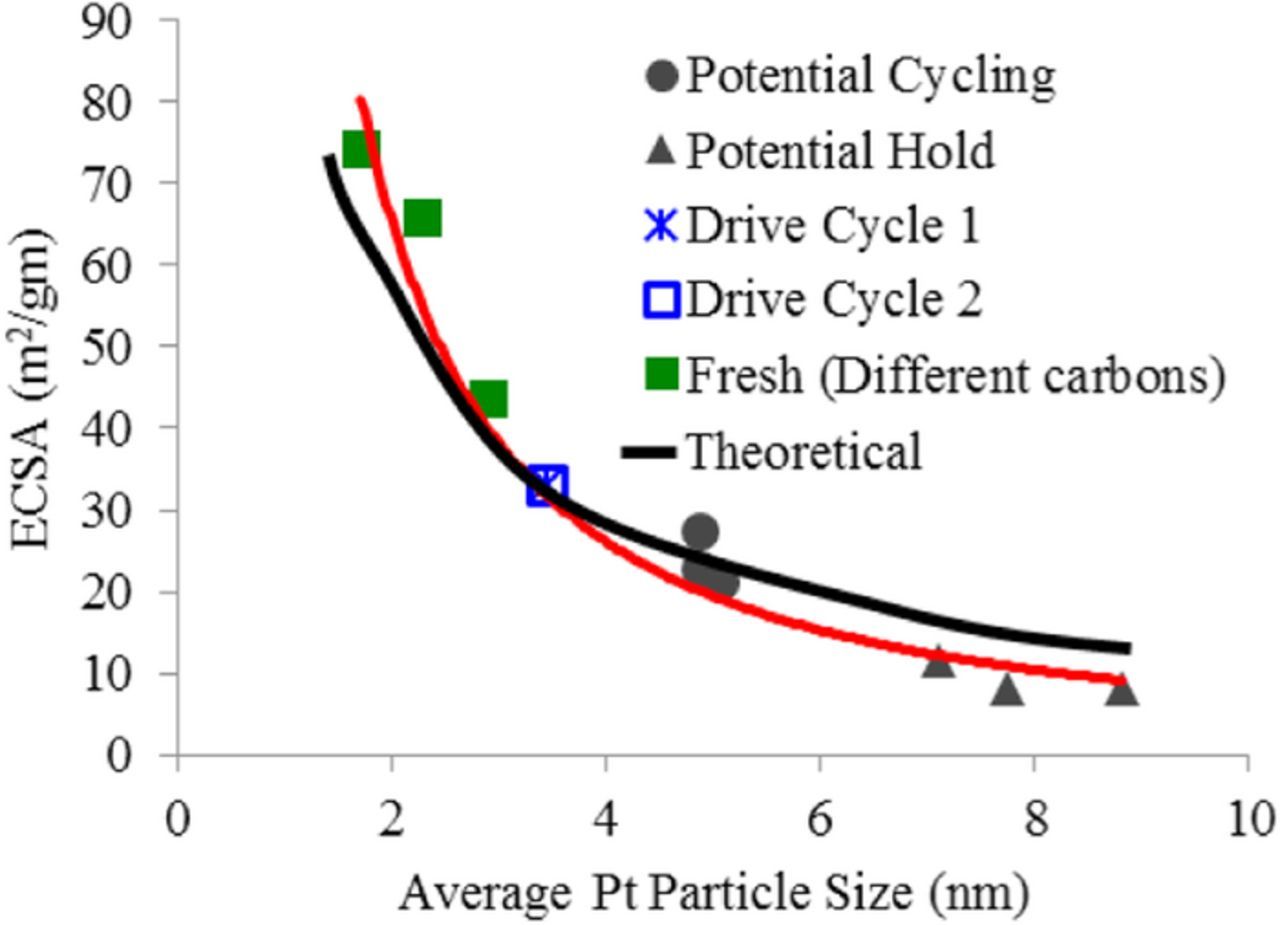
Figure 3. Correlation between ECSA measured in an MEA and the catalyst particle size.
The plots in Figures 4A, 4B show that the high flow square-wave catalyst AST is accelerated with respect to number of potential cycles than the triangle-wave AST or the wet drive-cycle durability protocol (Figure 4A blue lines). The triangle-wave AST exhibited a similar degradation rate with respect to number of cycles as the wet drive-cycle durability protocol. These results are consistent with the fact that the Pt growth (due to dissolution and re-precipitation) at a given fuel cell operating condition (T, RH, pressure etc.) is primarily influenced by the upper potential, the rate of potential change and the time at the upper potential. While the triangle-wave had the highest upper potential (1.0V), the 50 mV/s voltage scan-rate seems to significantly slow the degradation rate compared to the rapid potential changes of the square-wave catalyst AST and wet drive-cycle. The upper potential of the square-wave catalyst AST was still high (0.95 V) to provide high degradation rates while that of the drive-cycle was <0.9 V and resulted in significantly lower degradation. Figure 4B illustrates the acceleration factors of these two catalyst ASTs with respect to the wet drive-cycle durability protocol where the square-wave exhibited a 20X acceleration (with respect to time of test) for all three Pt/C catalysts tested in MEAs, viz., Pt/HSAC, Pt/V, Pt/LSAC, compared to the triangle-wave catalyst AST (red lines) and a 100X acceleration (with respect to time) for all three Pt/C tested when compared to the modified wet drive-cycle catalyst durability protocol (black line). Results for each test shows that the different types of Pt/C all exhibited similar ECSA loss at EOT. These results indicate that the catalyst AST is not affected by the type of carbon used.
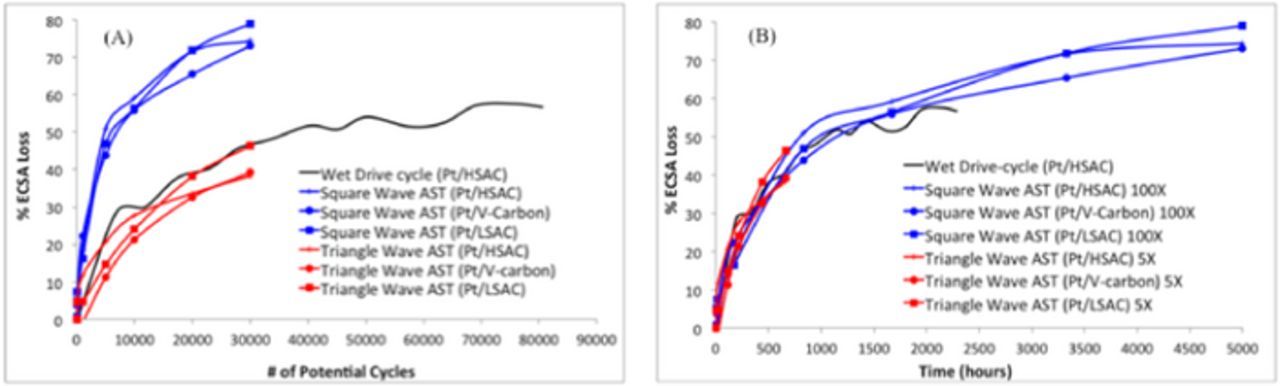
Figure 4. Degradation rate (ECSA loss) calculated during the high flow square-wave catalyst AST compared to that during the triangle-wave catalyst AST and the modified wet drive-cycle catalyst durability protocol as a function of the number of potential cycles (MEAs tested using each protocol incorporated Pt/HSAC, Pt/V, Pt/LSAC). (A) With respect to number of potential cycles and (B) with respect to total cycle time, where the actual testing time was multiplied with 5 (triangle-wave), or 100 (square-wave).
The carbon corrosion rate during potential cycling from 0.6 V to 0.95 V was measured using an NDIR and compared to the corrosion rate at 1.2 V hold and 1.0–1.5 V cycling (Figure 5A). This data shows that the carbon corrosion rate when cycling from 1.0–1.5 V is at least an order of magnitude greater than that during a 1.2 V hold which is a further order of magnitude greater than that due to cycling from 0.6–0.95 V. These results are consistent with previous reports in the literature where the carbon corrosion rate increases exponentially with potential.23 The actual carbon corrosion rate measured by NDIR during the catalyst cycling AST should result in little carbon corrosion over the 50 hour test since the voltage has been capped to 0.95 V (square-wave) or 1 V (triangle-wave)24 Based on the catalyst AST carbon corrosion measured in Figure 5A (purple line) the average carbon corrosion rate was 1.8 μg/cm2.hr over 50 hours or less than 5% loss, Figure 5B. Further experiments measuring the corrosion rate over longer times of catalyst cycling need to be performed to minimize errors due to extrapolation.
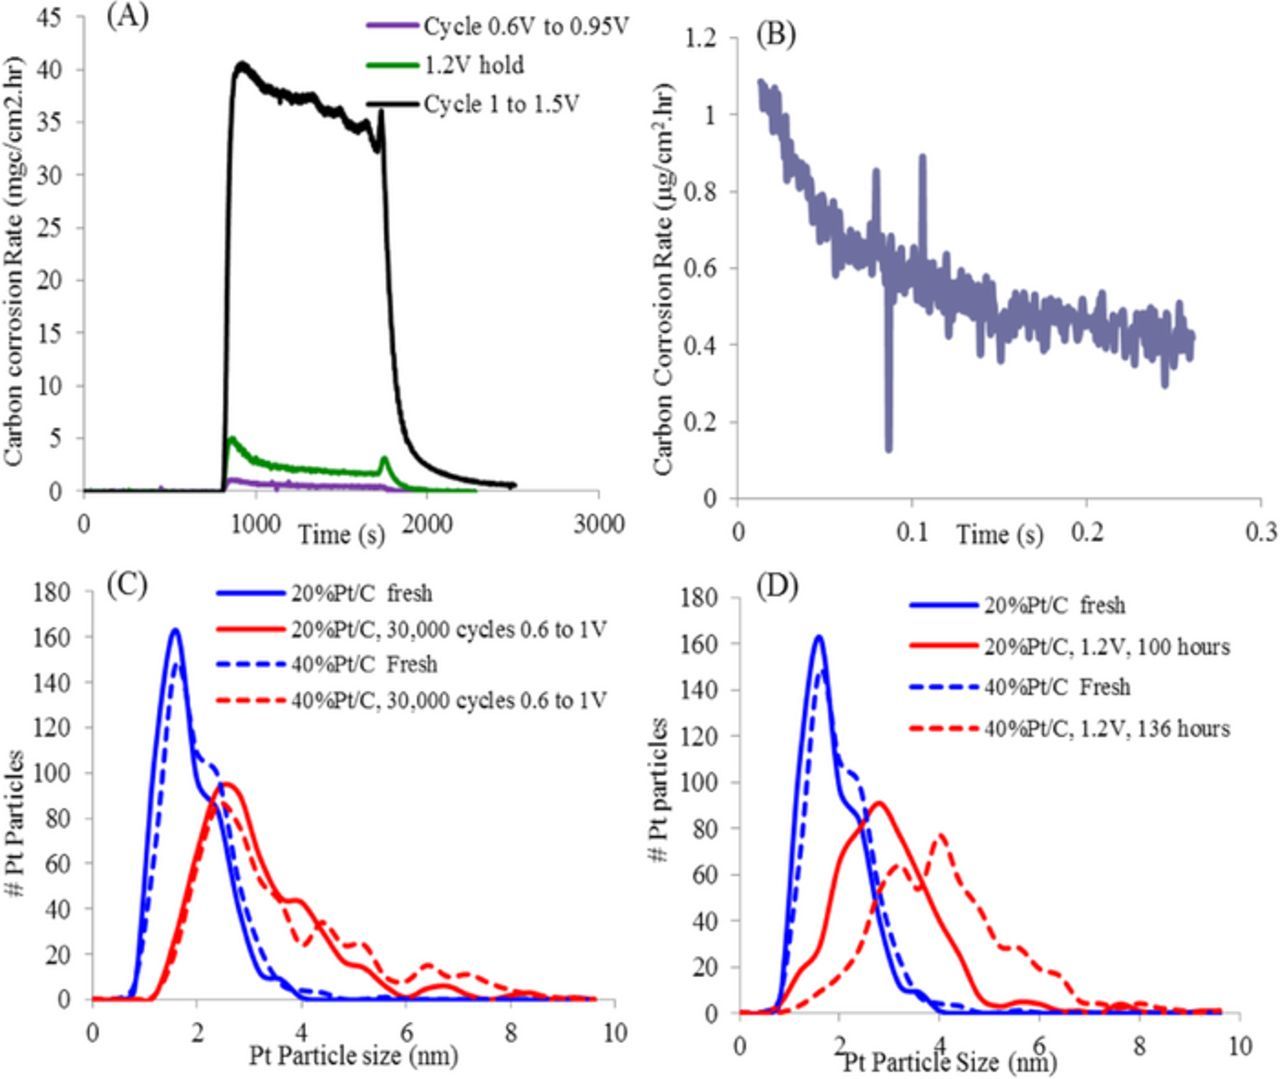
Figure 5. (A) Carbon corrosion rate of Pt/HSAC based MEA as measured by an NDIR under varying potentials at 80°C, 100% RH. (B) Carbon corrosion rate under 0.6–0.95 V square-wave catalyst. Pt particle size distribution measured by TEM of MEAs before and after (C) catalyst AST and (D) carbon corrosion AST.
Therefore it is expected that the dissolution and re-precipitation of Pt is the main degradation mechanism operating in this potential range. Figure 5C illustrates the Pt particle size distribution of two MEAs subjected to the 0.6V–1.0 V triangle-wave catalyst AST where the particle growth rate is independent of the Pt/C ratio in the catalyst. In contrast Figure 5D illustrates the particle size distribution of the same MEAs subject to 1.2 V hold. During this test, the carbon corrosion and subsequent agglomeration of Pt should be the main degradation mechanism resulting in substantially larger Pt growth for the 40% Pt/C sample when compared to the 20% Pt/C sample. The main difference between the two catalysts is the Pt inter-particle distance, which might be the reason for the stronger growth in the 40% Pt/C catalyst. There is 74% and 54% ECSA loss after carbon corrosion for the 20%P/C sample and 40% Pt/C sample and 40% and 34% ECSA loss for those samples after catalyst AST. Since the Pt loading on the 2 MEAs are not equal these data were not presented in the paper. The ECSA data is consistent with the reported particle size account for the fact that the catalyst utilization is lower in the high loaded sample.
In these MEAs the catalyst loadings were different in order to retain a similar carbon content in the cathode catalyst layer (∼0.65 mgC/cm2). Since the Pt loading of the MEA with the 40% Pt/C sample was higher than that with the 20% Pt/C sample, it was operated for about 36 hours longer to observe similar performance loss.
Figure 6 illustrates that, while the acceleration obtained due to the square-wave over the triangle-wave can be significant, it varied based on the exact conditions of the square-wave catalyst AST. The final platinum particle size was measured by XRD and compared in Figure 6. The lowest ECSA loss and particle size increase (2 nm to 3.6 nm) was obtained for the triangle -wave AST. In this case, to make a fair comparison, the upper potential for the triangle-wave AST was decreased from 1.0 V to 0.95 V. The square-wave catalyst AST run at high N2 flow in 4-serp flow field had the largest ECSA loss and largest EOT particle size and spread, with average size ranging from 4.9 nm near the cell inlet to 5.4 nm near the outlet. The square-wave AST run at low N2 flows in 1-serp flow field had a slightly lower decay rate and very uniform Pt particle growth measured at 4.8 nm at the inlets and outlets. This is followed by the square-wave catalyst AST run at low N2 flows in 4-serp flow field with an EOT particle range between 4.3 nm and 4.6 nm. These results indicate that while the high flow-rate AST had the highest acceleration factor, it also resulted in non-uniform decay rates. The uniformity in decay rate was improved significantly at lower flows and was marginally better with the use of 1-serp flow fields instead of 4-serp flow fields (Figure 6). Although this phenomenon was not studied in detail, the data is reproducible (3 MEAs at high flows shown in Figure 4 and several MEAs at low flows in Figures 6 and 7). These differences are consistent with variations in local flow and RH conditions at high flows and complex flow fields. The pressure drop and water distribution in the two flow fields are expected to be different at high flows in H2/Air. However, not much difference is expected under the conditions of the AST which is in N2 and at low flows. Since the drive cycle is operated at large currents (1.2A/cm2) it is critical to have better water removal and therefore 4-serp was used. However for ASTs, uniform degradation is required and the 1-serp provided the most uniform degradation. Therefore ASTs were conducted primarily at low cathode flows and single serpentine flow fields. It should be noted that Pt loading did have an effect on ECSA decay rates and all MEA Pt loadings were kept similar in this paper. At very high loadings it is expected that the Pt utilization will be lower and the ECSA decay rate was not as high with change in Pt particle size. These results are also consistent with the fact that the ECSA decay rate with particle size observed in Figure 3 is slightly lower than that predicted theoretically from particle size decrease alone.
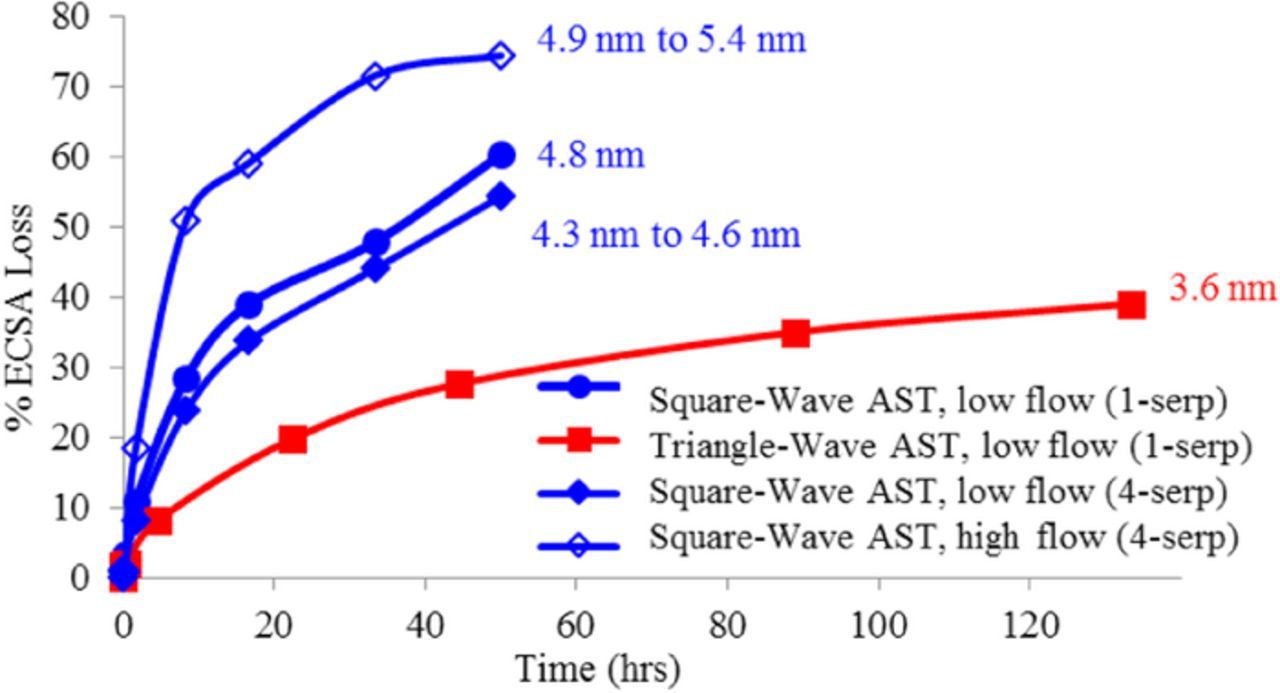
Figure 6. EOT particle sizes for square-wave catalyst AST with low N2 flow in 1-serp flow field, triangle-wave catalyst AST with low N2 flow in 1-serp flow field, square-wave catalyst AST with low N2 flow in 4-serp flow field, and square-wave catalyst AST with high N2 flow in 4-serp flow field.
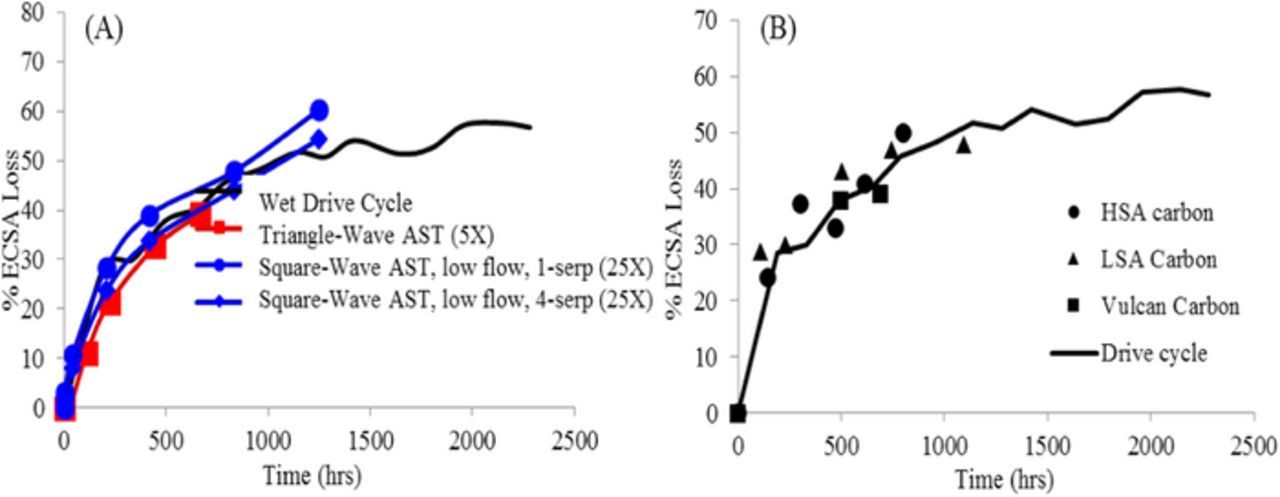
Figure 7. (A) Low flow square-wave catalyst AST on Pt/HSAC catalyst with a 5X time acceleration factor over the triangle-wave catalyst AST and a 25X time acceleration factor over the modified wet drive cycle catalyst durability protocol. (B) The drive cycle data from Figure 4B plotted with repeats from 3 other MEAs using different Pt/C materials.
In order to determine the acceleration factors of the low-flow square-wave AST, the degradation rate was again compared to the wet drive-cycle durability protocol. The low flow square-wave catalyst AST run in both 1-serp and 4-serp flow fields is compared to the triangle-wave catalyst AST and wet drive-cycle catalyst durability protocol in Figure 7A. It is seen that the low flow square-wave catalyst AST shows a 5X time acceleration factor over the triangle-wave catalyst AST and a 25X time acceleration factor over the wet drive-cycle catalyst durability protocol. This can be contrasted with Figure 4A where the triangle-wave AST is very similar to the wet drive-cycle in terms acceleration factors with respect to potential cycles. To summarize, the low-flow square-wave gives a 5X acceleration compared to triangular-wave and another 5X compared to the wet drive-cycle catalyst durability protocol (total of 25X). This is in contrast to previous results, where the high flow square-wave showed a 20X acceleration over the triangle-wave and another 5X over the wet drive-cycle catalyst durability protocol (total of 100X). The 5X acceleration factor of the low-flow square-wave over the triangle-wave can be broken down into the shorter time per cycle (2.7X) and a higher inflicted degradation (1.9X). This is shown in Figure 7A where the square-wave is accelerated by 5X (as compared to 2.7X) over the triangle-wave. The wet drive-cycle catalyst durability protocol was then repeated with another Pt/HSAC based MEA and two others using LSAC and V-carbon respectively. This data is plotted in Figure 7B where these three repeats fall within 10% of the ECSA observed for the original drive-cycle experiment. It should also be noted that the upper potential for the square wave is 0.95 V while that for the triangle wave is 1.0 V as recommended in the DOE protocols utilized in this work. The adoption of this low N2 flow protocol can be found in Table P.1 of the DOE FCTO Fuel Cells 2016 Multi-Year Research, Development, and Demonstration Plan.1 The low N2 flow square-wave catalyst AST was used for the rest of the data collected in this study presented.
It should be noted that previously published post-AST microstructural studies have extensively examined the effect of catalysts ASTs on different types of carbon supports and therefore these efforts were not repeated in this work.19
Comparing catalyst durability protocols using a SOA Pt-Co/HSAC catalyst
The three different catalyst durability protocols (square-wave, triangle-wave, and wet drive-cycle) were also compared using a SOA Pt-Co/HSAC cathode catalyst. Figure 8 compares the ECSA losses for the SOA Pt-Co/HSAC catalyst resulting from the application of the three catalyst durability protocols. After 30,000 cycles (EOT for the square-wave and triangle-wave catalyst ASTs), the percentage of ECSA loss measured for each protocol was similar, falling within 10% of each other.
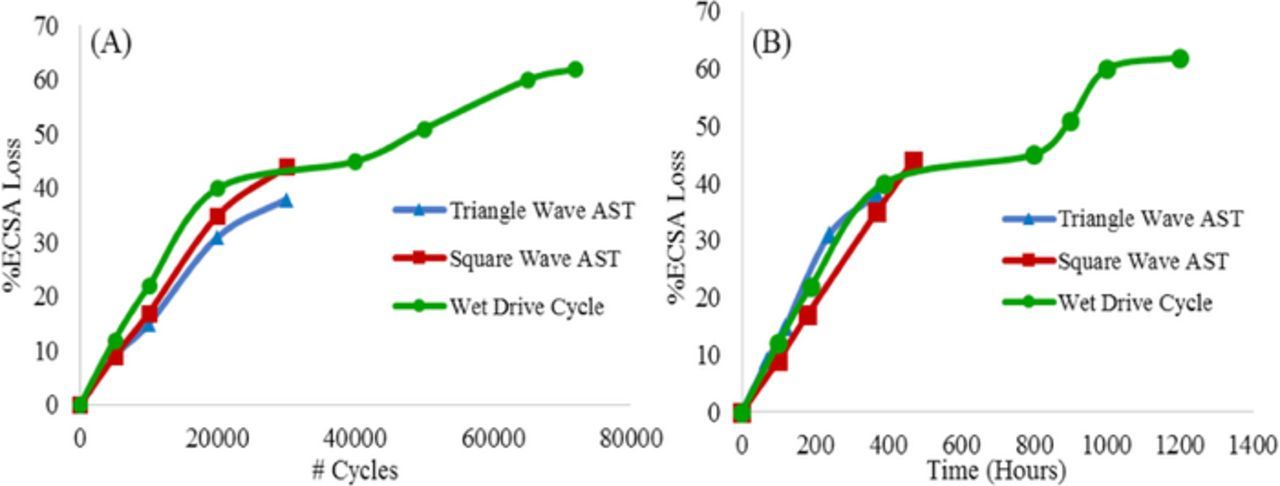
Figure 8. Comparison of degradation rates (ESCA losses) for durability tests performed using square-wave and triangle-wave catalyst ASTs, and modified wet drive cycle catalyst durability protocol for MEAs with SOA Pt-Co/HSAC cathode catalyst. (A) With respect to number of potential cycles and (B) with respect to total cycle time.
The SOA Pt-Co/HSAC-containing MEAs (BOT and EOT conditions) were characterized via S/TEM. Figure 9 shows a series of TEM images that demonstrate the change in catalyst particle size following each of the three durability tests. The modified wet drive-cycle durability protocol (1200 hours of testing) caused the most Pt-Co particle growth, while the two catalyst durability ASTs caused similar amounts of Pt-Co particle growth, which followed the same trend observed for the ECSA loss seen in Figure 8. With an initial particle size of almost 5 nm (compared to about 2 nm for the Pt/C), for these SOA Pt-Co/HSAC alloy catalysts the ECSA loss is not as significant due the stability of the larger particles (grow only to ∼5.5 nm after 30,000 cycles) and it is not surprising that the results are different from those of the smaller particle Pt/C catalysts. Moreover the Co content of the samples after the square-wave and triangle-wave AST decreased to 11% from the original 15%. Therefore the conclusions for the alloy catalysts are different from those of the traditional Pt/C catalysts. Finally it should be noted that the wet drive-cycle samples showed greater degradation and had only 5% Co after 1200 hours and 7.4 nm catalyst particle size. These results are summarized in Table I. These results indicate that while the catalyst ASTs can be applied to alloy catalysts, the acceleration factors observed are slower for these larger particle-size catalysts. This is illustrated in Figure 8B where with respect to time the square-wave and the triangle-wave catalyst ASTs are accelerated 10X and 2.5X with respect to the wet drive-cycle. This paper is limited to the mechanisms of particle size growth and ECSA loss and does not focus on performance losses. The effect of ECSA loss on performance are different for the 2 nm Pt/C and 5 nm PtCo/C catalysts. As reported in Figure 1 of Macauley et. al the absolute ECSA losses for the alloy sample are not as high as the Pt/C sample although the % losses are not that different (Due to the significantly lower starting ECSA). It is not exactly clear why the % losses are still as high as they are, they could be an artifact of the already low ECSA and the fact that the errors of measuring the ECSA of an alloy catalyst through the underpotential deposited hydrogen (HUPD) are higher.25
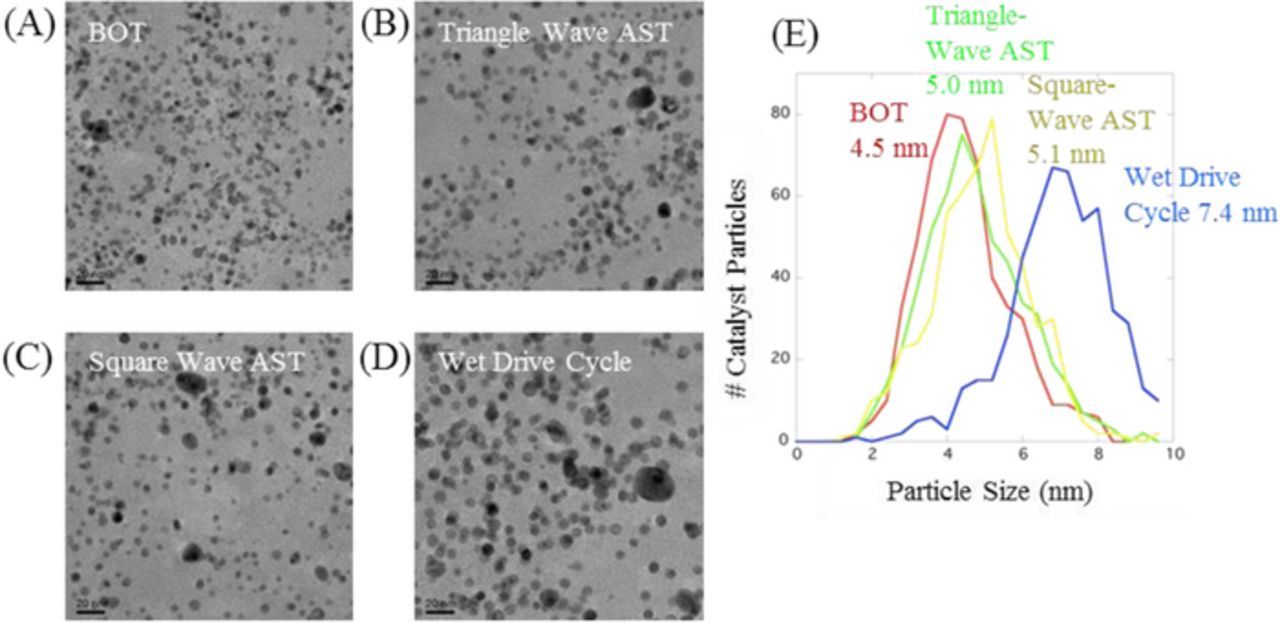
Figure 9. S/TEM images of the SOA Pt-Co/HSAC particle size at BOT and EOT conditions and their particle size distributions.
Table I. Summary of the average Pt-Co particle sizes and compositions of SOA Pt-Co/HSAC catalyst at BOT and EOT conditions as measured by both TEM and S/TEM.
| BOT | Triangle-Wave AST | Square-Wave AST | Wet-Drive Cycle | |
|---|---|---|---|---|
| Particle Size | 4.5 nm | 5.0 nm | 5.1 nm | 7.4 nm |
| Ave. Pt-Co Composition | 85% Pt:15% Co | 89% Pt:11% Co | 89% Pt:11% Co | 95% Pt:5% Co |
Starting with 5 nm instead of 2 nm implies that ECSA loss is not the main degradation mechanism for the SOA Pt-Co/HSAC alloy catalyst. Co loss also does not seem to accelerate. This is not surprising since the Co dissolution rate does not vary by orders of magnitude between 0.6 and 0.95 V. So for Co dissolution all that matters is time at high potential (>1 V) or just total testing time (at any condition).
Durability of SOA Pt-Co/HSAC catalyst during carbon corrosion AST
The durability of the SOA Pt-Co/HSAC cathode catalysts during the carbon corrosion AST was assessed via polarization curves at BOT, after 500 1.0–1.5 V cycles, and after 1000 1.0–1.5 V cycles. The MEA performance was compared using polarization curves and impedance. The polarization curves shown in Figure 10A demonstrated a significant drop in mass transport performance, particularly between 500 (blue) to 1000 (green) cycles, as indicated by the extreme drop in current density observed at the lower voltages. The impedance was measured at 0.2 A/cm2, as shown in Figure 10B. The MEA that was tested for 1000 cycles (green) exhibited significantly higher mass transport resistance (low frequency arc) than the MEA at BOT (red) and the MEA after 500 cycles (blue).
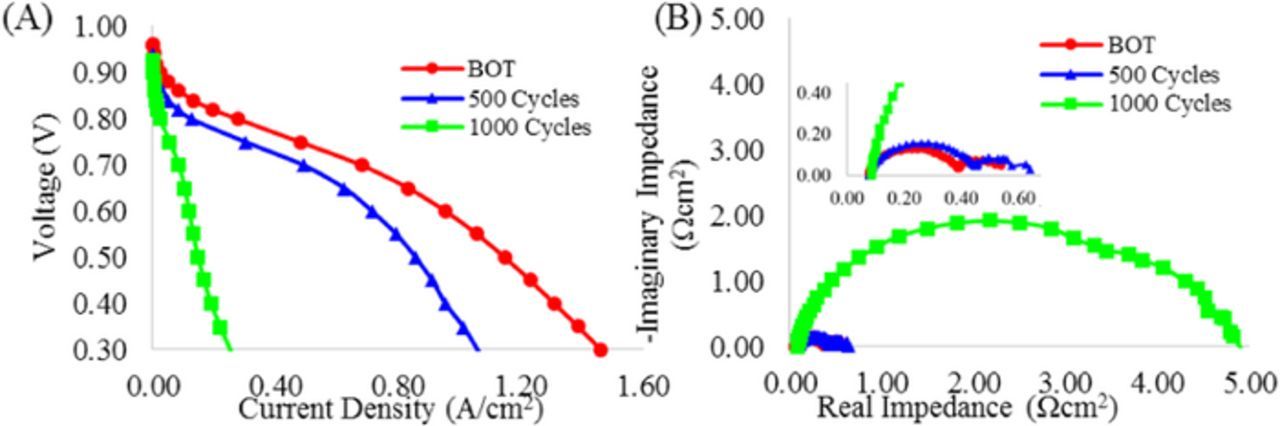
Figure 10. (A) Polarization curves for MEAs with SOA Pt-Co/HSAC in CCL at BOT, 500, and 1000 (1.0–1.5 V) cycles during carbon corrosion AST at 80°C, 100% RH, and 150 kPa H2/Air. (B) Impedance for same MEAs taken at 0.2 A/cm2, 80°C, 100% RH, and 150 kPa H2/Air.
Figure 11 shows TEM images acquired from the Pt-Co catalyst particles within the CCL of MEAs at BOT, after 500 cycles, and after 1000 cycles of carbon corrosion AST. The Pt-Co catalyst particle size did not change much (remained essentially constant ∼4.7–5 nm) during the AST, but compression/thinning of the CCL resulted in the inter-particle spacing becoming closer. The results shown in Figure 11 for ∼5 nm particle size alloy catalysts can be contrasted to a standard 2 nm Pt/C catalyst (Figure 5D) where significant Pt agglomeration and growth is observed. While Pt agglomeration of 2 nm Pt/C particles results in rapid growth to ∼5 nm during carbon corrosion AST experiments this mechanism is absent in the 5 nm Pt-Co/C catalysts.
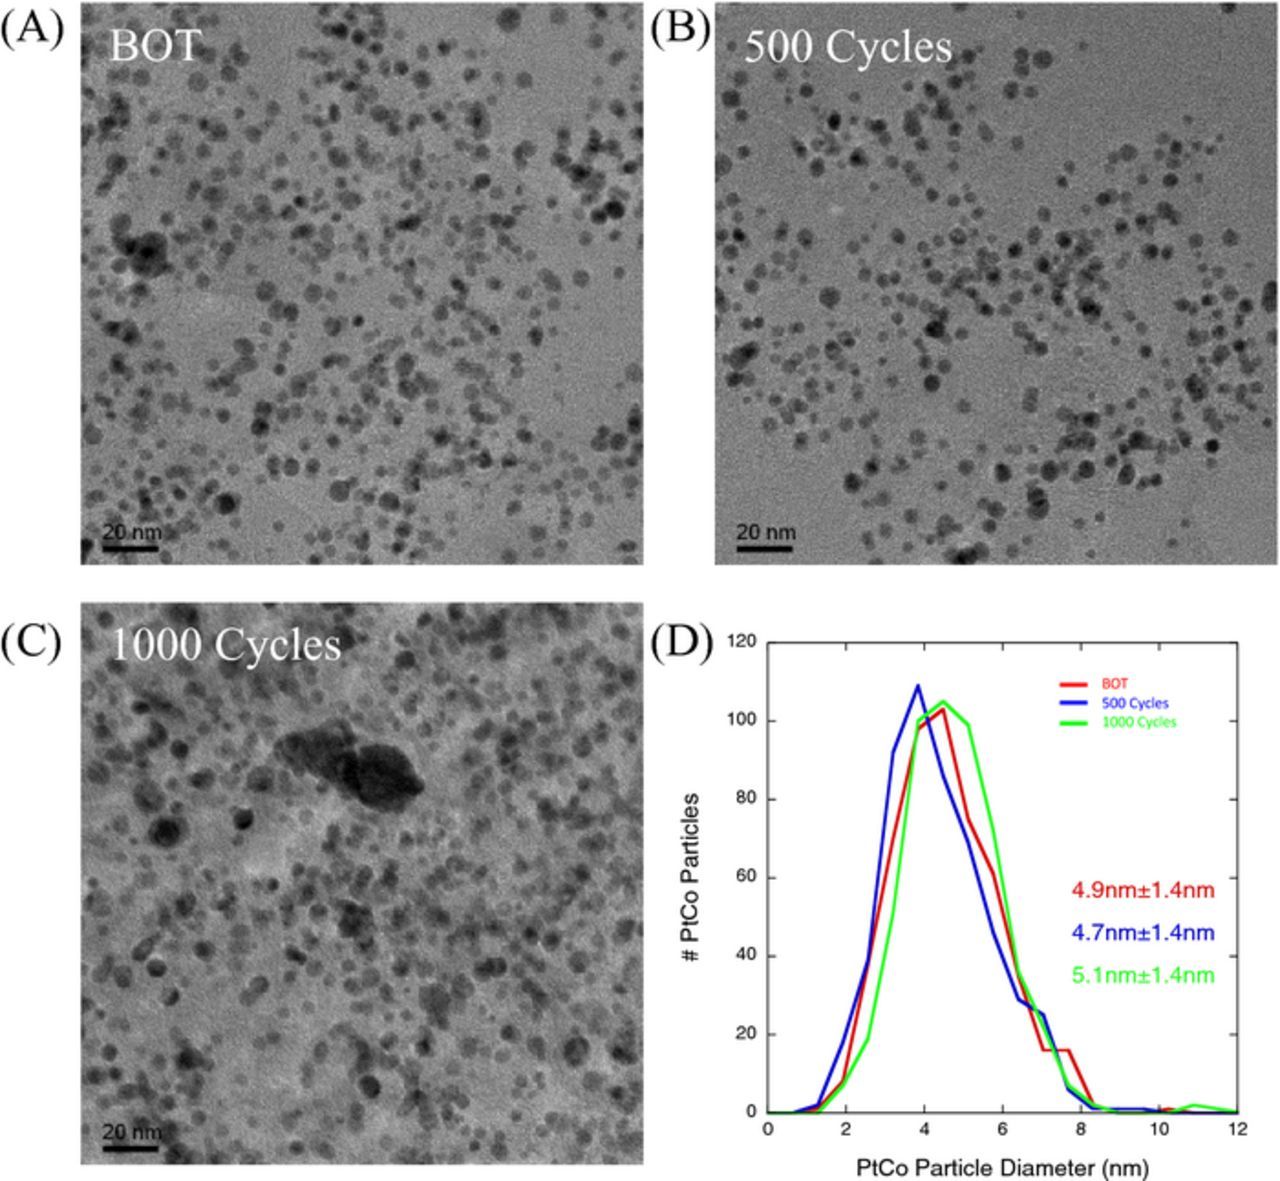
Figure 11. TEM images of the SOA Pt-Co/HSAC catalyst particle sizes: (A) BOT, (B) after 500 cycles, (C) after 1000 cycles, and (D) comparison of Pt-Co particle size distribution at each condition.
STEM-based 3D tomography was performed on all three MEAs (BOT, after 500 cycles, after 1000 cycles). Figure 12 summarizes the 3D reconstructions that show a slight increase in the particle size, in contrast to the TEM measurements (∼20% diameter increase measured, likely due to the closeness of the particles, decreased inter-particle spacing after cycling, and limitations of reconstruction software to separate the particles). EDS analyses indicated ∼15% loss of Co from the Pt-Co catalyst particles during a carbon corrosion AST cycles. Overall, the catalysts demonstrated a minimal change in the Pt-Co particle size and percentage loss of Co from the Pt-Co catalyst particles. (See data summarized in Table II.)
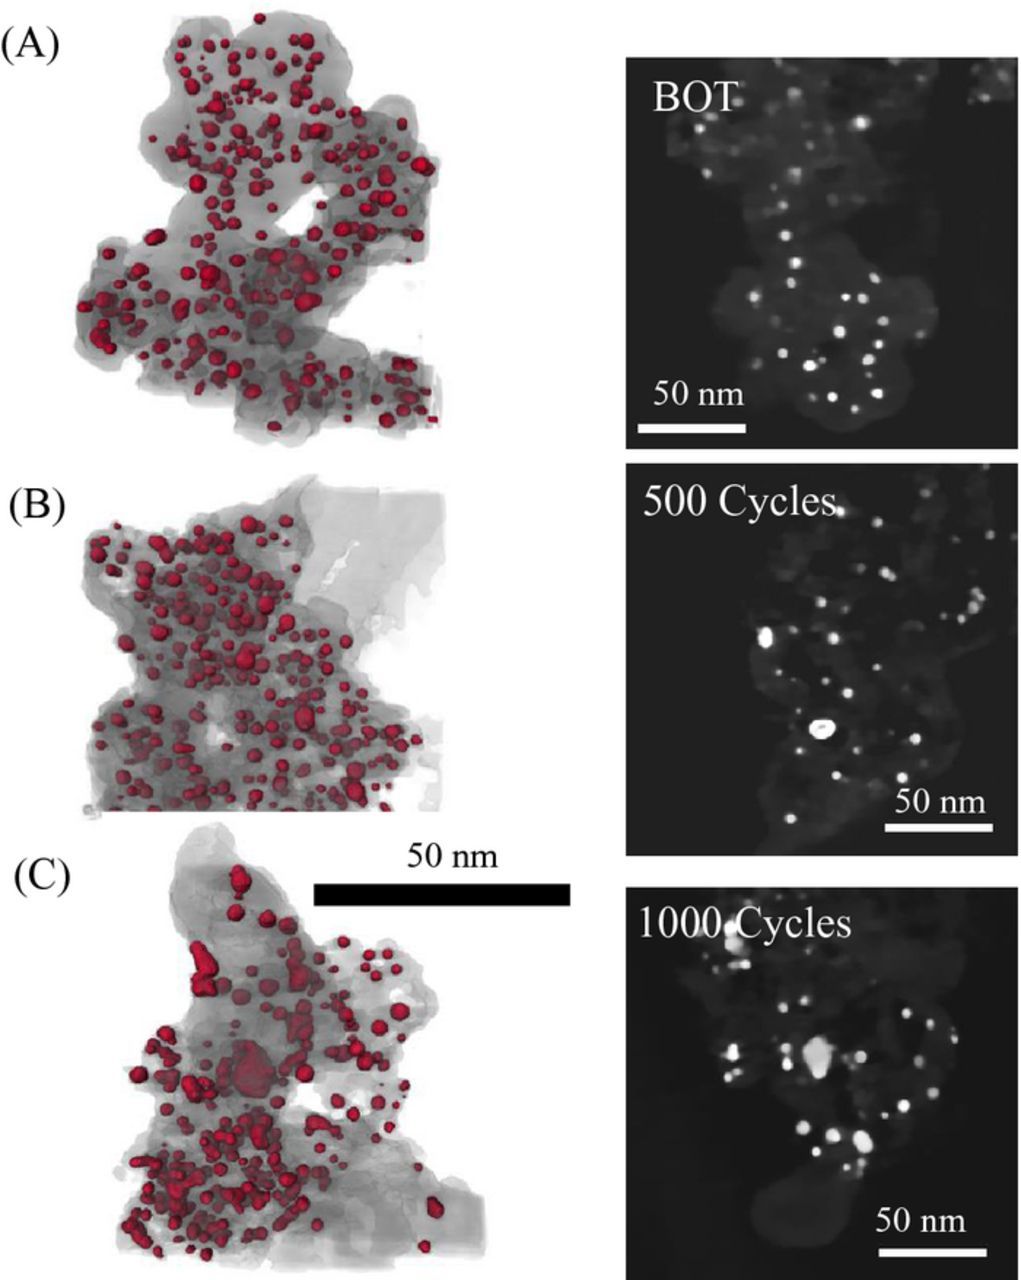
Figure 12. STEM-based tomography and single z-slices of SOA Pt-Co/HSAC catalyst: (A) BOT, (B) after 500 cycles, and (C) after 1000 cycles of carbon corrosion AST.
Table II. Summary of the average Pt-Co particle sizes and compositions of SOA Pt-Co/HSAC catalyst at BOT, after 500 cycles, and after 1000 cycles of carbon corrosion AST.
| BOT | 500 Cycles | 1000 Cycles | |
|---|---|---|---|
| Particle Size | 5.1 nm | 4.8 nm | 6.7 nm |
| Ave. Pt-Co Composition | 77% Pt:23% Co | 84% Pt:16% Co | 91% Pt:9% Co |
HAADF-STEM cross-section images were acquired at BOT and after 500 and 1000 cycles of carbon corrosion AST to determine CCL thickness changes, as shown in Figure 13. There was a small change observed in the CCL thickness between the BOT MEA (7.0 μm thick) and after 500 cycles (6.0 μm thick); however, there was a significant decrease in CCL thickness between 500 and 1000 cycles (6.0 μm to 3.0 μm, ∼50% loss). This significant thickness change was most likely due to CCL compaction, and caused the Pt-Co catalyst inter-particle spacing to decrease (Figures 11 and 12). This thickness decrease also explains the observed decrease in mass transport performance (Figure 10A) and increased resistance at highest currents reached (Figure 10B).
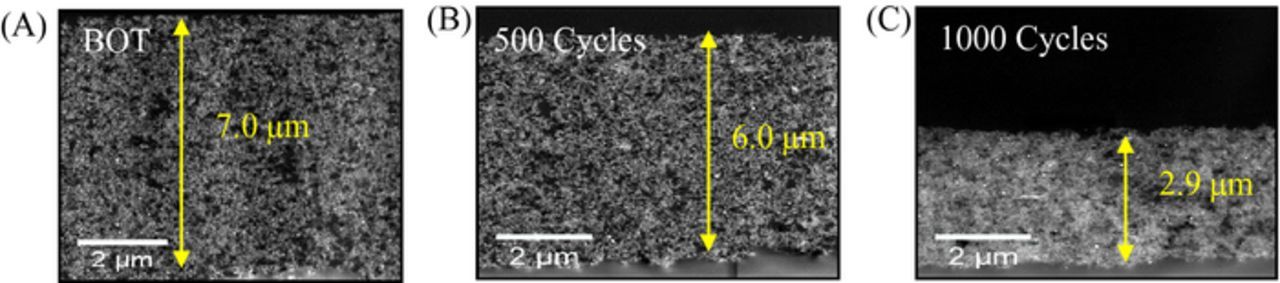
Figure 13. TEM images of SOA Pt-Co/HSAC catalyst layer thickness (A) BOT (B) after 500 cycles (C) after 1000 cycles.
Conclusions
A high flow square-wave catalyst durability AST was examined and showed a 20X time acceleration factor over previous catalyst ASTs and a 100X time acceleration factor over the modified wet drive-cycle catalyst durability protocol. However, this high flow AST showed uneven degradation compared to a low flow square-wave catalyst AST with a 5X time acceleration factor over the triangle-wave catalyst AST and a 25X time acceleration factor over the modified wet drive-cycle catalyst durability protocol. The DOE has adopted this new AST as a tool for evaluating catalyst durability. The adoption of this protocol can be found in Table P.1 of the DOE FCTO Fuel Cells 2016 Multi-Year Research, Development, and Demonstration Plan.1 Moreover these ASTs were independent of the carbon-type used in the MEA, further confirming the ability of these ASTs to evaluate the electrocatalyst independently of the support. The acceleration factors of the square-wave and triangle-wave ASTs were decreased to 10X and 2.5X respectively for the alloy catalysts. For Pt-Co alloy catalysts in the 5 nm particle size range the predominant degradation mechanism is the leaching of transition metal and not the enlargement of the particles. This result was supported by direct carbon corrosion measurements showing little evolved CO2 at the cathode outlet during the catalyst AST. When SOA Pt-Co/HSAC catalyst was subjected to a carbon corrosion AST (1.0–1.5 V cycling), the catalysts demonstrated a minimal change in the Pt-Co particle size and percentage loss of Co from the Pt-Co catalyst particles; however, a significant loss in CCL thickness was observed which resulted in large mass transport performance losses. This further confirmed that the catalyst ASTs with their minimal catalyst layer thickness loss were indeed evaluating the electrocatalyst independently of the support.
Acknowledgments
This work was funded under the Fuel Cell Performance and Durability (FC-PAD) Consortium, by the Fuel Cell Technologies Office (FCTO), Office of Energy Efficiency and Renewable Energy (EERE), U.S. Department of Energy (DOE) and Program Development Managers Dimitrios Papageorgopoulos and Greg Kleen. The authors thank GM for providing a portion of the MEAs utilized in this study. Microscopy was performed at Oak Ridge National Laboratory under contract number DE-AC02-05CH11231. It was also conducted as part of a user project at ORNL's Center for Nanophase Materials Sciences (CNMS), which is a U.S. DOE Office of Science User Facility, and used instrumentation provided by the U.S. DOE Office of Nuclear Energy, Fuel Cycle R&D Program, and the Nuclear Science User Facilities.
ORCID
Sarah Stariha 0000-0001-5657-1409
Natalia Macauley 0000-0001-5602-0092
Karren L. More 0000-0001-5223-9097
Rangachary Mukundan 0000-0002-5679-3930
Rodney L. Borup 0000-0001-7647-1624