Abstract
Lithiated ternary oxides containing nickel, cobalt, and manganese are intercalation compounds that are used as positive electrodes in high-energy lithium-ion batteries. These oxides undergo changes, when they are stored in humid air or exposed to moisture, that adversely affect their electrochemical performance. There is a new urgency to better understanding of these "weathering" mechanisms as manufacturing moves toward a more environmentally benign aqueous processing of the positive electrode. Delithiation of the oxide and the formation of lithium salts (such as hydroxides and carbonates) coating the surface, are known to occur during moisture exposure. The redox reactions which follow this delithiation are believed to trigger all the other transformations. In this article we suggest another possibility: namely, the proton – lithium exchange. We argue that this hypothesis provides a simple, comprehensive rationale for our observations, which include contraction of the c-axis (unit cell) lattice parameter, rock salt phase formation in the subsurface regions, presence of amorphous surface films, and the partial recovery of oxide capacity during electrochemical relithiation. The detrimental effects of water exposure need to be mitigated before aqueous processing of the positive electrode can find widespread adoption during cell manufacturing.
Export citation and abstract BibTeX RIS

This is an open access article distributed under the terms of the Creative Commons Attribution 4.0 License (CC BY, http://creativecommons.org/licenses/by/4.0/), which permits unrestricted reuse of the work in any medium, provided the original work is properly cited.
Improving the performance of lithium-ion batteries (LIBs) for electrically powered vehicles gives urgency to the development of high-capacity, high-voltage electrode materials, and layered Ni-rich oxides are presently among the most technological advanced materials that allow operation above +4.0 V vs Li+/Li. 1 Such materials (also known as NCMxyz materials) have the general composition of LiNix/10Coy/10Mnz/10O2, where x+y+z = 10. In these ternary oxides, the manganese stays in the Mn4+ state during cell cycling, and the capacity mainly originates from the Ni2+/Ni3+ and Ni3+/Ni4+ redox couples. The monolayers of octahedra containing transition metal (TM) ions form a structural scaffold with the layers of mobile Li+ ions placed in between. The crystalline material retains the structure of the progenitor material of the family, viz. α-LiCoO2,2 with the unit cell belonging to the rhombohedral R(-3)m space group. During electrochemical cycling, the lithium ions intercalate into (and deintercalate from) the layered crystals as the redox state of (mainly the) nickel ions changes to provide the overall charge neutrality.
In this study, we examine one such material, NCM523, which represents a particular trade-off between the cycling rate (that improves with Co content), safety (that improves with Mn content), and capacity (that increases with Ni content).1 The safety concerns mainly relate to the thermal and chemical stability, including oxidation of the organic electrolyte by catalytic centers at the oxide surface3 and phase transitions in the delithiated material that occur when a significant fraction of nickel ions is reduced to Ni2+ ions and molecular oxygen is released. As a result of this transition (that occurs mainly near the active surface) the layered R(-)3m phase gradually transforms to a disordered spinel phase (whose unit cell belongs to the Fd(-)3m space group) and finally to a partially-lithiated NiO rock salt phase (belonging to the Fm(-)3m space group). As oxide composition changes,4 microscopic cracks evolve through and between the crystallite grains resulting in rising impedance.5,6 There is vast literature detailing these well-known transformations (see, e.g. Ref. 6–10) and mitigation of these effects is critical to improving the performance and durability of LIBs.
Electrochemical extraction is not the only mechanism for oxide delithiation: exposure to liquid water,11,12 moist air13–20 and carbon dioxide gas21,22 during synthesis and/or storage of the NCM material under the ambient conditions also causes loss of lithium ions. In air and CO2, the formation of lithium (bi)carbonate and hydroxide coatings on oxide surfaces has been reported. At advanced stages of weathering, this coating (that can grow to be > 10 nm thick)14 can be observed using electron microscopy, X-ray powder diffraction (XRD)16,17,20–22 and infrared spectroscopy.14,15 As the material delithiates, repulsion between the oxygen layers increases and the lattice expands along the crystallographic c axis (that is orthogonal to the TM-O planes).13–18,23 In some studies, in addition to the XRD pattern of the parent material, poorly resolved Bragg peaks from a cubic phase were observed, which was attributed either to LiNi2O4 spinel13,14 or (possibly, lithiated) NiO rock salt.22
These chemical transformations in (and on) the oxide have been attributed24 to a combination of redox and cation exchange processes. In particular, there is abundant literature on H+/Li+ ion exchange in closely related materials, such as α-LiAlO2,25 Li2MnO3,26 and LiMn2O4.27 The outward migration of Li+ ions and the inward migration of protons into the oxide bulk would drive equilibrium Reactions 1 and 2 to the right side, and facilitate Reaction 3.
![Equation ([1])](https://content.cld.iop.org/journals/1945-7111/164/7/A1489/revision1/d0001.gif)
![Equation ([2])](https://content.cld.iop.org/journals/1945-7111/164/7/A1489/revision1/d0002.gif)
![Equation ([3])](https://content.cld.iop.org/journals/1945-7111/164/7/A1489/revision1/d0003.gif)
Moshtev et al.12 suggested a reaction of NCM materials with water without Ni3+ ions changing their oxidation state to yield a lithiated analog of nickel (III) oxide hydroxide (NiOOH).28 Most authors, however, suggest that such cation exchange plays a minor role if any at all, favoring instead a redox process that is fully analogous to the one occurring in electrochemical delithiation. In this favored scenario, both Li+ cations and oxygen atoms (referred to as "active oxygen species")16,17 migrate toward the surface and combine with water and CO2 to yield LiOH, LiHCO3, and Li2CO3, while Ni3+ ions are reduced to Ni2+. The presence of Ni2+ at the surface is hinted by changes in the shape of Ni 2p3/2 absorption band against the Ni3+ background as observed in X-ray photoemission spectra (XPS).13,16 However, insufficient spectral resolution makes this attribution somewhat uncertain.
In recent years there has been a shift to processing of electrodes using aqueous slurries containing water-based polymer binders. Such processing is particularly common for silicon and silicon-graphite electrodes, as the traditional fluoropolymer binders are inadequate to accommodate the contraction/expansion cycles during the lithiation/delithiation process; the traditional binders also poorly adhere to the hydrophilic, silica-covered active particles (see, e.g., Refs. 29–35). Such processing exposes the materials to moisture, resulting in numerous complications36–38 associated with the hydrolysis of lithium salts39–43 and of the carbonate solvents.44,45 Introduction of moisture, and electrochemical or chemical generation of corrosive acids near the positive electrodes, are a particular concern for oxide materials cycled at voltages >4.5 V vs Li/Li+. Other technological drivers that necessitate reliance on aqueous processing include the use of electrophoretic methods46 and the application of protective coatings.47,48 The latter frequently involve using aqueous solutions47 or water vapor as a reagent during atomic layer deposition.48 All these methods expose the layered oxides to gaseous and/or liquid water, which can potentially have adverse effect on cell operation. The formation of lithium carbonate coatings during improper storage can, in principle, be mitigated by washing the affected oxide in water12 or alcohol13 or thermal treatment of the oxide at > 700°C to decompose the lithium carbonate.49 However, these methods cannot be used to reverse chemical changes in already-assembled electrodes because of possible damage to the carbon and binder components.
These concerns prompted us to reinvestigate moisture-driven weathering of NCM oxide materials, which are being examined for high-energy high-voltage LIBs.5 High-resolution X-ray diffraction (XRD) data on oxide samples were obtained at the Advanced Photon Source located at Argonne. These data were complemented by results from X-ray photoelectron spectroscopy, electron microscopy, and electrochemical measurements. Our data strongly suggest that H+/Li+ cation exchange occurs when the oxide is exposed to moist air, and that the resulting changes can be partially reversed by electrochemical relithiation of the oxide.
The supporting schemes, tables, and figures are placed in the Supporting Information (SI). When referenced in the text, these materials have the designator "S", as in Figure S1.
Experimental
Sample descriptions and electrochemical studies
Pristine samples of NCM523 were used to prepare electrodes (E1 in Table I) containing a coating of 90 wt% oxide (Toda America), 5 wt% Super C45 carbon black (Timcal) and 5 wt% PVdF (polyvinylidene difluoride, Solef 5130, Solvay) on a 20 μm thick aluminum foil.5 The electrodes were exposed to moist air (100% humidity) in a sealed container at 30°C, for one and two months (samples E2 and E3, respectively, in Table I). The 100% humidity was achieved by including an open container of water in the sealed chamber; water droplets formed on the electrode samples during the exposure. For comparison, electrodes were also sealed in a container that did not include an open container of water; sample E5 (in Table I) is a representative from this "room air" experiment after two month exposure. After the (moist air or room air) exposure, all samples were dried in a vacuum oven at 120°C for 24 h. Half cells were assembled from these electrodes (1.6 cm2 area) using lithium foil as the counter electrode and an electrolyte solution (Gen 2) with 1.2 M lithium hexafluorophosphate (LiPF6) in a 3:7 w/w liquid mixture of ethylene carbonate (EC) and ethylmethyl carbonate (EMC). All electrochemical measurements were performed using sealed 2032-type stainless steel coin cells, housed in a constant temperature chamber at 30°C and cycled between 3.0 and 4.5 V. Sample E4 is the electrochemically-relithiated electrode E3 after four 3–4.5 V cycles.
Table I. First-cycle Electrochemistry Data vs Moist Air Exposure:a Specific Oxide Capacities and Voltages for Extraction/Insertion of Li+ Ions.
| Sample (Cell) | Exposure, month | Capacity,b mAh/g | Capacity,c mAh/g | Coulombic efficiency, % | voltage,b V vs Li+/Li | Voltage,c V vs Li+/Li |
|---|---|---|---|---|---|---|
| E1 | 0 | 219 | 198 | 90.4 | 3.68 | 4.48 |
| E2 | 1 | 191 | 166 | 86.9 | 4.12 | 4.43 |
| E3 | 2 | 179 | 155 | 86.6 | 4.26 | 4.30 |
| E5d | 2 | 208 | 187 | 89.9 | 3.73 | 4.47 |
a3-4.5 V, 30°C. bCharging cycle. cDischarging cycle. dRoom air exposure.
Powder X-ray diffraction
The XRD patterns were obtained at ambient temperature using monochromatic synchrotron radiation with an average wavelength of λ = 0.459268 Å at beam line 11-BM of Argonne's Advanced Photon Source. The electrodes were scraped off the current collector and loaded into sealed vials for examination.50 Peak positions in the acquired data were analyzed using the CMPR suite by fitting the peaks to prescribed line shapes51 and the unit cell was indexed using the TREOR program.52 The lists of the fitted Bragg peaks and the inferred Miller indexes are given in Tables S1 and S2 of the Supporting Information. The elucidated cell parameters for the bulk material are given in Table II. Powder spectra were calculated from the reported crystallographic data using Mercury (Version 3.6, CCDC) software.
Table II. Unit cell parameters determined for lattices in the hexagonal notation.
| Sample | a = b, Å | ±δa, 10−5 Å | c, Å | ±δc, 10−4 Å | Cell Volume, Å3 | Δa, 10−4 Å | Δa/a,a % | Δc, 10−3 Å | Δc/c,a % |
|---|---|---|---|---|---|---|---|---|---|
| E1 | 2.871083 | 4.6 | 14.250426 | 3.5 | 101.73 | 0.0 | 0.000 | 0.0 | 0.000 |
| E5 | 2.871150 | 5.3 | 14.248814 | 5.1 | 101.72 | 0. 7 | 0.002 | −1.6 | −0.011 |
| E3 | 2.871822 | 11.1 | 14.242456 | 6.9 | 101.73 | 7.4 | 0.026 | −8.0 | −0.056 |
| E4 | 2.870173 | 2.6 | 14.255882 | 2.2 | 101.70 | −9.1 | −0.032 | 5.4 | 0.038 |
aRelative to the pristine sample (E1); α = β = 90°, γ = 120°.
X-ray photoelectron spectroscopy
X-ray photoelectron spectroscopy (XPS) data were obtained on electrode samples with a Kratos Axis Ultra X-ray photoelectron spectrometer under ultrahigh vacuum (10−9 Torr) conditions and with monochromatic Al Kα (1486.6 eV) radiation as the primary excitation source.6 Peak fits of all spectra were performed using the Shirley background correction and Gaussian-Lorentzian curve synthesis. The energy scale was adjusted based on the 285.0 eV peak in the C 1s spectra, which arises from the Super C45 carbon black in the oxide electrodes.
Electron microscopy
All scanning transmission electron microscopy (STEM) images were obtained using a JEOL JEM-ARM200CF microscope operated at 200 kV at the University of Illinois - Chicago.53 STEM images were collected in three modes: low angle annular dark field (LAADF) imaging, high angle annular dark field (HAADF) imaging, and annular bright field (ABF) imaging. The HAADF (Z-contrast imaging) mode provides images of the higher atomic number (Z) transition metal elements, whereas the ABF mode provides images of elements with low Z, including lithium. The LAADF mode excels in imaging columns of atoms with intermediate Z; images obtained in this mode are also more sensitive to strain contrast. In order to minimize artifacts of sample preparation (that can inadvertently induce strain in the material), only minimal preparation was carried out: specifically, the oxide samples were dispersed into either isopropyl alcohol or acetone, then dried before transfer to a holey carbon TEM grid. We were able to acquire high-quality data on the pristine sample E1. The moisture-exposed oxides (E3, for example) were harder to examine because the samples displayed significant sensitivity to the electron beam, which hampered our ability to collect detailed diffraction and spectroscopy data to complement the imaging results.
Computational methods
The PM7 method54,55 from MOPAC2016 suite56,57 was used in the semi-empirical calculations on proton exchange in α-LiCoO2 and (L)BFGS method was used for geometry optimization. PM7 is the latest implementation of the MNDO/NNDO family of semi-empirical methods that are specially designed for solid and crystalline materials and tested extensively on molecular and ionic solids.54,55 The motivation for using this approximate method was that the standard density functional methods with Hubbard-U correlations (DFT+U)58,59 were too time consuming for modeling of a dilute solid solutions; there is also great uncertainty as to what extent the "+U" term can mitigate self-interaction errors in such systems.60 To estimate the structural changes due to the cation exchange, a 2 × 2 × 2 supercell (Z = 24 molecules) was generated from the known crystal structure and optimized. This supercell contained six layers of four Li+ ions. To study H+/Li+ substitution, only one of the Li+ ions in any given layer was replaced with the proton, so that the cell contained NH = 1-6 protons. The optimized supercells were compared with the pristine supercell to evaluate changes in the lattice parameters.
Results
Electrochemical measurements
All potentials described below are given vs Li/Li+. In Figure 1 we compare the first cycle capacity-voltage profiles, from half cells assembled using the pristine electrode (E1) and two humid-air exposed electrodes (E2 and E3), obtained with a ∼11 mA/g (∼C/18) current at 30°C. A brief summary of the electrochemistry data is given in Table I; the specific charge and discharge cell capacities are given per weight of the dry oxide material (mAh/goxide). The pristine electrode shows the expected cycling behavior. On charge, the cell voltage rises sharply to 3.68 V reflecting the difficulty of extracting the initial Li+ ions from the pristine oxide. Cell capacity then increases gradually with voltage, reaching 219 mAh/goxide at 4.50 V. On discharge, the cell voltage decreases rapidly from 4.50 V to 4.48 V before decreasing gradually with capacity until the voltage reaches 3.60 V, then decreases sharply delivering 198 mAh/goxide at a voltage of 3.0 V. The sharp drop at 3.6 V reflects the difficulty of inserting Li+ ions into an "almost full" layered oxide; previous work has shown that the discharge capacity can be increased by using an extremely slow current or by discharging the cell to lower voltages, such as ∼2.0 V.61,62
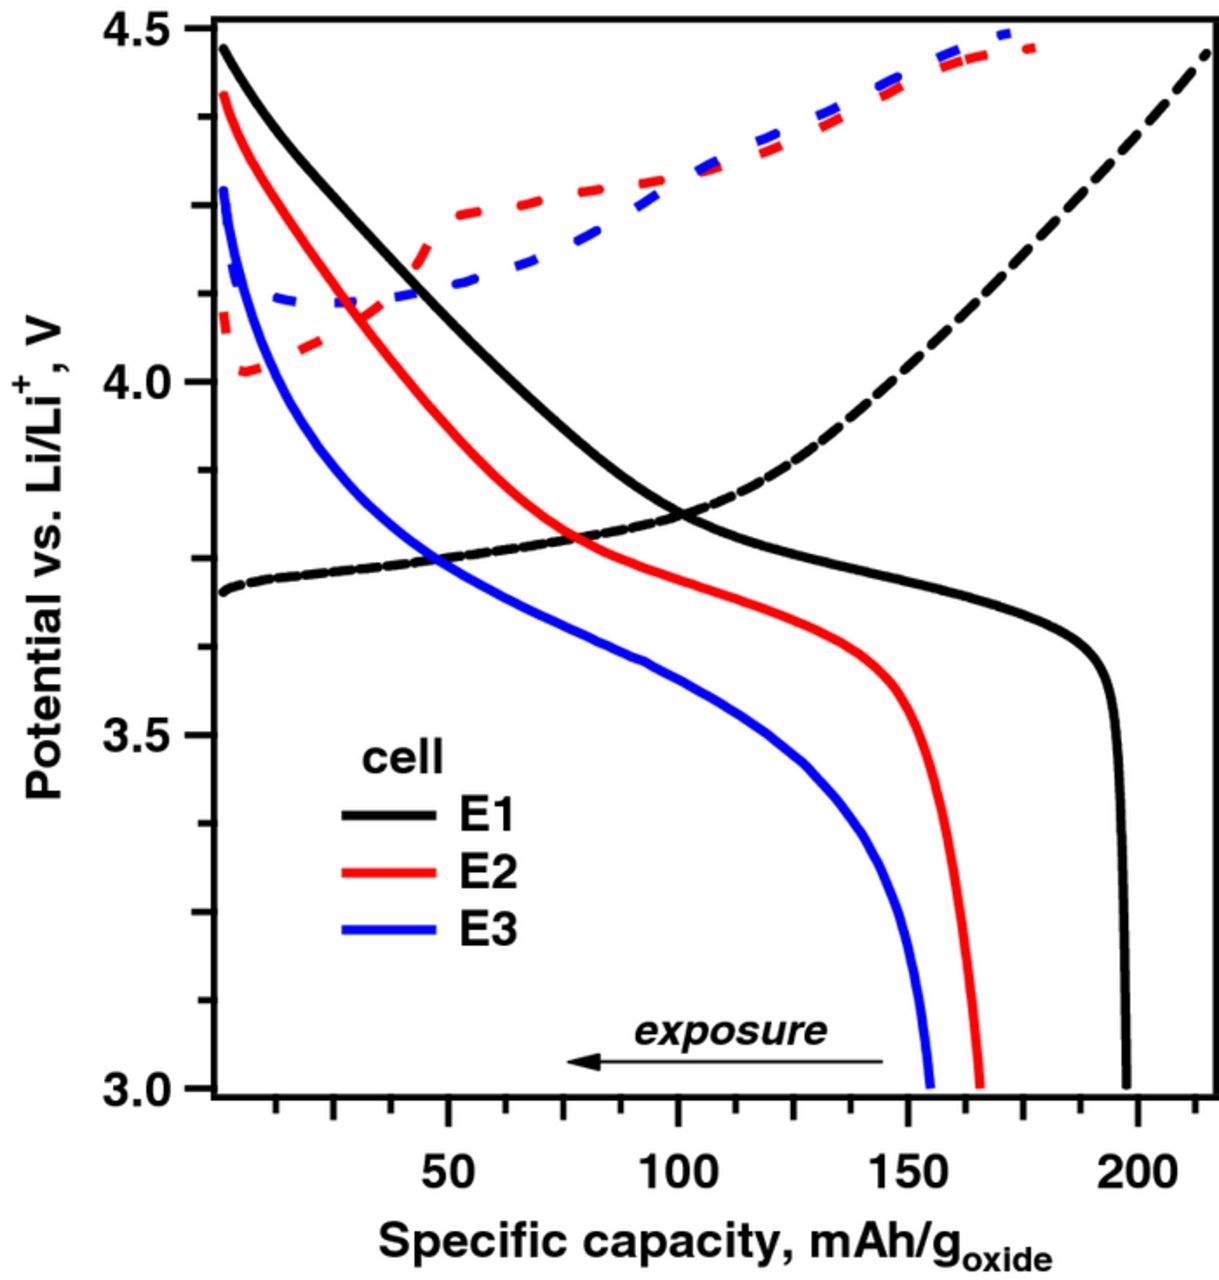
Figure 1. Cell voltage (vs Li/Li+) versus specific capacity plot for the first charge (dashed lines) and discharge (solid lines) cycle of NCM523/Li cells fabricated using electrode samples E1, E2 and E3, as indicated in the plot. The cells were cycled with a ∼11 mA/g current, in the 3–4.5 V range, at 30°C.
Cells with electrode samples E2 and E3 show behaviors that are distinctly different from that of the pristine electrode cell. For electrode E2 on charge, cell voltage initially increases to 4.12 V before dipping to ∼4.02 V vs Li/Li+, then increases again with capacity, delivering 191 mAh/goxide at a voltage of 4.5 V vs Li. For electrode E3 on charge, cell voltage rises even higher to 4.26 V before dipping to ∼4.11 V then increases with capacity delivering 179 mAh/goxide at a voltage of 4.5 V vs Li. The charge profiles of both E2 and E3 indicate significant changes to the electrodes on exposure to humid air. The increased voltages for initial extraction of Li+ ions, 0.44 V for E2 and 0.58 V for E3 relative to that of the pristine electrode, indicate the presence of species at the oxide particle surfaces that impedes the motion of Li+ ions: the following drop in voltage suggests the establishment of a Li+ ion conduction pathway that reduces impedance at the particle surface. The lower charge capacities, and the uneven rise in voltage on further removal of Li+ ions, suggest modifications to the oxide bulk.
On discharge the cell voltage of E2 abruptly decreases from 4.50 V to 4.43 V, whereas that of E3 decreases from 4.50 V to 4.3 V, again indicating oxide impedance. Both E2 and E3 show gradual declines in voltage to 3.0 V vs Li, delivering 166 mAh/goxide and 155 mAh/goxide respectively, which are ∼84% and ∼78% that of the E1 cell capacity (Table I). Furthermore, neither E2 or E3 profiles show the sharp drop in voltage below 3.6 V seen for E1; the discharge profiles display a gradual curvature with E2 and E3 showing an additional 25 mAh/goxide and 58 mAh/goxide below 3.6 V, respectively.
Table I also shows data from sample E5, which is the electrode exposed to room air for two months. The first cycle charge and discharge capacities for E5 are 208 mAh/goxide and 187 mAh/goxide respectively, which are ∼95% and ∼94% that of the E1 cell capacities, and indicates that electrode performance degrades (albeit to a smaller extent) on exposure to room air. The E5 capacity values are, however, significantly higher than those of sample E3 (Table I), indicating that higher-humidity environments have a far greater detrimental effect on electrode performance.
On further cycling, both E2 and E3 show modifications to their voltage profiles, increased charge and discharge capacities, and higher coulombic efficiencies. For E3, on the fourth cycle, the charge capacity, discharge capacity, and Coulombic efficiency are 175 mAh/goxide, 173 mAh/goxide and 99%, respectively (see inset table in Figure 2); similar values are obtained for cell E2 (see Figure S1 in SI). These data suggest that the moisture-induced capacity loss of the oxide is partially reversible upon relithiation. This electrochemical cycling behavior can be interpreted as possible evidence for the H+/Li+ cation exchange during weathering of the NCM oxides that is reversed by the electrochemical stripping of protons and reintercalation of the lithium ions.
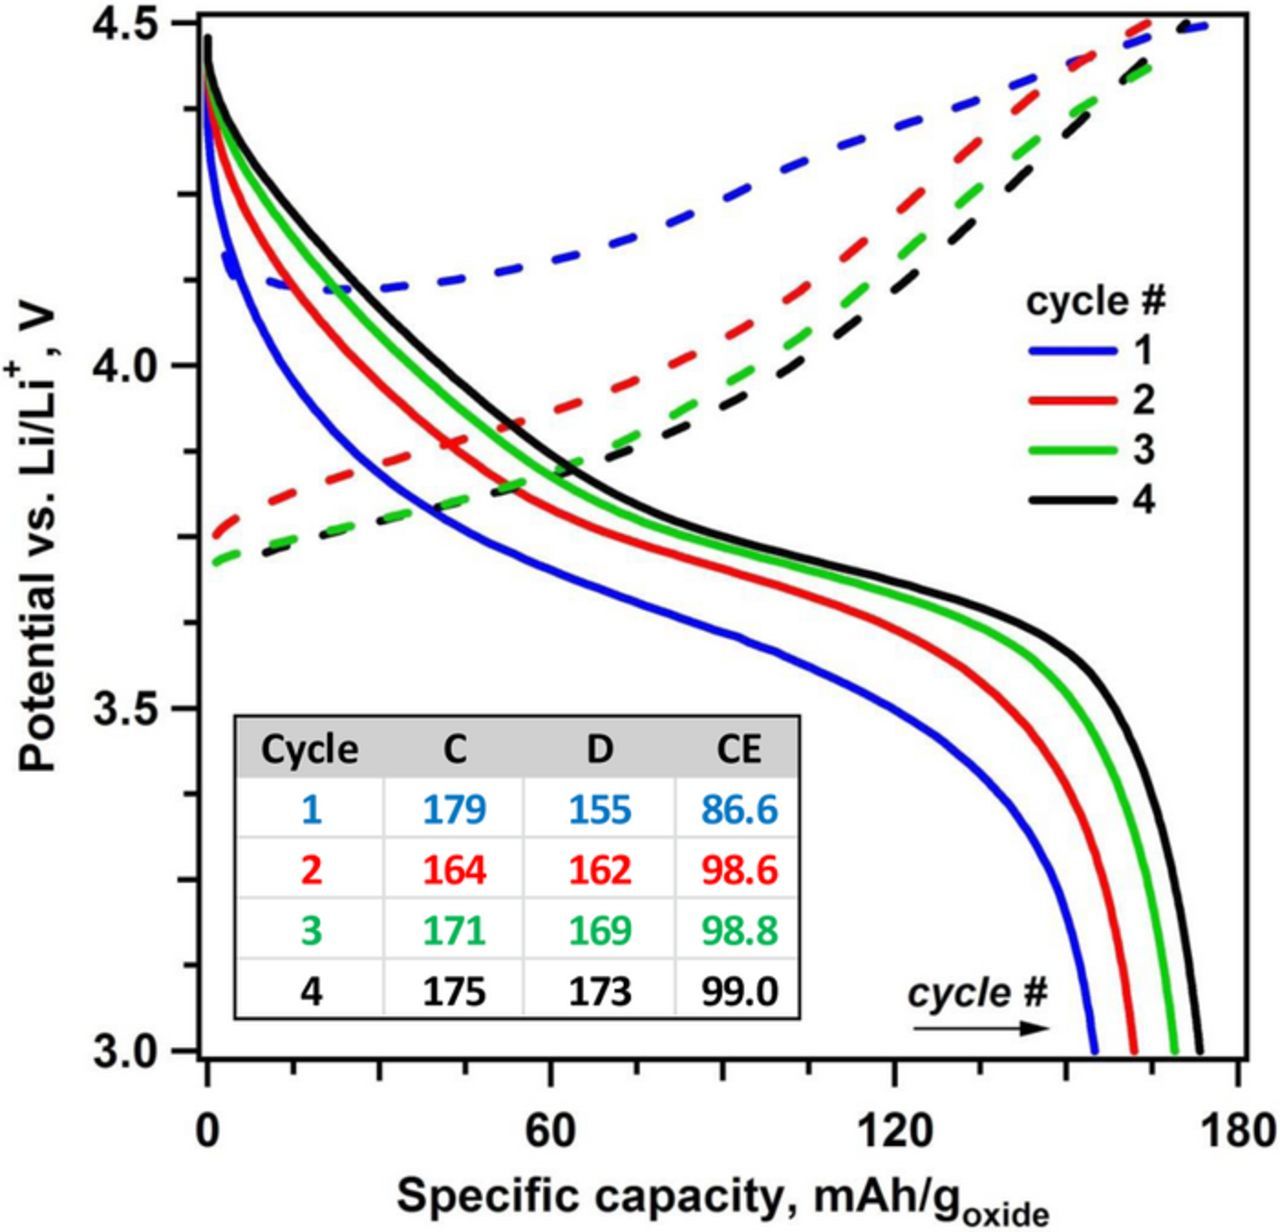
Figure 2. As in Figure 1, for the first four cycles of cell E3 (see legend for color coding of the cycles). Dashed lines are for the charge cycle and solid lines are for the discharge cycle. Also shown is a table giving the charge (C) and discharge (D) specific capacities (in mAh/goxide) and Coulombic efficiency (CE, %) of each cycle. The electrode material harvested from this cell after the fourth discharge cycle was analyzed as sample E4.
X-ray photoelectron spectroscopy (XPS)
XPS is a surface sensitive technique that provides information on the chemical and electronic state of elements contained in a material. The XPS spectra in Figure 3 were obtained by measuring the kinetic energy and number of electrons escaping from the electrode surface (typically < 5 nm) during irradiation of samples with monochromatic Al Kα X-rays. The various spectra discussed below are from electrodes E1 and E2.
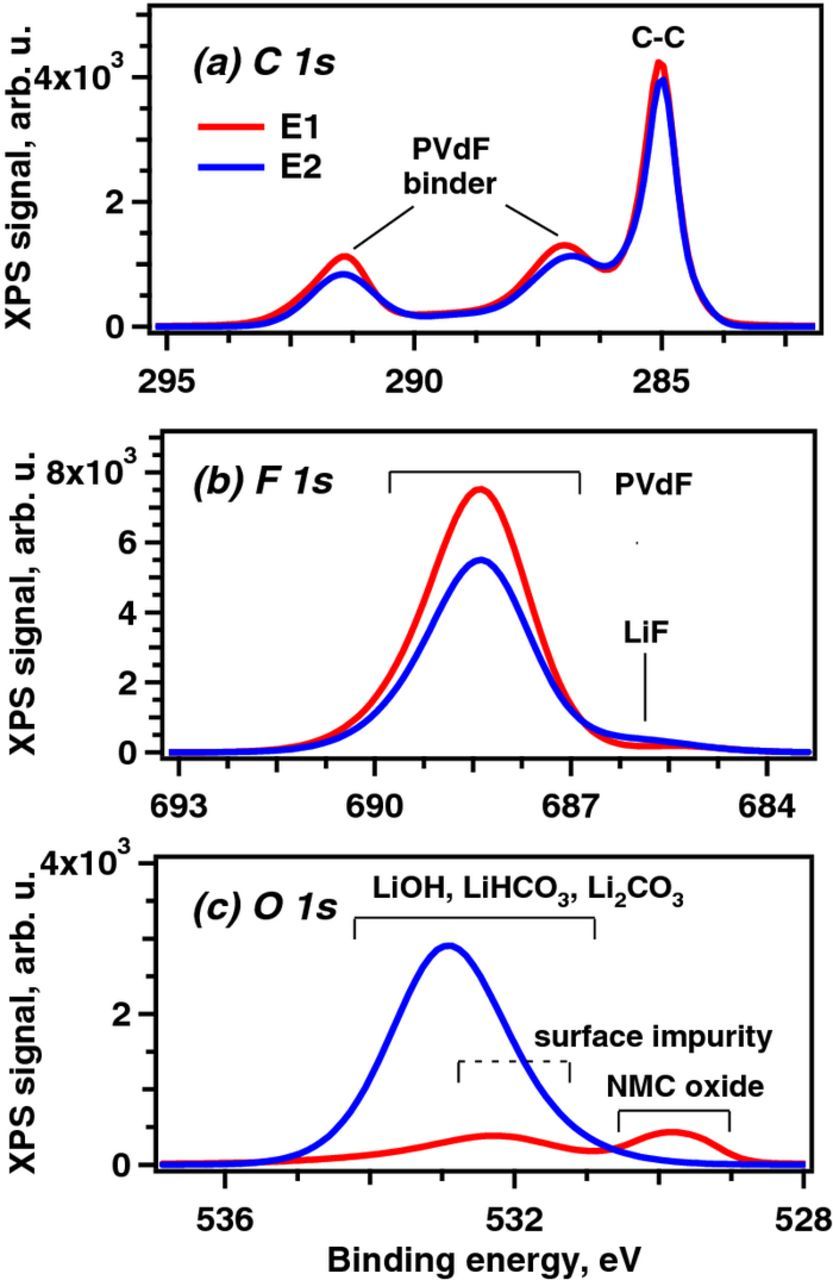
Figure 3. Background corrected X-ray photoelectron spectra in the (a) C 1s, (b) F 1s, and (c) O 1s regions obtained from pristine electrode sample E1 and weathered electrode sample E2.
For E1 the C 1s spectrum (Figure 3a) contains contributions mainly from the C45 carbons (285.0 eV) and PVdF [-(CH2CF2)n] binder (286.3 eV, 291.0 eV); weaker intensities, centered near 289.5 eV, result from carbonate impurities on the oxide particles. For E2, the spectral intensities for both C45 carbons and PVdF are lower than those of E1; the PVdF intensity decrease is also observed in the F 1s spectrum (Figure 3b). Additionally in the latter spectrum, a small intensity increase centered at 686.0 eV indicates the presence of lithium fluoride. Alkaline species, produced by the humid-air exposure, could catalyze dehydrofluorination reactions in the PVdF generating HF that would react with the NCM523 (or Li2CO3) to form this LiF.6
The most significant differences between E1 and E2 are seen in the O 1s spectra (Figure 3c). For E1, the peak centered at 529.8 eV arises from O2− anions in NCM523. Another broad peak centered at 532.3 eV can be assigned to surface impurities, including Li2CO3, which is known to form on similar layered oxides.20,63 For E2, the 529.8 eV is notably absent indicating that the photoelectrons emitted from the oxide are unable to escape the sample because of a surface film that is > 5 nm thick. This surface film, seen as a broad peak centered at 533 eV, likely contains multiple compounds, including the alkaline species mentioned earlier. Changes were also seen in XPS data obtained in the 46–72 eV range, which includes signals from Li 1s, Mn 3p, Ni 3p, and Co 3p (see Figure S2 in SI). Although the signal-to-noise ratio in this binding energy range is generally low, it is apparent that the TM (Mn, Ni, Co) signal intensities are lower for the humid-air exposed sample (E2), indicating coverage of the oxide particles by surface films. In contrast, the Li 1s intensity is slightly greater, and the peak shows a blueshift, indicating lithium presence in the surface films.
Electron microscopy
The NCM523 oxide has a granular morphology with 6–20 μm size secondary particles consisting of dozens of sintered submicron primary particle crystallites. Even in the pristine oxide, certain Li+ ions are replaced by TM ions close to the surface resulting in a modified crystal structure near the edges. In electrochemically cycled samples, this modified surface layer grows inward toward the bulk as the material loses oxygen.1,7,64
Figures 4 and 5 show images from sample E3 which was exposed to humid air but not cycled. A striking feature in the images is the directionality of chemical damage. To demonstrate this directionality, a primary particle (located on the periphery of a secondary particle) was chosen for examination, and three regions were imaged: the basal plane facets (Figure 4a), the particle bulk (Figure 4b), and the edge facets (Figure 5). As seen in Figure 4a, there is a thin amorphous coating on the surface, which we interpret as the Li2CO3 (or LiHCO3) suggested by the XPS data. The layered structure of the rhombohedral phase is preserved almost all the way to the boundary with this amorphous coating. Additionally, there is significant strain accumulation in a very thin region of the layered structure adjacent to the amorphous coating (bright LAADF contrast and dark ABF contrast in Figures 4a), whereas the bulk is (in comparison) strain-free (Figure 4b). The particle edges (Figure 5) show the most surface reconstruction, which is as expected because Li+ ion diffusion is most facile in such regions. The subsurface regions showed the presence of a new phase (Figures 5, panels a-c) that extended 5–20 nm into the bulk. Similar surface reconstructions were also observed in less-ordered crystallites (see Figure S3 in SI). We will continue our examination of these STEM features in the Discussion.
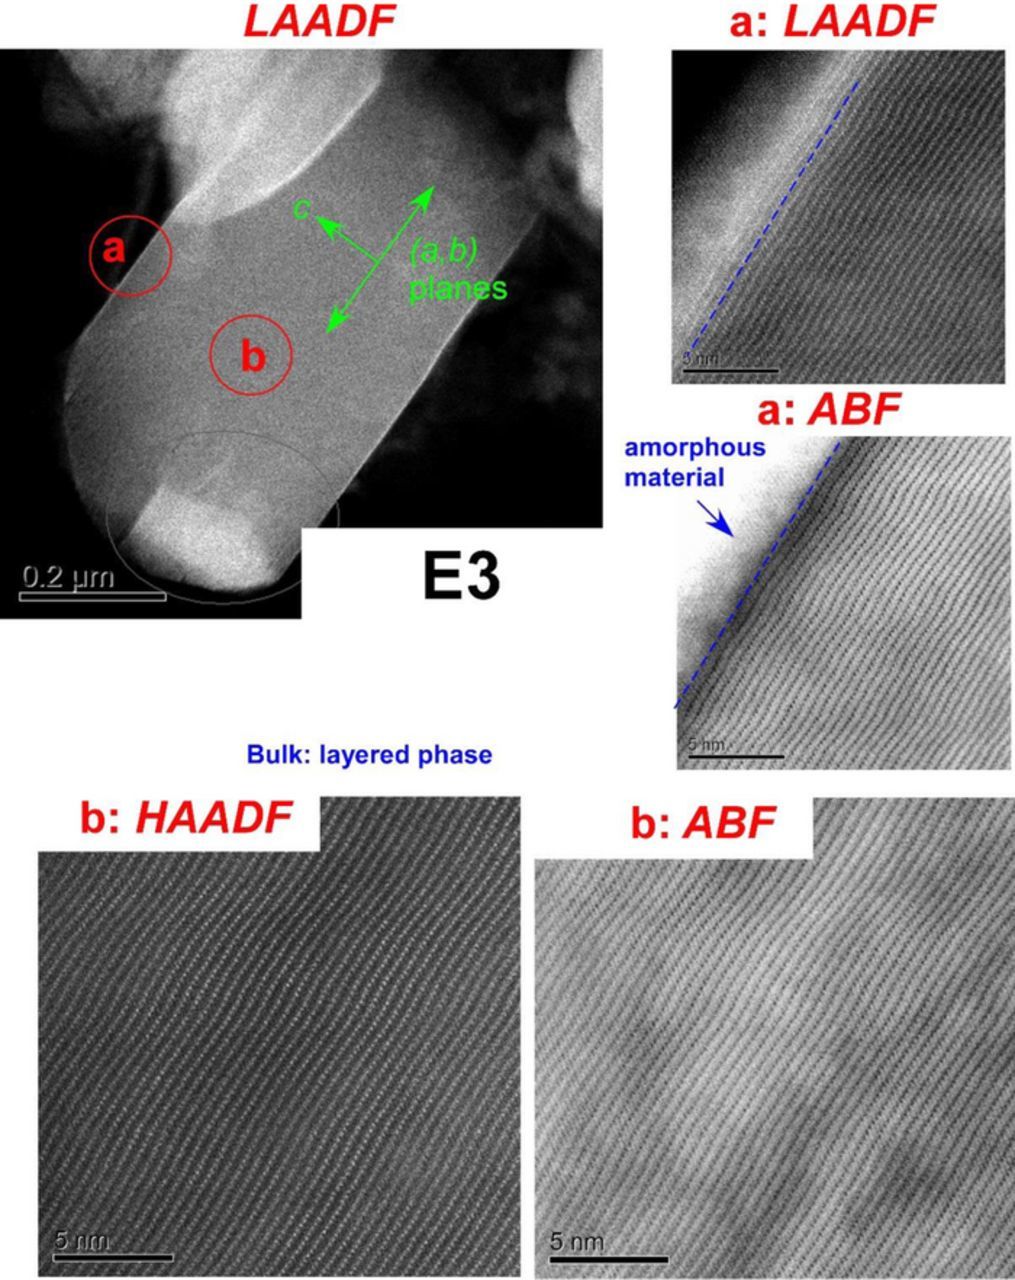
Figure 4. STEM images of a primary particle from sample E3 with the crystallographic axes indicated in green. In the top left the lower magnification image, acquired in the LAADF mode, contains regions marked (a) and (b). Higher magnification images of these near-surface (a) and bulk (b) regions are as indicated in the panels (5 nm scale bars added). The basal planes, seen in (a), are coated with a thin layer (∼2–5 nm) of an amorphous material; significant strain is observed in the layered structure adjacent to this amorphous coating. In comparison, the particle bulk (b) is relatively strain-free.
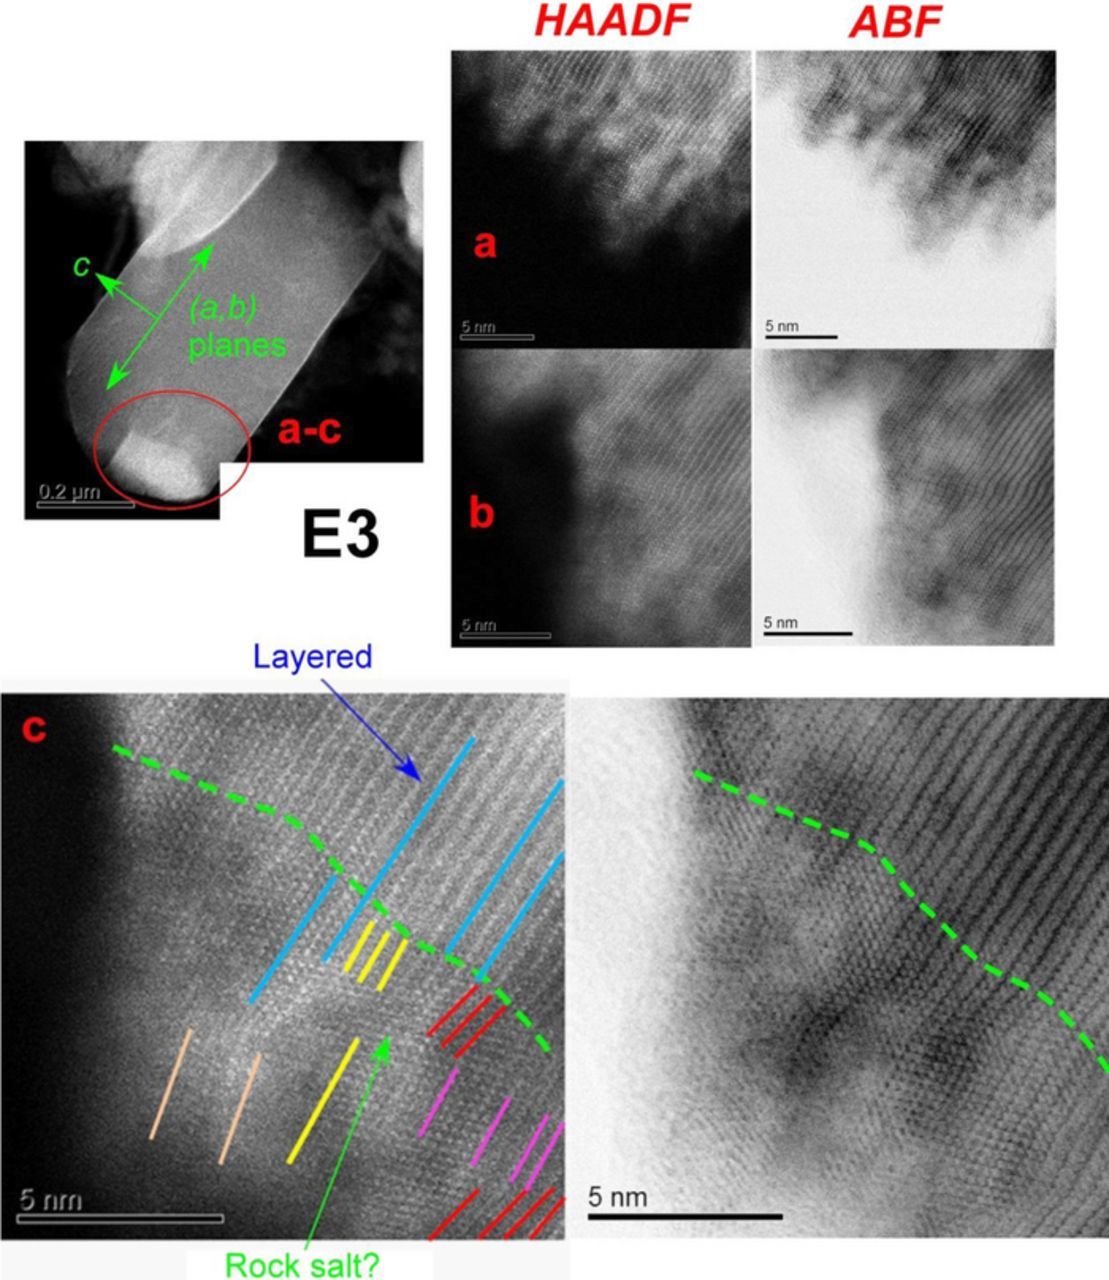
Figure 5. The same primary particle as in Figure 4, with the edge regions examined (as indicated in the upper left panel). (a, b) HAADF images are shown on the left, ABF images are on the right. In addition to the amorphous coating, there is also extensive modification of the subsurface regions that expands 5–20 nm into the particle. (c) So many TM ions occupy Li+ sites in these subsurface regions that they can be classified as a highly disordered cubic (rock salt) phase. Same color lines are parallel to each other; they were drawn over a particular lattice fringe and then translated to mark parallel fringes elsewhere. There are several regions where the lattice fringes kink, which is consistent with "bent" lattice planes in axiotaxial registry. The matched lattice spacing is perpendicular to the image plane.
X-ray diffraction analysis
Diffraction patterns (entire 2θ range) obtained from samples E1, E3, E4 and E5 are provided in Figure S4 in the SI: as noted earlier sample E4 is the electrochemically-relithiated E3 after four 3–4.5 V cycles, and E5 is the two-month room air exposed sample. Detailed views of specific 2θ ranges are contained in Figures 6 through 8. Our XRD findings can be summarized as follows.
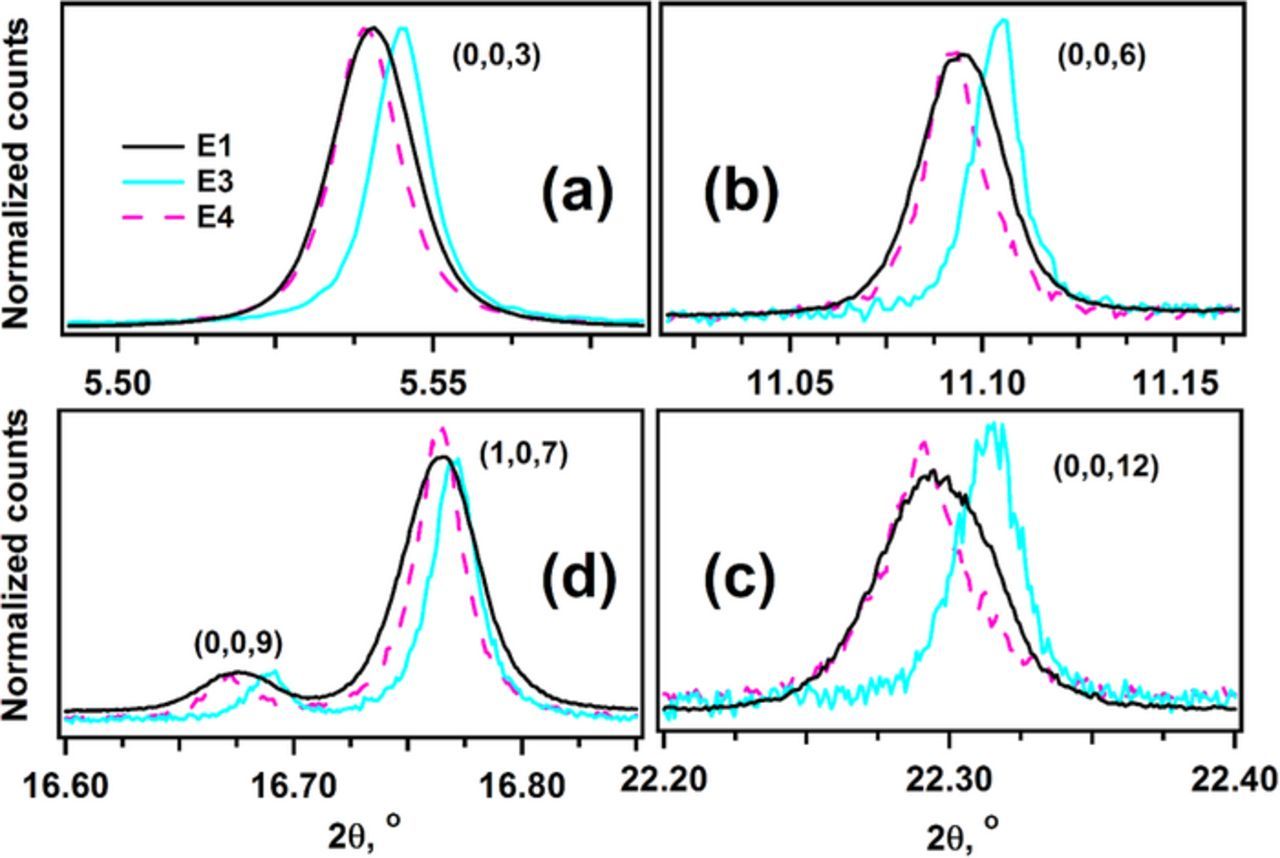
Figure 6. Normalized synchrotron XRD signals for samples E1, E3, and E4. Bragg peaks with the Miller index (0,0,3n) (where n = 1–4) are shown in panels a to d, respectively, in order to illustrate the systematic c axis contraction of the hexagonal lattice in the humid-air exposed sample and its expansion after cycling. The color coding and the Miller indexes are indicated in the plot.
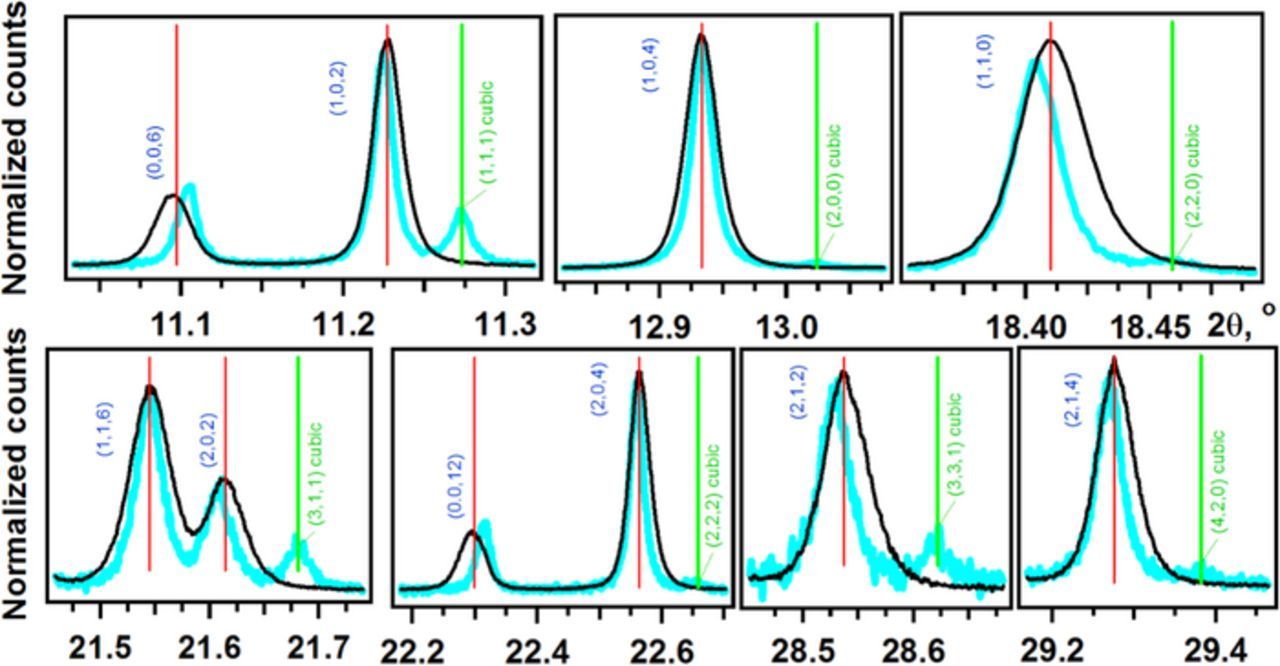
Figure 8. Normalized synchrotron XRD signals for samples E1 (black line) and E3 (blue line). Miller indexes for the primary hexagonal lattice are indicated in blue (the red vertical lines indicate the fit) and the indexes for the cubic lattice are indicated in green (the green vertical lines indicate the fit). Only seven peaks are observed and all of them partially overlap with the peaks from the primary lattice.
The predominant contribution to the observed pattern originates from the bulk of the crystalline NCM523 oxide. Approximately eighty reflections extending to the Miller index (3,1,16) (see Table S1) can be indexed using a hexagonal lattice (a = b≠c, α = β = 90° and γ = 120°). The elucidated lattice parameters are comparable to reported values for the material. Due to the extended 2θ range (reaching out to 50°), the accuracy in the estimation of the lattice parameters was ca. 5 × 10⁻⁵ Å for a,b and 3.5 × 10⁻⁵ Å for c, respectively (Table II); this accuracy allowed us to quantify very small changes in these lattice parameters. These changes can also be observed directly by comparing positions of selected peaks.
Figure 6 shows close-ups of (0,0,l) reflections (with l = 3, 6, 9, 12), which are sensitive to changes in the spacing between hexagonal basal planes. Figure 7 shows close-ups of the (1,1,0) and (3,0,0) peaks, which are sensitive to changes in the in-plane interatomic spacing of the basal planes. The unit cell for the humid-air exposed sample E3 contracts by 8.0 × 10⁻³ Å (or −0.056%) in the c-axis, which is reflected as a clear shift toward higher 2θ of all E3 reflections shown in Figure 6. Correspondingly, there is a dilation of the basal planes reflected as an expansion of the a lattice parameter (by 0.74 × 10⁻³ Å or +0.026% for E3) and a shift toward lower 2θ of E3 reflections in Figure 7. Similar, albeit smaller, lattice parameter changes are also observed for E5 (Table II): the c-parameter contracts by 1.6 × 10⁻³ Å (or −0.011%) and the a-parameter expands by 0.07 × 10⁻³ Å or +0.002% on two-month exposure to room air. Upon relithiation (sample E4, Table II), there is expansion along the c-axis (by 5.4 × 10⁻³ Å or +0.038%) and contraction in the (a,b) plane resulting in a smaller a lattice parameter (by 0.91 × 10⁻³ Å or −0.032%); these changes are seen as a shift to lower 2θ of all E4 reflections in Figure 6, and as a shift to higher 2θ of all E4 reflections in Figure 7.
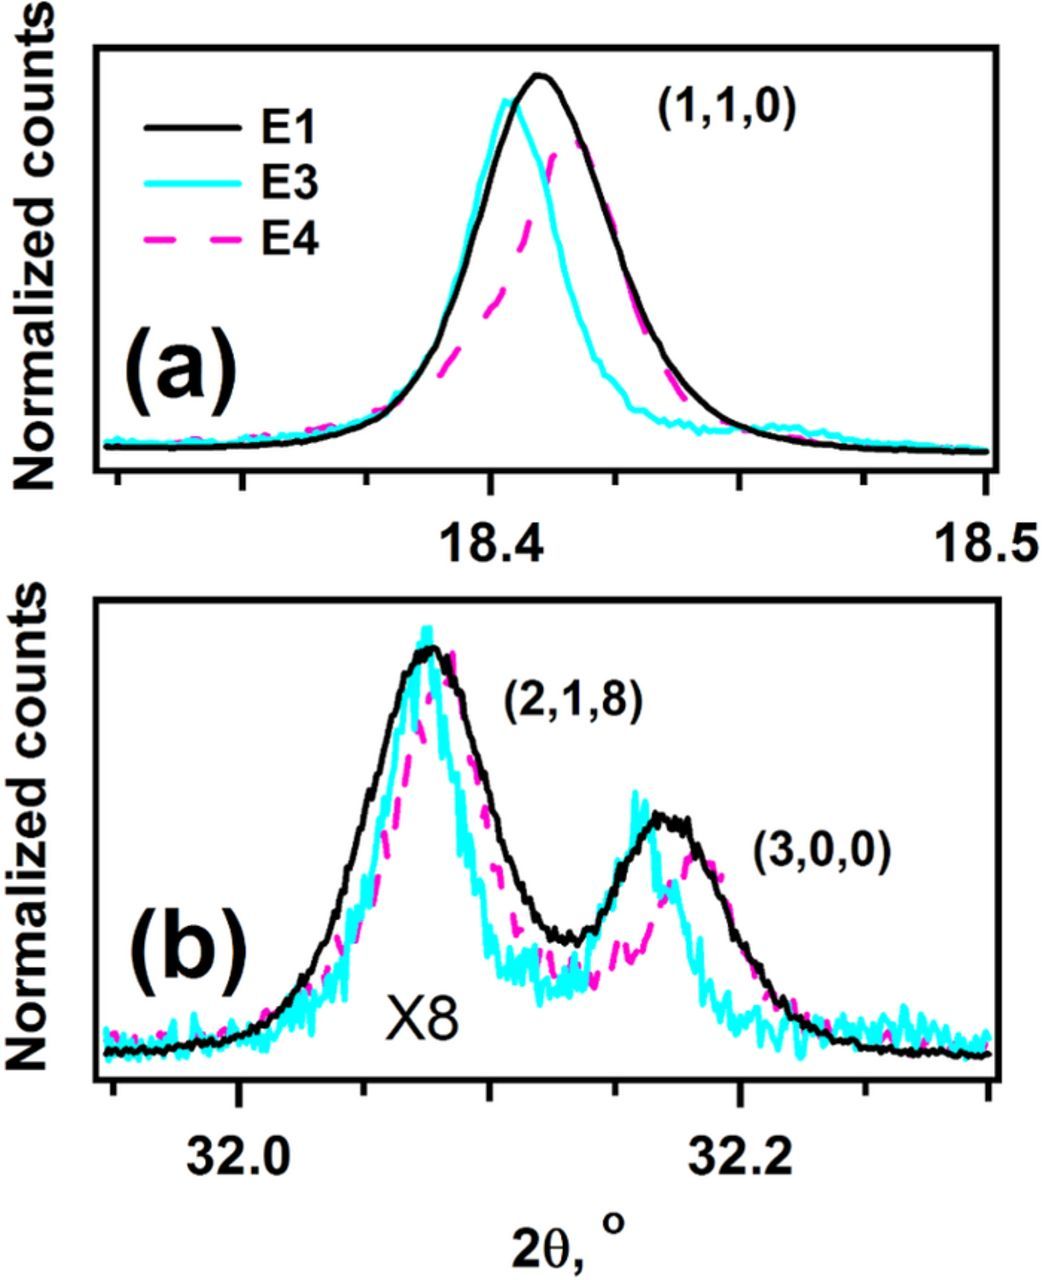
Figure 7. Normalized synchrotron XRD signals for samples E1, E3, and E4. Bragg peaks with the Miller index (h,l,0) are shown to illustrate changes in the (a,b) plane of the hexagonal lattice. The color coding and the Miller indexes are indicated in the plot.
Interestingly, all reflections of sample E3 are noticeably narrower than the corresponding E1 reflections, as seen in Figures 6–8. The changes in peak width indicate that exposure of the sample to humid air results in strain relaxation in the bulk NCM oxide. Relithiation (sample E4) increases peak width but the peaks remain narrower than the corresponding peaks in sample E1, which indicates that the strain in the E4 oxide bulk is lower than that of the E1 oxide bulk.
There is a consensus in the literature that delithiation of the bulk material, whether it is chemical or electrochemical, results in lattice expansion along the c axis.1,65,66 As Li+ ions migrate out, the repulsion between oxygen atoms in the adjacent TM-O layers causes this expansion.15,23 Contraction of the unit cell is observed when the oxide is delithiated beyond a threshold value.65–67 This change is usually accompanied by a poorer cyclability and is attributed to irreversibility in the structure transformations. This mechanism is unlikely in our system because it would necessitate a significant removal of Li+ ions from the oxide bulk. Furthermore, delithiation would create trends that are opposite to those we observe. In addition, we note that electrochemical relithiation of E3 results in the reversal of this trend.
An alternative explanation for the observed changes can be found in a H+/Li+ cation exchange process. Specifically, we suggest that protons generated in Reaction 1 exchange with Li+ ions at the oxide surface and migrate throughout the crystal, forming a solid solution. As H+ has a smaller radius than Li+, it interacts with TM-O layers more strongly, which causes contraction of the stack, while the overall crystal structure remains layered (R-3m). Furthermore, the initially greater strain (broader peaks in sample E1) can be ascribed to Li+ vacancies in the oxide bulk, resulting from minute deviations from LiMO2 stoichiometry. As the protons migrate into the crystal bulk and fill these vacancies, the strain is relieved and the Bragg peaks narrow. We will return to this H+/Li+ exchange hypothesis in the Discussion.
In addition to the aforementioned changes, long term exposure of the oxide to humid air (sample E3) also results in the emergence of a new set of weak reflections that are shown in Figure 8 and highlighted by green vertical lines. Previous researchers (see the Introduction) also observed these additional XRD signals and assigned them to Li2CO3 or a tentative cubic phase in the matrix (indexing was difficult due to poor data quality). The former possibility can be excluded in the present case, as none of the weak extra peaks correspond to lithium carbonate. The extra peaks can be indexed to a cubic unit cell with a = 4.04972 ± 0.00024 Å (Table S2 in SI). This value is within 0.29% of a hypothetical cubic lattice (a = 4.06137 ± 0.00002 Å) whose (1,1,1) planes coincide exactly with the basal planes of the bulk rhombohedral phase. This relationship strongly suggests that the additional peaks correspond to an epitaxial phase.
What is this new crystal phase? One possibility is that it corresponds to bunsenite (NiO, space group F m(-3)m).68 However, the lattice parameter (a = 4.178 Å) of NiO is significantly larger than our calculated value; the lattice parameter (a = 4.446 Å) for rock salt MnO is even larger.68 The lattice parameter decreases when Li2O dissolves into NiO to form Li2xNi1-xO crystal structures (from a≈4.18 Å for NiO to a≈4.12 Å at 20 at% Li);69 however, the observed lattice parameter values are still too high.
Another possibility is that the reflections originate from a double cubic unit cell with a≈8.09 Å. Electrochemical delithiation is known to produce highly disordered spinel phases in the NCM oxides.1 However, doubling the unit cell introduces additional super-reflections that are not observed in our patterns: for example, a spinel (1,1,1) peak next to a rhombohedral (0,0,3) peak. In principle, if the structure disorder (that is, Li+/TM ion exchange) in this spinel phase is sufficiently high, it can eliminate these additional reflections. Both Li2Co2O4 spinel with a = 7.994 Å70 and LiMn2O4 13, 14 have been reported to form with significant disorder in the positions of TM ions. A wide range of lattice parameters a has been reported for LiMn2O4 (8.143 Å,71 8.161 Å,71 8.223 Å,72 8.246 Å,73 and 8.251 Å74) with the lower values corresponding to the highest degree of disorder (where Mn3+ ions occupy Li+ sites).
Neither the MIIO (rock salt) nor the disordered LiM2O4 (spinel) crystal structures (where M stands for TM ions) provide an adequate explanation for the extra peaks observed. Closer inspection of the peaks in the 2θ ranges around 11.2° and 22.4° in Figure 8 reveals that, relative to the rhombohedral reflections, the cubic (1,1,1) reflection is much more intense than the (2,2,2) reflection. Structure factor considerations presented in section S1, Tables S3 to S5, and Figures S5 and S6 in SI indicate that the average number of electrons per cation, in the cation sublattice of the cubic phase, is between 20.3 and 21.8. This estimate is more consistent with the MIIO oxide (26.0 electrons per NiII in NiO; 24.9 electrons per cation in Ni0.5Co0.2Mn0.3) than disordered Li2M2O4 spinel (13.0 electrons per cation for CoIII; 12.8 electrons per cation in Ni0.5Co0.2Mn0.3). These analyses suggest that the cubic phase corresponds to a rock salt structure in which some of the TM ions are substituted by lighter ions and/or TM vacancies, which will both contract the unit cell. Because Li+ ion substitution in NiO cannot fully account for the observed lattice parameter,69 we again suggest that (the still lighter) protons replace TM ions in this rock salt phase (see below).
Discussion: H+/Li+ Exchange Hypothesis
The rhombohedral (bulk) phase
As seen from this examination, exposing NCM523 to humid air has significant effects on its structure and electrochemical properties. These effects include (i) capacity decrease and impedance rise, (ii) partial capacity recovery on relithiation, and (iii) a small lattice contraction in the c-axis direction and dilation in the (a,b) plane of the bulk material. In addition to these changes, a disordered cubic phase is observed by STEM in the subsurface regions and corresponding Bragg peaks are observed in the XRD patterns. Unexpectedly, the exposure to humid air relieves strain present in the pristine rhombohedral NCM oxide.
The formation of the cubic phase is the expected outcome of Li+ ion loss and the redox reactions postulated by previous researchers. Our study, however, suggests cation exchange as an additional mechanism. The H+/Li+ exchange is most likely to occur in the edge regions, as Li+ ions from the layers migrate outwards and become integrated into the (bi)carbonate or hydroxide, while protons migrate in the opposite direction (Reactions 1 to 3). Eventually a solid solution is formed across the bulk. During electrochemical cycling these intercalant protons can leave the material, and Li+ ions can take their place restoring some of the capacity. We also suggest that strain reduction in the oxide bulk, observed on moist air exposure, results from protons filling residual TM ion vacancies in the pristine material.
Moshtev at al.12 considered γ-NiOOH as a possible model compound for an H+/Li+ exchanged material. In this compound, the protons are attached to oxygen atoms in the corners of NiO6 octahedra. In β- and γ-NiOOH the distance between the Ni-O planes is over 4.6 Å, and in Ni(OH)2•xH2O it increases to 7.6 Å, as the water molecules enter the spaces between the protonated Ni-O layers.28,75 These large lattice parameters seemingly argue against such crystal structures as models of the protonated material in our case; however, if only some of the Li+ ions are replaced by H+ ions, one can expect contraction rather than expansion, since the smaller proton would interact stronger with the oxygens and in this way more efficiently screen the repulsion between them.
To put this consideration on a more quantitative ground, semiempirical calculations were used to estimate lattice parameters (at T = 0 K) for H+/Li+ substituted α−LiCoO2 solid solutions (see Figures 9 and 10 and Table S6 in SI). As expected, for the pristine material our calculations favored a hexagonal unit cell with structural parameters similar to those observed experimentally. Following the line of thought given above, dilute H+ solutions were examined by imposing periodic boundary conditions for a 2 × 2 × 2 supercell containing 24 lithium ions arranged in six layers. These Li+ ions were replaced by one to six protons in such a way that there was only one proton per Li+ layer. That leaves multiple ways in which the (several) protons can occupy positions in the layers. The corresponding supercells were geometry optimized, and the lattice parameters, and the standard heats for H+/Li+ exchange per proton (relative to the pristine material), were estimated.
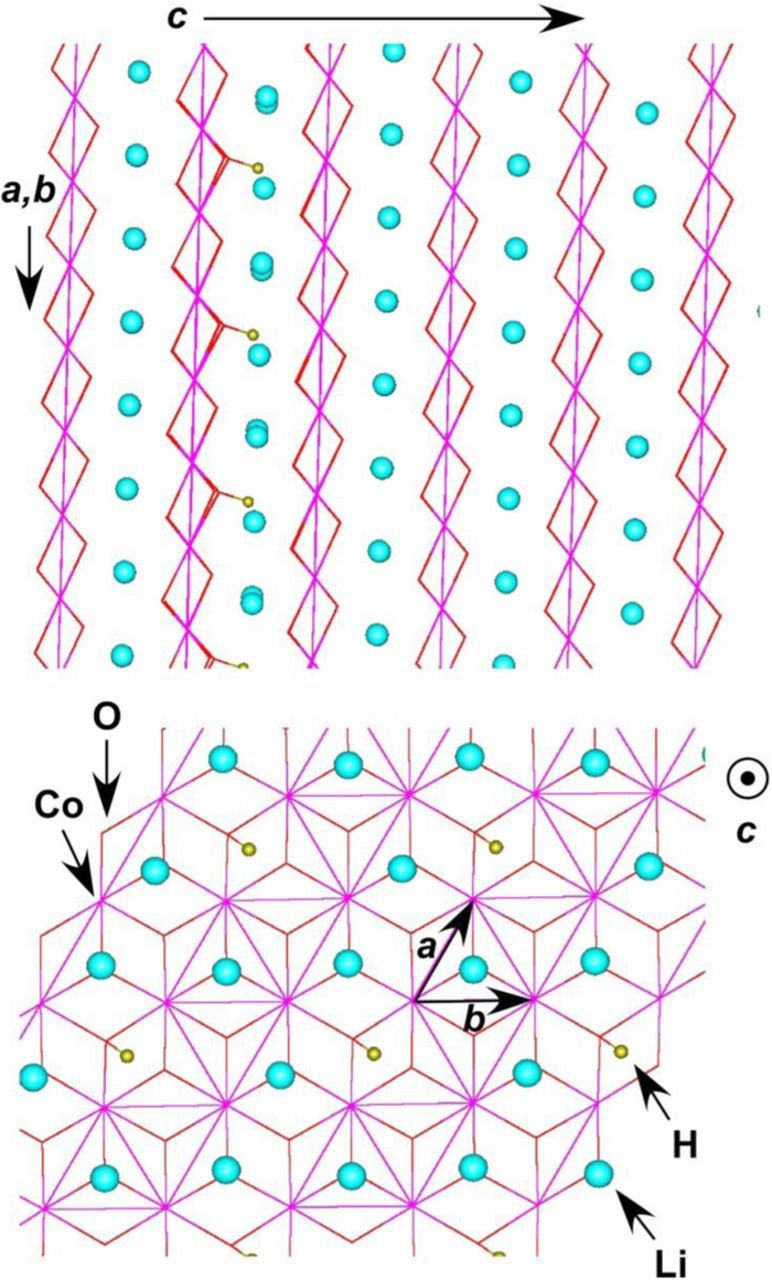
Figure 9. View of H+/Li+ substituted α-LiCoO2 structure (MOPAC calculation, PM7 functional). To the top: the view along the (a,b) plane showing alternating layers of CoO6 octahedral and Li+ ions in the direction of c axis. Also seen are hydrogen atoms making bonds with the trigonal oxygens. To the bottom: a view of the single layer in the direction of c axis. The hexagonal layer of Li+ ions is periodically interrupted by the protons. In this calculation, a 2 × 2 × 2 supercell contained one H+ per 24 lithium ions.
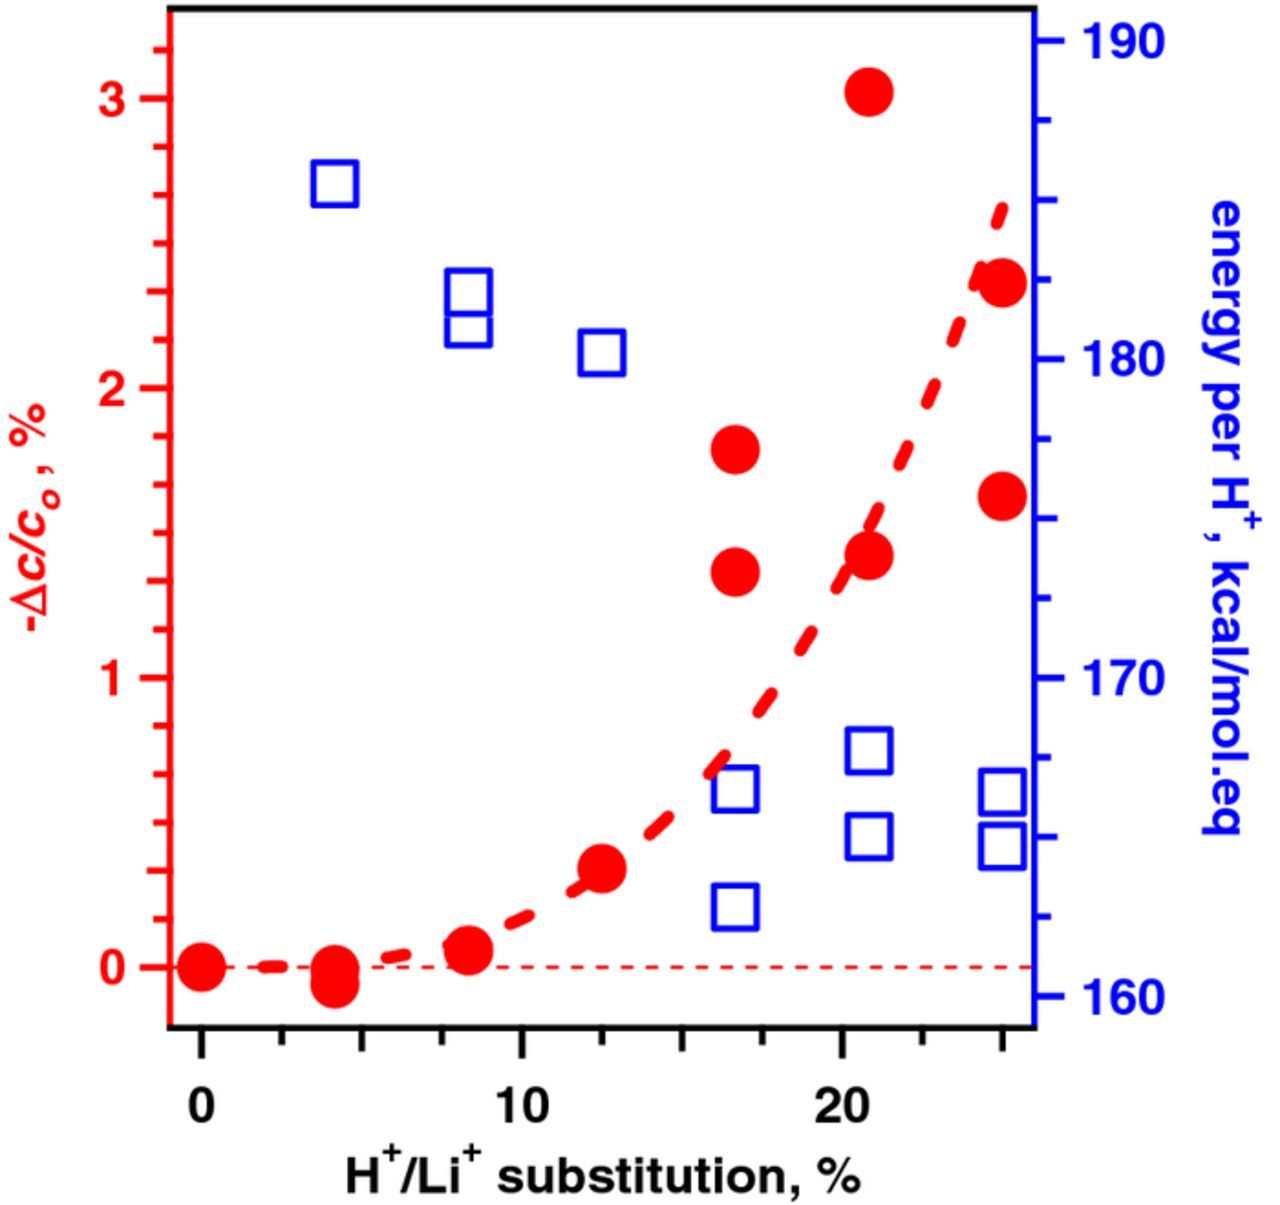
Figure 10. Left axis: contraction of the crystallographic parameter c (relative to the pristine α-LiCoO2) plotted vs the mole fraction of H+ ions (filled red circles). Right axis: differential enthalpy for H+/Li+ substitution per H+ ion (open blue squares). This plot was obtained by substituting 1 to 6 Li+ ions by protons in a 2 × 2 × 2 supercell of 24 LiCoO2 molecules (MOPAC, PM7 functional), one proton per layer, and optimizing the structure at T = 0 K. The scatter reflects different estimates obtained for different initial placement of the protons in different layers.
Figure 10 and Table S6 in SI summarize computed parameters for the supercells having the lowest electronic energies. It is seen that the c-axis of the supercell systematically contracts as the concentration of protons increases. The standard heat for H+/Li+ substitution per H+ also decreases as the proton concentration increases, which indicates that the occurrence of this cation exchange makes it easier for more protons to enter the lattice. According to these estimates, the observed degree of lattice contraction in sample E3 would correspond to exchanging 5–8 mol% of the Li+ ions by protons. Figure 9 shows the (periodic) structure of the supercell containing a single proton in one of the Li+ ion layers. The proton is attached to the corner oxygen in one of the CoO6 octahedra in such a way that the O-H bond makes an acute angle with the plane of the oxygens in the layer. According to the density functional theory models of Kazimirov et al.,75 this arrangement is also the way in which O-H bonds are oriented in the monoclinic β-NiOOH (see Figure S7 in SI); in this sense (and this sense only) the latter is a good model for the proton-exchanged α-LiCoO2.
The cubic (subsurface) phase
In this section we argue that the postulated H+/Li+ exchange not only accounts for the changed properties of the bulk material, but also provides a natural rationale for the observed properties of the cubic phase as observed by STEM and XRD. As the Li+ ions migrate to the surface and the protons migrate into the bulk, some of the lattice oxygens in the subsurface regions are tied in the lithium (bi)carbonate formed on the surface. Consequently, a metal-deficient oxide is left behind in the subsurface regions, and the protons can fill these metal-ion vacancies to maintain the overall +2 oxidation state. The result would be a disordered H2xM1-xO material. Structure factor considerations in section S1 in SI suggest that x∼10–20% would provide the best agreement with the experimental results. Both the TM ion vacancies, and H+ substitution of the metal ions, reduce the cubic lattice parameter vs. the pristine MO oxide.
In STEM images of the basal planes (Figure 4a) a thin strained region is observed near the particle surfaces. If we assume that this strained region has a cubic character then on moving from the bulk rhombohedral to the cubic phase, the interplanar spacing would change from crhom/12 ≈ 1.187 Å to acubic/2√3 ≈ 1.169 Å, while the in-plane interatomic distances do not change. This change in spacing is equivalent to a 1.5% compressive strain on the surface region, which would explain the strain contrast in Figure 4a. The epitaxial constraint reduces the formation energy of the TM ion vacancies and H+ substitution in the cubic phase.
More interestingly, it appears that exactly the same cubic phase is observed near the basal plane edges (Figure 5, panels a-c). The presence of a thicker reconstructed phase is not surprising by itself since Li+ ion diffusion is most facile in these edge regions. However, this cubic phase needs to be the same as the epitaxial phase on the basal planes in Figure 4a, as only one set of cubic XRD reflections is observed in Figure 8. This paradox can be resolved by considering that since (1,1,1) planes of the cubic phase match the basal planes of the rhombohedral phase, any edge facet of the latter would contain an axis belonging to the basal planes. This axis is the zone axis in Figure 5 (that is normal to the printed page); it is shared with the cubic phase and corresponds to the same interatomic spacing. Having only one matched axis allows this cubic phase to grow axiotaxially on the edge facets of the rhombohedral crystals!
We remind the reader that epitaxy occurs when two structures share two linearly independent crystal axes; then both crystal structures can grow on top of each other, with the interfacial plane defined by the two common axes, as is the case for the basal planes in Figure 4a. Axiotaxy76 occurs when only one lattice axis is in common. An atomic plane containing the common axis can transition from one structure to the other, rotating around the common axis and forming a kink to accommodate the different interplanar spacing in these two crystal structures. The result is an off-normal fiber texture with a rough interface due to the lack of a common crystallographic interfacial plane. Because axiotaxial growth of the cubic phase is possible on all facets, overlap of several orientations of the cubic lattice is expected. This overlap would naturally account for poor contrast in the edge area relative to the bulk rhombohedral phase. Indeed, close inspection of Figure 5 reveals that the basal planes of the bulk rhombohedral phase tilt by a discrete set of angles in different areas of the edge region, which is in agreement with our axiotaxial hypothesis.
This completes our explanation how a single rock salt phase can account for all of the features observed in STEM and XRD data. As argued above, a rock salt LixNi1-xO structure that is commonly postulated for this cubic phase (see the Introduction) fails to fully explain the observed cubic surface structure. Partial H+ substitution in the rock salt structure appears to be the only way to obtain realistic electron densities and lattice parameters in this structure as observed experimentally. The same conclusion was reached for the rhombohedral structure.
Conclusions
In this study, we present evidence strongly favoring the occurrence of H+/Li+ exchange during the exposure of the layered TM oxides to humid air. We suggest that released protons migrate into the bulk, forming a solid solution without changing the lattice symmetry. This protonation contracts the lattice in the direction normal to the planes of the TM-O layers. The proton intercalation is reversible by electrochemical lithiation, although it does not occur in a single cycle. We also observe (like researchers before us) delithiation in the subsurface areas that involves redox reactions and (unlike previous researchers) report and index a new rock salt phase. We suggest that in this cubic phase there might be even higher proton substitution than in the bulk. The two processes, proton exchange and the delithiation/redox reactions, appear to occur in concert, yet it appears likely that cation exchange leads the way during the initial stages of exposure. We believe that this proton exchange can also occur in other situations when the layered oxide materials are exposed to water, such as the processing of positive electrodes using aqueous media. Even exposure of electrode samples to typical laboratory environments for prolonged periods can cause oxide-structure changes that are not reversible during cell operation.
Our view of H+/Li+ exchange in the NCM oxides is compatible with an earlier report of cation exchange during acid leaching of layered Li2MnO3 (i.e., Li[Li0.33Mn0.67]2).26 In that study 6Li NMR and 2H magic angle spinning (MAS) data showed progressive removal of Li+ ions and presence of deuterons in the oxide structure resulting in local H1-xLix[Li0.33Mn0.67]O2 environments. The cation exchange was accompanied by loss of Li2O and shearing of oxygen layers to form a new phase (with AABBCC stacking sequence instead of ABCABC), all driven by the strong hydrogen bonding that seeks to minimize the distance between adjacent TM-O layers. The acid-leaching conditions are, however, far harsher than the relatively mild conditions of our study, which show only small (but discernible) changes to the oxide bulk.
While our modeling supports the cation exchange mechanism, additional validation experiments are needed to confirm the occurrence of this phenomenon. These experiments could include the type of solid state NMR measurements conducted by Dogan et al.77 to investigate the insertion of protons into Li2MnO3 and other Li-rich oxides. We recognize that the presence of hydroxyl groups in the amorphous surface films could make the vibrational identification of the inner O-H groups problematic, and the low concentration of deuterons in the oxide bulk could make it challenging to observe their resonances using solid-state 2H NMR. However, we hope that this study will foster the development of instrumentation and methods that will establish beyond doubt the occurrence (or absence) of cation exchange in layered oxides subjected to humid environments.
Acknowledgments
IAS thanks M. Thackeray and B. Key for illuminating discussions. DPA and JG gratefully acknowledge support from the US-DOE, EERE, Office of Energy Efficiency and Renewable Energy, Vehicle Technologies program. IAS acknowledges support from the US-DOE, Office of Science, Division of Chemical Sciences, Geosciences and Biosciences. PJP and RFK acknowledge financial support from the Joint Center for Energy Storage Research (JCESR), an Energy Innovation Hub funded by the US-DOE Office of Science, Basic Energy Sciences. The analytical electron microscopy work was conducted using instruments in the Research Resources Center, UIC; the UIC JEOL JEM-ARM 200CF is supported by an MRI-R2 grant from the National Science Foundation (grant No. DMR-0959470). Use of the Advanced Photon Source (APS) at Argonne was supported by the US-DOE, Office of Science, Basic Energy Sciences, under Contract No. DE-AC02-06CH11357. We are grateful to S. Lapidus and L. Ribaud at APS beamline 11-BM for assistance with the high-resolution powder diffraction experiments. A part of this work was carried out at the Frederick Seitz Materials Research Laboratory Central Facilities, University of Illinois at Urbana-Champaign (UIUC). We are grateful to other colleagues at Argonne, especially to S. Trask, A. Jansen, B. Polzin, N. Dietz, and D. Dees. The oxides and electrolytes used in this work are from Argonne's Cell Analysis, Modeling and Prototyping (CAMP) Facility. The submitted manuscript has been created by UChicago Argonne, LLC, Operator of Argonne National Laboratory. The U. S. Government retains for itself, and others acting on its behalf, a paid-up nonexclusive, irrevocable worldwide license in said article to reproduce, prepare derivative works, distribute copies to the public, and perform publicly and display publicly, by or on behalf of the Government.