
Abstract
In this paper, we investigate contamination mechanisms and quantify the effect of organic model compounds aniline, diethyleneglycol monoethyl ether acetate, diethyleneglycol monoethyl ether, 4-methyl benzensulfonamide, benzyl alcohol, and 2,6-diaminotoluene that have been observed to originate from degradation of balance of plant materials on PEMFCs. In situ voltage loss can be quantified by contamination sources such as Pt, the ionomer, and the membrane using isotherm curves that are prepared by ex situ studies considering contamination mechanisms: adsorption on Pt, ion-exchange/absorption in membranes or electrodes. Severe kinetic loss of Pt activity on oxygen reduction reaction was observed for aromatic compounds due to the greater coverage on Pt/C than aliphatic compounds. An ion-exchange reaction by amine-containing aromatic compounds results in significant conductivity losses of the membrane/ionomer, which is main contributor of the performance loss in this study. That is, controlling the voltage losses caused by the membrane/ionomer contamination is critical to ensure the stability of the system. Infusion of non-amine containing compounds into PEMFCs also increased performance loss by an absorption mechanism but reached at steady state with reversible recovery by switching into normal operations without contaminants.
Export citation and abstract BibTeX RIS
In the development of polymer electrolyte membrane fuel cells (PEMFCs), even though significant technological advances and efforts to reduce cost have been made, there are still outstanding requirements for commercializing PEMFCs for vehicle use. First, PEMFCs are not cost-competitive compared to traditional internal combustion technologies.1–4 Second, PEMFCs do not have a guaranteed lifetime.1–6 Hence, the critical issue for the commercialization of PEMFCs is to ensure their durability and stability without increasing their cost.
The automotive technology targets regarding cost and durability, as set by the Hydrogen, Fuel Cells and Infrastructure Technologies (HFCIT) program of the U.S. DOE's Office of Energy Efficiency and Renewable Energy, is $30 k W−1 and 5,000 h1,2 durability with cycling, which is identical to a 10-year power train guarantee. One opportunity to decrease these costs is to use off-the-shelf materials for balance-of-plant (BOP) rather than custom-made materials, if they will not affect the performance of PEMFCs. Thus, it should require understanding of BOP materials used in the system components, and contaminants impacts that are derived from those materials on performance and durability of PEMFC systems. The BOP materials possibly include structural plastics and assembly aids (adhesive, sealants, lubricants etc.), which use to construct the system.5–7
Previous studies7–20 of contamination in PEMFCs have shown the sensitivity of performance to low levels (ppm) of contamination. For example, fuel cell durability can be affected by contaminants from air impurities4,8–18 (e.g., SO2, H2S, CO, NOx, and bromomethane) and hydrogen fuel impurities19–24 (e.g., NH3, CO, hydrocarbons, and alcohols), metal cations25–38 (e.g., Ca2+, Na+, K+, Fe2+, Fe3+, and Si+) from de-icer, gaskets etc., and also from organic leachates from system components39–49 (e.g., aniline, toluene, and alcohols). Furthermore, St-Pierre et al.8 reported contaminant tolerance limits for a 5% fuel cell performance loss as 10−6 to 103 ppm of various airborne contaminants.
In this study, we focused on liquid-based contaminants potentially derived from fuel cell systems including stack, structural plastic materials, and assembly aids. Again, insights gained from this study can provide a criteria of proper selection of BOP materials that would help to meet the DOE targets for cost and durability of PEMFCs. Over 60 commercial BOP materials for fuel cells contaminations were screened by using various screening methods.6,40,41 The screening techniques included solution conductivity, pH, total organic carbon (TOC), cyclic voltammetry (CV), membrane conductivity, in-situ single cell test etc. For example Clay et al.40,41 identified many organic and inorganic compounds in leachate solutions of from polyphthalamide materials, urethane-based assembly aids, and rubber materials through gas/liquid chromatography mass spectrometry (GC/LC-MS) and ion conductivity (IC) analyses with various soaking times. These data help to quantify specific organic and inorganic contaminants in the leachate solutions. Note that changes in TOC and conductivity typically indicate the presence of organic and inorganic compounds in solutions, respectively.
Based on the chemical structures (i.e., functional groups) and concentration of compounds (e.g., TOC, pH, IC) in leachate solutions, we choose 6 model compounds to study in this paper: aniline, diethyleneglycol monoethyl ether acetate (DEGMEA), diethyleneglycol monoethyl ether (DEGEE), 4-methyl benzensulfonamide (4-MBSA), benzyl alcohol (BzOH), and 2,6-diaminotoluene (2,6-DAT). Prioritization and selection criteria for the model compounds were concentration in the leachate solutions and their functional groups. Those species were dominant species that found in leachate solutions. In addition we speculated that the functional groups of the organic contaminants can determine the contamination mechanisms. The chosen model compounds can be categorized as aromatic and aliphatic, or as alcohol, acetate, and amine groups depending on their functionality. Clay also explained the possible leaching mechanisms or origins for the model compounds: hydrolyzed residual monomers for 2,6-DAT, water scavengers for 4-MBSA, anti-oxidant products for BzOH, and industrial solvents for DEGEE and DEGMEA. The detailed chemical structures of selected model compounds are shown in Figure 1.

Figure 1. Chemical structures of model compounds identified from balance of plant plastic materials.
In this paper, we investigate the contamination impacts of above model compounds on PEMFCS considering three mechanisms through which contaminants may decrease the performance of fuel cells: (1) chemical adsorption, which decreases the active sites of platinum carbon (Pt/C) catalyst; (2) electrochemical reactions, which may compete with the main reactions of the PEMFC; and (3) ion-exchange reactions between cation and proton sites of the ionomer in the electrode and membrane, which decrease the conductivity of the catalyst layer and proton exchange membrane (PEM).
Finally, the results of in situ single-cell infusion for selected model compounds were compared. The different voltage response (i.e., performance) for different model compounds is discussed with respect to the functional groups of the compound and the contamination mechanism. In addition, the total voltage loss at steady state is quantified with contamination sources such as the Pt, ionomer, and membrane using isotherms obtained in ex situ studies.
Experimental
Membrane sorption isotherms
Several mixtures of sulfuric acid (5 mN) solution and organic model compounds (5 mN) solutions were prepared with the different molar ratios for the measurement of the absorption/ion-exchange isotherm of a Nafion 115 membrane (N115, 2.5 × 2.5 cm2) at room temperature. Note that we chose the thick N115 (vs. NRE211) to reduce the experimental error for isotherm experiments. These results measured for N115 can be representative for different Nafion membranes as well due to the same chemical structure and available acid capacity (i.e., EW = 1100 g/equiv.). In addition, the quantitative correlation of ex situ isotherms (N115) to in situ infusion MEA experiments (NRE211) can be scaled by considering for the thickness of each membrane. The method of the scale was introduced in previous studies.53,83 Furthermore a comparison for properties of different Nafion membranes (NRE 211, N115, and N117) that are used in this study is listed in Appendix. Two samples of each cation solution were prepared to check reproducibility. The pH of the mixture solutions was determined considering a pKa of each compounds (e.g., 8<amine groups<10) to allow hydrolysis of amine groups (i.e., -NH2) due to its weak base property.50 Therefore, the pHs of all mixtures were controlled pHs less than 4. The absorption/isotherm experiments included a pretreatment of the membrane, followed by immersion of the membrane in each solution of interest, followed by extract ions.
A pretreatment procedure used one piece of a dry N115 (2.5 × 2.5 cm2) which was weighed prior pretreatment to calculate the ion exchange capacity (IEC) and which was boiled in 2 M H2SO4 for 1 h followed by storage in Deionized (DI) water of 18.2 MΩ-cm resistivity (Thermo Scientific Inc., Barnstead Smart2Pure UV, Waltham, MA, USA). The pretreated samples were immersed in each of the mixtures and magnetic stirrer plates were used for mixing for 24 h to allow equilibrium conditions of the ion-exchange reaction/ absorption between the hydrolyzed amines of the compounds and the proton form of the membrane. Solution concentrations before and after the immersion were measured as discussed below. To confirm the amount of model compounds exchanged, the membranes were placed in 2 M H2SO4 to extract the previously exchanged amine containing compounds. The available acid sites for each membrane were also measured by a back titration method. The exchanged membranes were soaked into 2 M NaCl solutions for 1 h, and then back titrated exchanged protons out of the membranes in the solutions with 10 mM NaOH.
The concentration of model compounds could be measured by a UV-vis. spectrophotometer (Shimadzu UV2101) at a wavelength of 190–800 nm. For the UV-vis., 255 nm wavelength was chosen for quantification of aromatic compounds in acid solutions and 190 nm wavelength for aliphatic compounds. Each calibration curve was linear with intensity at 190 and/or 255 nm for the concentration of solutions between 0.1mM to 5 mM with an accuracy of ≥±0.02 mM. ACS reagent grade H2SO4, NaCl, BzOH, 2,6-DAT, DEGEEA, DEGEE, Benzene, and Phenylenediamine (PhDA) were used as received from Alfa Aesar.
Membrane conductivity measurement
For the membrane contamination study, ion-exchange and/or absorption isotherm curves were prepared. The available acid sites on the membrane were measured before and after contamination (i.e., soaking in organic solutions for 24 h). The membrane isotherm helps explain the role of functional groups in ion-exchange reactions in the membrane. Additionally, measuring the membrane conductivity and water content (λ) at different contaminant concentrations in the membrane helps quantify the performance loss.
One piece of NRE211 membrane (4 × 5 cm2) was prepared by soaking into the model compound solutions and then, the membrane was cut by 5 piece samples to measure. After rinsing the residual on the surface of membrane by DI water, membrane conductivities for pristine and aniline exchanged NRE211 membranes were determined at ten values of constant relative humidity (RH) (i.e., 10, 20, 30, 40, 50, 60, 70, 80, 90, 95%) by applying DC currents at the cell temperature of 80°. The potentiostat (model PAR273) was used with a four-probe conductivity Teflon-based cell (model BT-112) made by Beckktech LLC (Scribner). The cell was equilibrated with a 300 sccm flow of N2 at 80° and 90% RH for 1 h using a Scribner 890E PEMFC test station. The humidity was changed from low (20%) RH to high (95%) RH while the membrane conductivity was measured with a hold of 1 h for each RH to assure equilibrium conditions. Two cycles from low to high RH were performed for reproducibility assessment. A VAISALA dew point chamber was attached at the outlet of the conductivity cell to confirm dew point temperature of outgases relative to those set by the test station. No conductivity changes were observed over three cycles of RH change and thus we conclude that the % exchange did not change during the conductivity measurements.
Water uptake measurement in gas phase
With the objective of comparing water uptake for aniline and Na+ 70% exchanged sites membranes, three pieces of N117s (0.9 × 4.25 cm2) were placed as a sandwich in the Beckktech cell. In order to reduce the experimental error for water uptake measurements that measured membrane mass changes, we chose the thick N117. Note that the water content for different thickness membranes can be correlated and determined using a definition of lambda (λ). The water content (λ) denote the number of moles of water per equivalent acid capacity of the membrane. The cell is equilibrated with a 300 sccm flow of H2 at 80° and 90% RH for 1 h using a Scribner 890E PEMFC test station. The humidity was changed from 20% RH to 95% RH with a hold of 2 h for each RH to assure equilibrium conditions. This cycle from low to high RH was repeated two and after the second cycle, we disassembled the cell, weighed the 3 piece sandwich, and calculated the mass of water uptake. Finally, the exchanged acid sites by aniline were measured by the back titration method.
Thin film rotating disk electrode measurements
To quantify the effects of contamination on Pt/C electrodes, adsorption isotherms of Pt/C for each model compound were prepared by using a thin-film rotating disk electrode (TF-RDE).51,52 The electrochemical surface area (ECSA) or kinetic current loss for oxygen reduction reaction (ORR) by contamination were used to describe the Pt coverage by contaminants. In addition, we used the adsorption isotherm curves to analyze the in-situ performance (i.e., voltage) loss of PEMFCs due to contamination by using a proper scaling technique.53 The scaling is required for a proper comparison because ex-situ TF-RDE typically has lower Pt loadings (e.g., 0.02 mg/cm2 vs. 0.4 mg/cm2) and smaller geometric electrode areas (e.g., 0.19 cm2 vs. 50 cm2).
Carbon-supported 45.5 wt% Pt (Tanaka, 11 mg) was dispersed in isopropyl alcohol (IPA, 2.4 ml) and DI water (7.6 ml) in the presence of a Nafion solution (59 μl). The Pt catalyst ink was mixed and ultrasonically dispersed for approximately 1 min in a horn type and 30 min in a bath type sonicator respectively. For the electrode, the ink was dropped onto a glassy carbon ring disk electrode (0.254 cm2), and dried with a rotating method (700 rpm) on the electrode.51 Before proceeding the electrochemical analysis, carefully ensured uniform coating of ink over the entire glassy carbon surface with an electrode Pt loading of 0.02 mg/cm2.
The electrochemical analysis was performed with an AUTOLAB PGSTAT 302N potentiostat. A 0.1 M perchloric acid solution (HClO4) and mercury sulfate electrode were used as the electrolyte and reference electrode, respectively, whereas a mesh attached Pt wire was used as a counter electrode. Note that other study reported that the Pt electrode may dissolve into electrolyte in acid condition,54 but we could not observe the Pt contamination by dissolution in case the maximum (i.e., upper limit) potential were less than 1.25 V (vs. RHE). For the conditioning, the 200 times of potential cycles from 0.05 to 1.25 V (vs. RHE) were applied at scan rate of 100 mV/s.51,52 After the conditioning, the CV cycles were stabilized. Each three cycles of CV was measured without rotating after adding a model compound to the electrolyte followed by mixing at 1600 rpm for 5 min. During the injection of compounds, the voltage was hold at 0.4 V (vs. RHE) to prevent oxidation of contaminants. The ECSA calculation was used hydrogen desorption area which generally considered integrating the area from 0.05 to 0.4 V (vs. RHE).
ORR polarization curves were obtained in an oxygen-saturated 0.1 M HClO4 electrolyte with/without 0.1 M NaClO4. Background current (capacitive current) was subtracted from the ORR current in an O2-saturated condition. To control the pH of the solution, different volume ratios of 0.1 M HClO4 and 0.1 M NaClO4 were used to keep the ionic strength of the electrolyte. The glassware was cleaned thoroughly by soaking in boiling 2 M sulfuric acid and DI water,5,1 followed by rinsing with DI water. This cleaning method help to obtain reproducible measurements. The gases used were ultrahigh purity (UHP) grade. Double distilled HClO4 and ACS grade sodium perchlorate (NaClO4) from Alfa Aesar (Ward Hill, MA, U.S.A) were used as electrolytes. Note that the standard electrolyte that simulate sulfonic acid ionomer in fuel cell electrodes is 0.1 M HClO4. Perchloric acid was reported non-adsorptive electrolyte on Pt catalyst while, the lower Pt activity was reported by adsorption of sulfuric groups such as HSO4− and SO42− in H2SO4 electrolytes.51,52
In-situ infusion single cell test
Membrane electrode assemblies (MEAs, 50 cm2) were provided by GM have Pt loading of 0.05 mg/cm2 on the anode and Pt loading of 0.4 mg/cm2 on the cathode. These MEAs were used for single-cell infusion tests at different operating conditions. The inlet RHs were fixed at 32% on both the anode and cathode during constant-current operation at 10A if not specified. The model compounds solutions were fed into the cell on the cathode with a mixture of the dry air gas by a micro-syringe peristaltic pump through a nebulizer while the voltage was recorded. The high-frequency resistance (HFR) and CVs were also recorded to quantify the effects on the membrane and Pt/C electrode, respectively, at beginning of test (BOT), end of infusion (EOI), and end of test (EOT).
Results and Discussion
Membrane ion-exchange equilibrium
In general, PEM must be well hydrated to obtain optimal proton conductivity because the membrane's conduction mechanism relies on the dissociation of protons from the ion-exchange group in the presence of liquid water and available proton sites. If the cation contaminants occupy the available proton sites of the PEM, or if they shield water from those sites, proton conductivity will decrease.21–31 In addition the contaminants may also exchange with ionomer in the binder of the catalyst layer.32–35
Measurements of the concentration of amine-containing aromatic compounds in solution before and after PEM immersion show that an ion-exchange (or sorption) reaction occurs in Nafion membranes (N115). Here, we use 'ion exchange' rather than 'absorption' to describe the accumulation of amine-containing organic compounds in the membrane because we observed a shift in the O=S=O stretching peak with ATR-IR measurements, as well as a greater conductivity loss by ion exchange than by absorption. The amine-containing aromatic compounds can be absorbed into the PEM and interact with sulfonic acid sites due to hydrolysis in acidic conditions, as has similarly been shown in the case of ammonia and ammonium. The UV-visible spectra of amine-containing aromatic compounds in acid solutions (0.1 M HClO4) at 255 nm decreased upon exposure to N115 after immersion of the membrane in 5 mN aniline, DATs, and PhDA (0.1 M HClO4). The PhDA (diamine) was also chosen to study to compared with aniline (mono amine) and 2,6-DAT (diamine with methyl group) for the isotherm to investigate a role of methyl group in 2,6-DAT.
A quantitative analysis of the cation exchange in PEM can be determined by the partition coefficient. The partition coefficient for ion exchange can be written for the following ion-exchange reaction: Mn + + nHSO3 − R ⇔M(SO3 − R)n + nH+, where M is the cation, HSO3− is the sulfonic acid group of the PEM, HSO3 – R is the PEM, and n is the number of electrons participating in the ion-exchange reaction.55
![Equation ([1])](https://content.cld.iop.org/journals/1945-7111/162/9/F1056/revision1/jes_162_9_F1056eqn1.jpg)
where XM+ is the mole fraction of cations for the IEC in an external solution, XH+ is the mole fraction of protons for the IEC in an external solution, MM+ is the mole ratio of exchanged cations in the PEM, MH+ is the mole ratio of protons in the PEM, and z is the charge number of the ions.
The partition coefficient for aniline was calculated with equation 1 to be 72 ± 5, and it can be compared to the coefficients of 1.5 ± 0.3 for ammonium (NH4+), 1.2 ± 0.3 for sodium (Na+), 5.1 ± 0.5 for potassium (K+), and 230 ± 10 for calcium (Ca2+). Our value for aniline is very similar to previously reported data that gives a selectivity of 69 for aniline in Nafion by Ogumi et al.56 The fact that aniline's partition coefficient is larger than that of ammonium indicate favor to PEM due to the effect of the ring structure or other electrostatic interactions between sulfonic acid and the ether groups of Nafion. Favorable absorption or/and exchange with N115 was also shown for 2,6-DAT (Keq = 32 ± 5), as shown in Figure 2a, compared to monovalent cations such as sodium and ammonium.
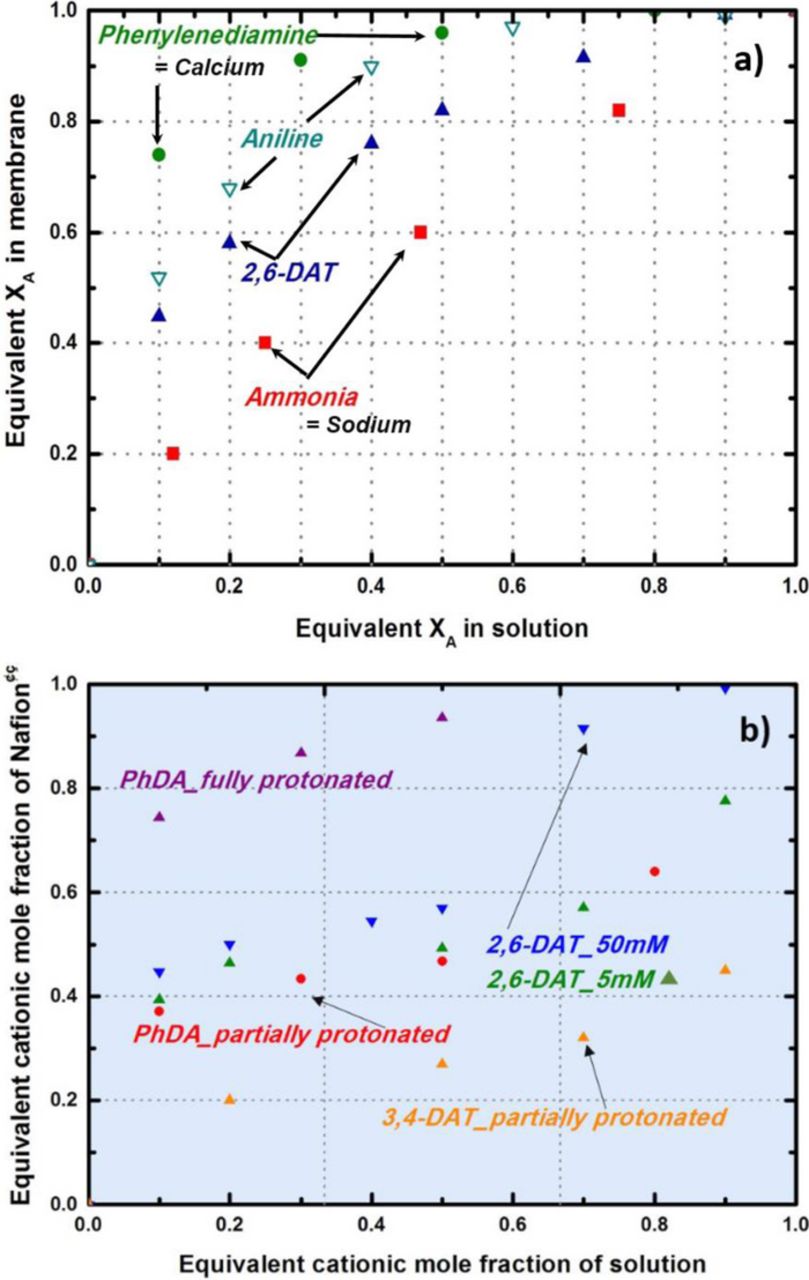
Figure 2. Ion exchange isotherm curves of Nafion membrane for amine containing organic compounds compared with metal cations.
Typical ion-exchange isotherm curves for metal cations are shown in Figure 2a. The divalent cations (e.g., Ca2+) showed higher affinity than monovalent cations (e.g., Na+). We speculated that diprotic compounds, 2,6-DAT, 3,4-DAT, and PhDA may act like a divalent calcium ion. Note that PhDA and 3,4-DAT were chosen as reference compounds to investigate the position of amine groups (3,4-DAT) and the methyl group effects (PhDA) on the resulting ion-exchange reactions. However, interestingly, those diprotic compounds show plateau regions on the isotherm curves (S-shape) depending on the molarity of the solution, as shown in Figure 2b. The plateau could be attributed to the different degree of protonation of amine groups, due to changes of affinity to N115 with changing concentration (or pH). This behavior is similar to that of a bifunctional cation exchanger with sulfonic and carboxylic acid groups. Due to the different selectivity of the strong acid sulfonic and the weak acid carboxylic groups, which prefer proton to other cations, the S shape of the isotherm curve is observed (e.g., Lewatit H-236, Dowex 50+Amberlite IRC-50).55 However, the S-shape isotherms were changed to typical Langmuir-shape curves for the fully protonated condition (increasing the molarity of the solutions) as shown in Figure 2b.
Even though the pH was controlled to be less than five in this experiment to ensure the dominance of protonated amines in solution, there was a partition between the fully protonated and partially protonated forms of diprotic compounds depending upon the location of their amines. The comparison of isotherm curves for 2,6-DAT, 3,4-DAT and PhDA shows different partition coefficients even though all three have the same number of amine groups. This difference would be relevant to steric hindrance from the methyl (-CH3) group of DATs. The location of the methyl group interferes with the interaction between sulfonic groups and the protonated amine groups of DATs. For example, 3,4-DAT showed a less favorable exchange with N115 due to the close location of amines.
The ion exchange of 2,6-DAT and aniline can result in loss of membrane conductivity as the available acid sites and water content of the PEM decreased. We hypothesize that aniline- and/or 2,6-DAT-exchanged membranes may show much higher hydrophobicity (severe water expulsion) than other metal cation-exchange membranes. Reported values of the water content (λ) measured in the liquid phase for various cation-exchanged perfluorosulfonic acid (PFSA) membranes56–58 are shown in Table I. The water content (λ) represents the number of water molecules (nH2O) per acid site within the PFSA membrane (nSO3−). The λ of aniline-form Nafion is lower than the λ of hydrophilic cations such as the Na+- or the Ca2+-form Nafion. The water content of Nafion (N117) membranes equilibrated at different RHs (i.e., equilibrated in the gas phase), shown in Figure 3, also supports the hypothesis of lower water content for 70% aniline-exchanged N117 relative to pristine and 70% sodium-exchanged Nafion membranes.
Table I. The partition coefficients for N117 and water content (λ) equilibrated in solution of different cations
| Ion | Keq | λ (H2O/R-SO3−)56–58 |
|---|---|---|
| Na+ | 1.2 ± 0.3 | 18.4 |
| K+ | 5.1 ± 0.5 | 13.3 |
| Ca2+ | 230 ± 10 | 17.2 |
| NH4+ | 1.5 ± 0.3 | 13.2 |
| Aniline (protic) | 72 ± 5 | 10–11.5 |
| 2,6-DAT (diprotic) | 32 ± 5 | - |
| H+ | 20–22 |
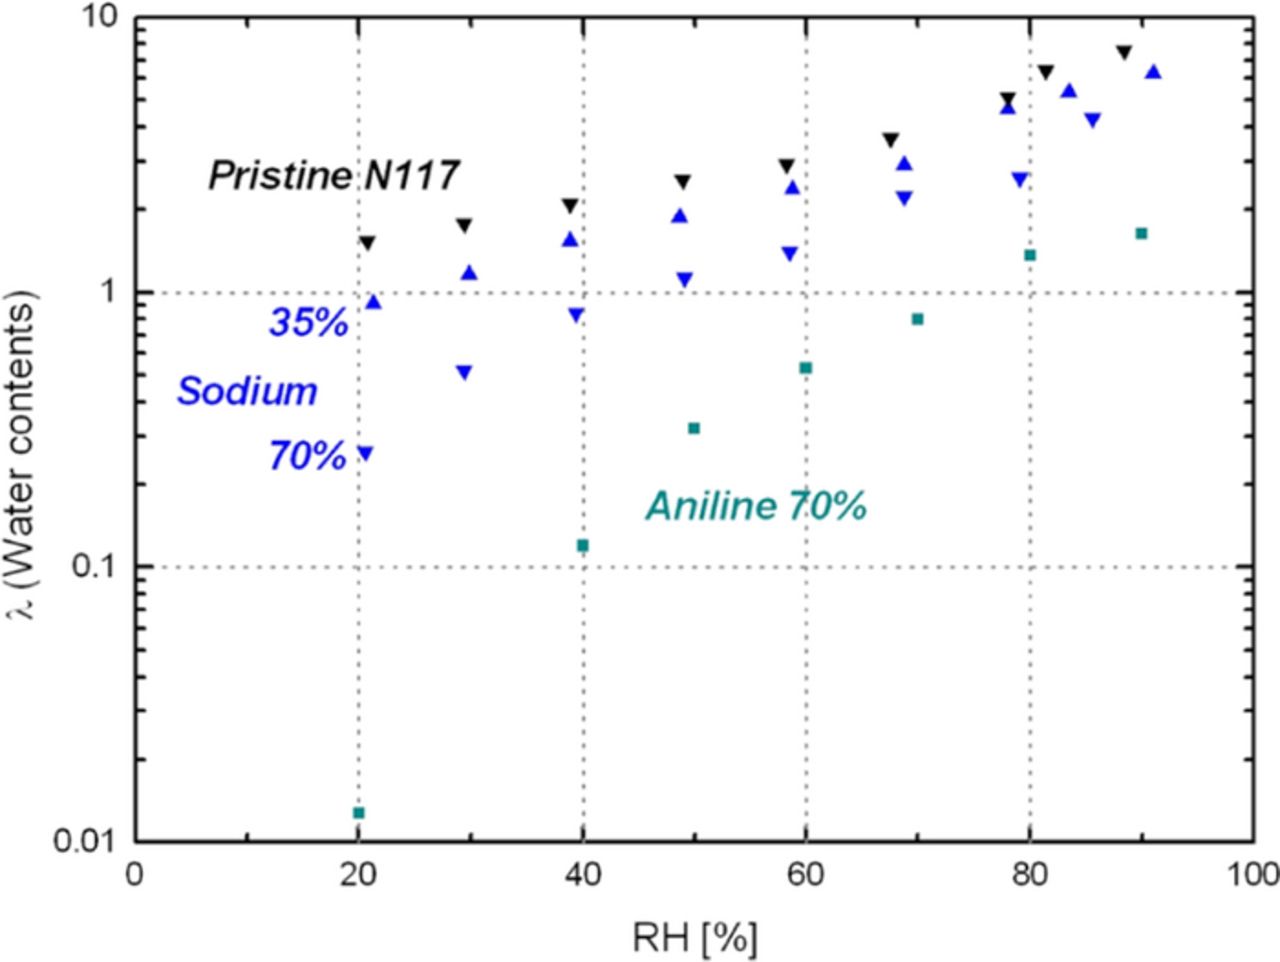
Figure 3. Comparison of membrane water contents for different cation exchange (% = exchange ratio).
In summary the analysis of membrane isotherms of amine containing model compounds (aniline and 2,6-DAT) for the ion exchange reveals that the protonation of amine groups play a critical role for the ion-exchange reaction. The organic aniline (monoamine) and 2,6-DAT (diamine) exhibited higher affinity (greater partition coefficients) and had an order of magnitude lower water content to PEM than inorganic monovalent, and divalent cations (Na+, K+, Ca2+).
Membrane absorption equilibrium
When using UV-visible analysis, we could only observe ion-exchange behavior in the amine-containing aromatic compounds (aniline and 2,6-DAT), not for the aromatic compounds lacking amines or for any of the aliphatic model compounds, 4-MBSA, BzOH, DEGEE, and DEGMEA. However, absorption into the PEM with a concentration gradient was observed, and the degree of absorption depended on each compound's size and/or functionality. Smaller aliphatic compounds such as DEGEE and DEGMEA showed greater absorption than the larger BzOH and 4-MBSA, which have aromatic ring structures. This result led to a greater conductivity loss for PEM (NRE211) with absorbed aliphatic compounds (DEGEE, DEGMEA) relative to membranes containing absorbed aromatic compounds (BzOH), as shown in Figure 4. More details of conductivity results will be discussed in next section. Note that 4-MBSA has an amine as an end group in the chemical structure; however, significant ion-exchange behavior was not observed in this experiment. We speculate that the large molecule size and/or electron distribution stabilization by O=S=O may have caused less absorption of 4-MBSA than other amine-containing model compounds such as aniline, and 2,6-DAT.

Figure 4. Comparison of membrane conductivity for different cation exchange (% = exchange ratio) and a logarithmic relation between available proton sites and membrane conductivity.
Ex situ membrane conductivity
Figure 4 compares membrane conductivity data for different cation forms of the Nafion (NRE211) membrane. The ammonium-form NRE211 (lines (b) and (c)) shows similar conductivity loss to the sodium-form NRE211 (overlapped to line (b)). However, the anilinium-form NRE211 (line (f)) indicates 10 times lower conductivity. The conductivities for potassium- and sodium-form membranes are different, confirming the previously reported lower water content56–59 for potassium-form membranes compared to sodium-form membranes. This is due to difference in the hydrated radii of the cations.60–62 The larger radius of potassium reduces its attraction of water molecules because its electric charge is diffused over a large distance. Interestingly, the conductivity loss for a 50%-exchange concentration of acid sites with aniline (line (d)) is equal to the loss for 99% ammonium or sodium in NRE211 membranes (line (c)).
Here, it is worth pointing out that the significant conductivity losses by aniline and 2,6-DAT are strongly related to electrostatic interactions (i.e., ion exchange). Although the loss of undissociated aniline (or/and 2,6-DAT) species by absorption can be considered, the reported conductivity of various Nafion membranes following sorption of uncharged species (e.g., methanol, ethanol) in the liquid phase ranges from 30–80 mS/cm63–65, which is still greater than the conductivity of aniline-from NRE 211 (i.e., line (f) at RH = 100% in Figure 4a). Another study66 also reported that membrane conductivity losses with non-electrostatic interactive species such as alcohols were less than with electrostatic interactive species such as sodium, potassium, and calcium. In this study, the significantly lower conductivity of sodium-form NRE211 compared to membranes using other non-electrostatic interactive model compounds such as DEGMEA, DEGEE, BzOH etc. supports an ion-exchange mechanism for amine-containing organics such as aniline, PhDA, and DATs. BzOH, DEGEE, DEGMEA, and 4-MBSA showed a 10–60% membrane conductivity loss as changing RH.
Therefore, we can conclude that aniline- and 2,6-DAT-membrane conductivities are affected by not only electrostatic attractions (ion-exchange, hydrogen bonding) but also water expulsion due to its functionality, size, and hydrolysis. In our opinion, this hydrophilic/hydrophobic effect may also support the slightly higher affinity of the PFSA-membrane for aniline (and/or 2,6-DAT) compared with sodium and ammonia (shown in Table I). Ogumi et al.56 and Okada et al.26,27 also reported that hydrophobic cations such as ruthenium bipyridine complex, Cs, and Ba have a greater exchange selectivity than hydrophilic cations such as Na and Li. They also reported that hydrophobic cations were confirmed at the intermediate region of the PFSA membrane.
In summary the comparison of membrane conductivity losses by model compounds (i.e., aniline, 2,6-DAT, DEGEE, DEGMEA, BzOH, 4-MBSA) absorption (or ion exchange) reveals that the conductivity loss by the ion exchange mechanism was superior to that by the absorption. The aniline and 2,6-DAT exchanged Nafion membranes had an order of magnitude lower conductivity than non-electrostatic compounds (DEGEE, DEGMEA, BzOH, 4-MBSA) absorbed membranes. That is, conductivities for all organic model compounds were affected by not only electrostatic attractions (ion exchange) but also water expulsion due to its functionality, size, and hydrolysis.
Interactions with the Pt/C electrode
Figure 5 shows a comparison of CV graphs (0–1.05 V vs. RHE) of the Pt/C electrode in the presence of the model compounds. All the cases show that the peaks for desorption and adsorption of protons (0.05–0.25 V) decreased, indicating that the available sites of Pt for electrochemical reactions decrease when model compounds are added to the HClO4 electrolyte of the RDE system. The aromatic structural compounds show more impact than the aliphatic compounds due to the adsorption behavior of the benzene ring on the surface of Pt catalyst. This adsorption of aniline, 2,6-DAT, BzOH, and 4-MBSA on the Pt/C catalyst electrode may be a result of the parallel-oriented adsorption of the aromatic ring at the platinum catalyst's electrode sites (e.g., aniline67). This may be due to the strong electronegativity and interaction between the aromatic ring and the platinum. Because the interface between bare Pt and ionomers is hydrophobic6,8 aniline (or BzOH, 4-MBSA, or 2,6-DAT) may easily come into contact with the interface between Pt and Nafion through adsorption, absorption, or an ion-exchange reaction (recall the hydrophobic nature of the aromatic ring of aniline discussed above).
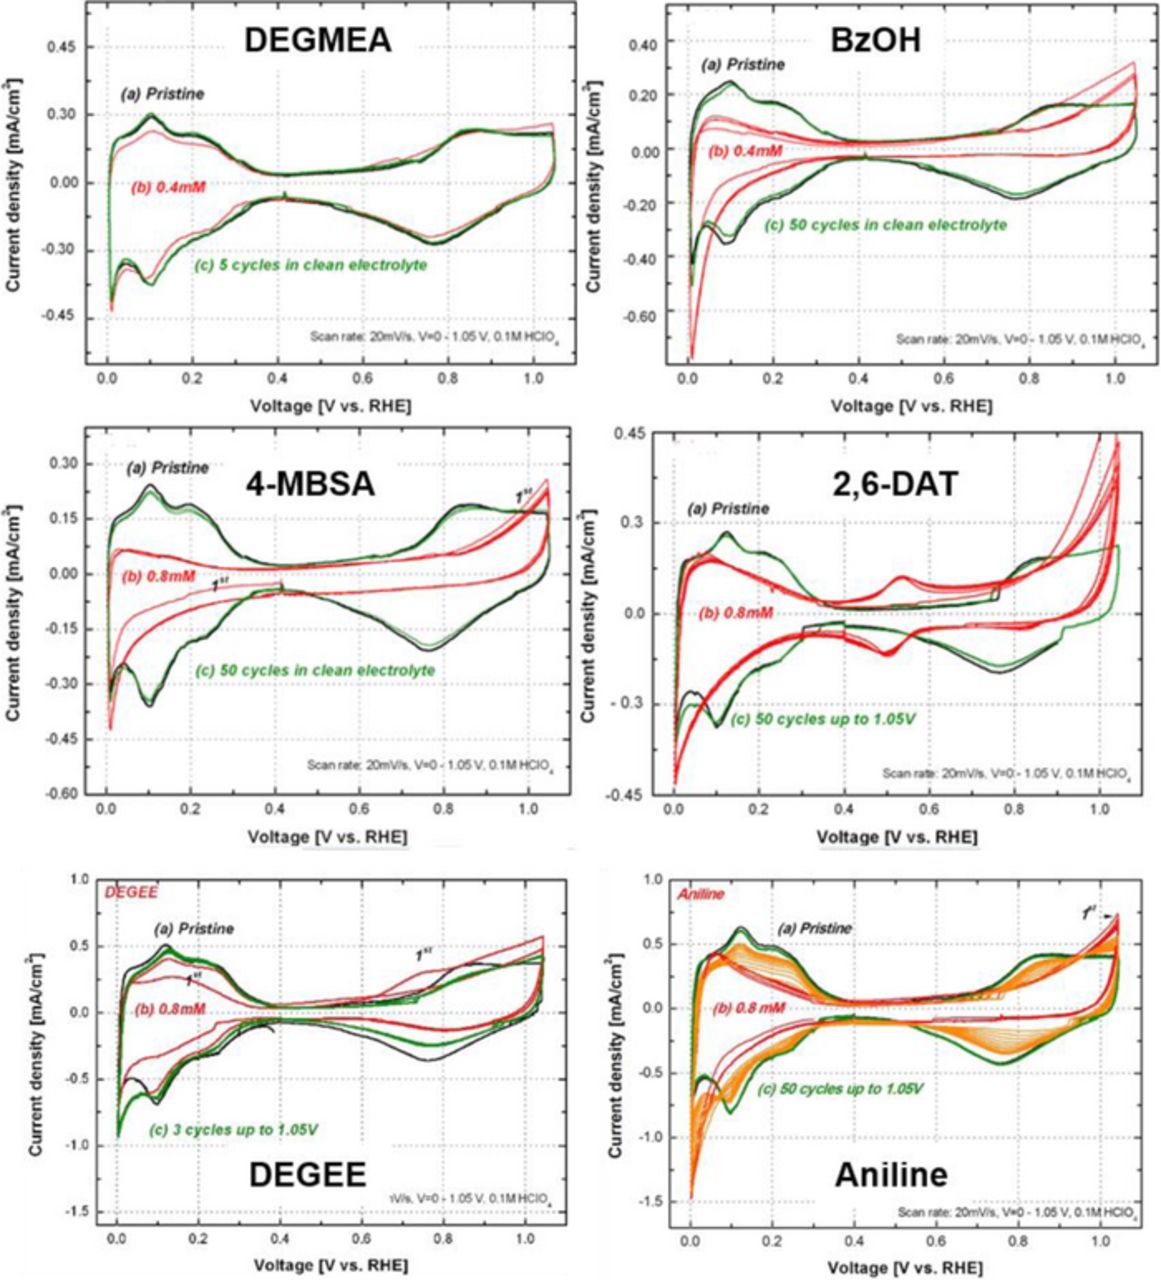
Figure 5. CV scan of Pt/C in the presence of model compounds: (a) 0.0 mM (b) 0.8 mM (c) after 50 cycles 0.0–1.05 V during recovery, 0.1M HClO4, T = 25°, scan rate = 20 mV/s, Pt loading = 0.02 mg/cm2.
For parallel electrochemical reaction mechanisms, we also investigated peaks other than the hydrogen and PtOx peaks. CVs for BzOH and DEGEE show that the current increased by approximately 0.75 V with respect to RHE, while other aromatic ring compounds show an oxidation peak above 0.9 V with respect to RHE. The peak at 0.75 V for BzOH and DEGEE could be relevant to an oxidation of the hydroxyl group because benzene oxidation requires higher potentials. The oxidation peaks for benzene on Pt, Pt(111), Pt(100), and Pt(110) were approximately 1.35, 0.95, 1.30, and 1.34 V with respect to RHE, respectively.69
The CV graph for 2,6-DAT shows a redox peak at 0.5 V with respect to RHE. We can speculate that the amine reaction can account for this redox peak. For example, a CV graph for aniline showed the growth of peaks associated with the coupling of quinine (Q) and hydroquinone (H2Q) formation and polyaniline (PANI) film growth because the peak near 0.6 – 0.7 V kept increasing through potential cycles with aniline. It is well known that multi-layer PANI can be synthesized on the carbon or Pt electrodes from aniline molecules adsorbed by electrochemical load cycling in an acidic solution (H2SO4).70–72 Additionally, oxidation products can be determined depending on the coupling (i.e., head to tail or tail to tail) of cationic radical species of aniline to produce p-aminodiphenylamine and benzidine.73,74 However, we observed a first reduction peak for the redox reaction of the amine after the oxidation peak above 0.9 V. This peak explains the electrochemical oxidation of amine, yielding aniline polymerization reactions by increased cycling. Therefore, the polymerization (or dimerization) reaction may not be important in PEMFCs, as the OCV is generally approximately 0.95 V.75
The decrease of ECSA by aromatic compound contamination appears to be irreversible, in contrast to the ECSA decrease caused by aliphatic compounds, which can be reversed. This recovery suggests that the DEGEE and DEGMEA can be electrochemically oxidized during subsequent CV cycles. We might speculate that the aniline and DAT contamination of the Pt/C catalyst electrode would be greater on the cathode side of PEMFC due to the potential gradient of the system. Previous membrane contamination modeling studies76–78 predicted that the concentration of cation species would be increased on the cathode, corresponding to the decrease in proton concentration due to the electroneutrality. However, we found that we could recover the activity of the Pt/C electrode after aromatic compound contamination by cleaning it with an acid solution (in this experiment 0.1 M HClO4), which appears to partially remove compounds from the Nafion binder and the Pt/C active surface. Interestingly, the ECSA was recovered to approximately 80–90% after flushing the electrode with a 0.1 M HClO4 solution followed by applying 50 potential cycles to a high potential region (i.e., 0.0–1.05 V vs. RHE). This may indicate that excessive absorption into the Nafion binder and onto the Pt/C can be removed by cleaning with HClO4 or hydrogenation of benzene79–81 with the adsorbed proton to produce a cyclohexane. However, this hydrogenation mechanism would be unlikely in PEMFCs, as the voltage does not approach 0 V vs. RHE.
Owing to the deleterious effect of H2O2 on the stability of the Nafion membranes and the possible ORR mechanism change from 4-electron to 2-electron, the extent of H2O2 formation on the cathode catalyst in the potential region above 0.7 V (vs. RHE) is a critical for the suitable catalyst. The ORR currents after adding all model compounds (∼5 × 10⁻⁴ M) showed negligible H2O2 formation, while ORR activities (i.e., specific and mass) and limiting currents were decreased in similar with ECSA losses in above CVs. No H2O2 formation were observed on two aliphatic ethoxy compounds (i.e., DEGEE, DEGMEA). For 2,6-DAT, 4-MBSA, and BzOH additions, less than 10% fraction of H2O2 formation at 0.7 V (vs. RHE) were observed. However, the study reported that ring current detected a significant amount of 50–70% peroxide formation around 0.0–0.4 V by addition of polyethylene glycol dimethacrylates (PEG), which is essentially a polymer containing repeating ethoxy groups. For details of the ORR results, the reader can refer to Ref. 82. M. Das studied impacts on ORR activities for various organic compounds in 0.1 M perchloric acid. This study included model compounds above (aniline, 2,6-DAT, BzOH, 4-MBSA, DEGEE, and DEGMEA).
Figure 6 shows adsorption isotherms for the Pt/C catalyst. The isotherm was prepared using the partial CV graphs (0–0.55 V vs. RHE) of the Pt/C electrode in the presence of model compounds. ECSA changes with changing concentrations of each contaminant are reflected as the coverage (y-axis). Langmuir adsorption behavior is shown for all cases, and the maximum coverage depends on the compound. Aromatic ring compounds typically showed greater coverage than aliphatic compounds. More branched molecules (higher carbon numbers) such as 4-MBSA (-CH3-SO2-NH2) and BzOH (-CH3-OH) had the greatest coverage among model compounds.
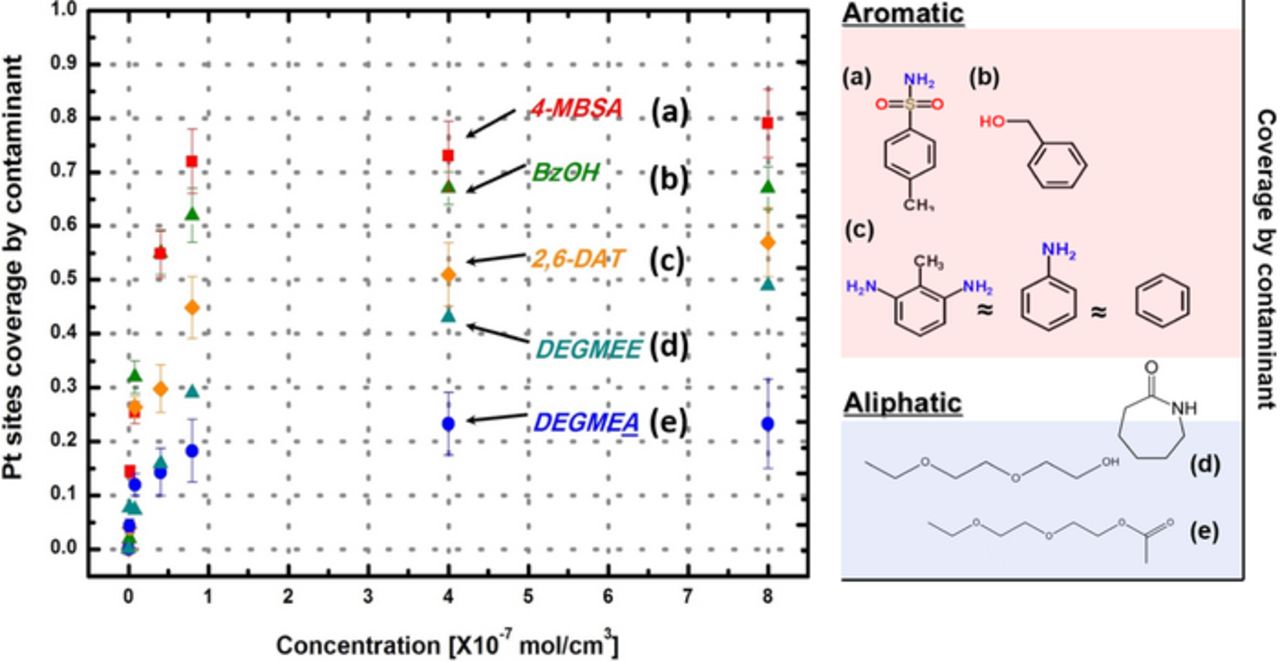
Figure 6. Adsorption isotherm for Pt/C at 0.4 V adsorption potential prepared by using partial CV scans (0.05–0.4 V vs. RHE) at T = 25°, Pt loading = 0.02 mg/cm2.
From the adsorption isotherm, we can obtain the Langmuir parameter (Keq cm3/mol) and maximum coverage (B) for different model compounds, as listed in Table II and as described in equation 2 below. These parameters can be used for the prediction of performance loss in PEMFCs using the previously developed model.53,83 Interestingly, the maximum coverages for aniline, benzene, and DATs (i.e., 0.55–0.65) were equal within the accuracy of these data. Note that as described in Ref. 83, the coverage (θ) and equilibrium concentration (Keq) of contaminant A at the interface (C*A) between the gas diffusion layer and the catalyst layer can be expressed by the Langmuir adsorption isotherm as below:
![Equation ([2])](https://content.cld.iop.org/journals/1945-7111/162/9/F1056/revision1/jes_162_9_F1056eqn2.jpg)
where B is the maximum coverage measured by ex-situ isotherms; CA* is the concentration of contaminant A at the midpoint of the electrode [mol/cm3]; CAS is the average concentration of the adsorbed contaminant A on the Pt sites [mol/cm2]; Cs sis the surface concentration of Pt sites [mol/cm2]; and Keq is the equilibrium constant for the Langmuir isotherm [cm3/mol].
Table II. The Langmuir parameter and maximum coverage for model compounds: adsorption on Pt.
| DEGEE | DEGMEA | BzOH | 4-MBSA | 2,6-DAT | Aniline | |
|---|---|---|---|---|---|---|
| K [cm3/mol] | 6.0 × 10⁷ | 2.0 × 10⁷ | 2.0 × 10⁸ | 2.0 × 10⁸ | 9.0 × 10⁷ | 7.0 × 10⁷ |
| B | 0.45 | 0.35 | 0.72 | 0.75 | 0.62 | 0.60 |
In-situ infusion single cell test
Figure 7 shows the voltage response and high frequency resistance (HFR) change given a constant molar flow rate (27 μmol/h) of each compound on the cathode at 0.2 A/cm2. The voltage drops for all cases indicated that the infusion of aromatic compounds (BzOH and 2,6-DAT) showed more performance loss than aliphatic compounds (DEGEE and DEGMEA), as expected from ex-situ isotherms. Interestingly, after switching back to normal operating conditions with a contaminant-free gas purge, most of the voltage losses observed for DEGEE, DEGMEA, and BzOH were recoverable, but 2,6-DAT presented irreversible performance loss. This clearly indicates that different contamination mechanisms between amine-containing compounds and other compounds can lead to different voltage behaviors.
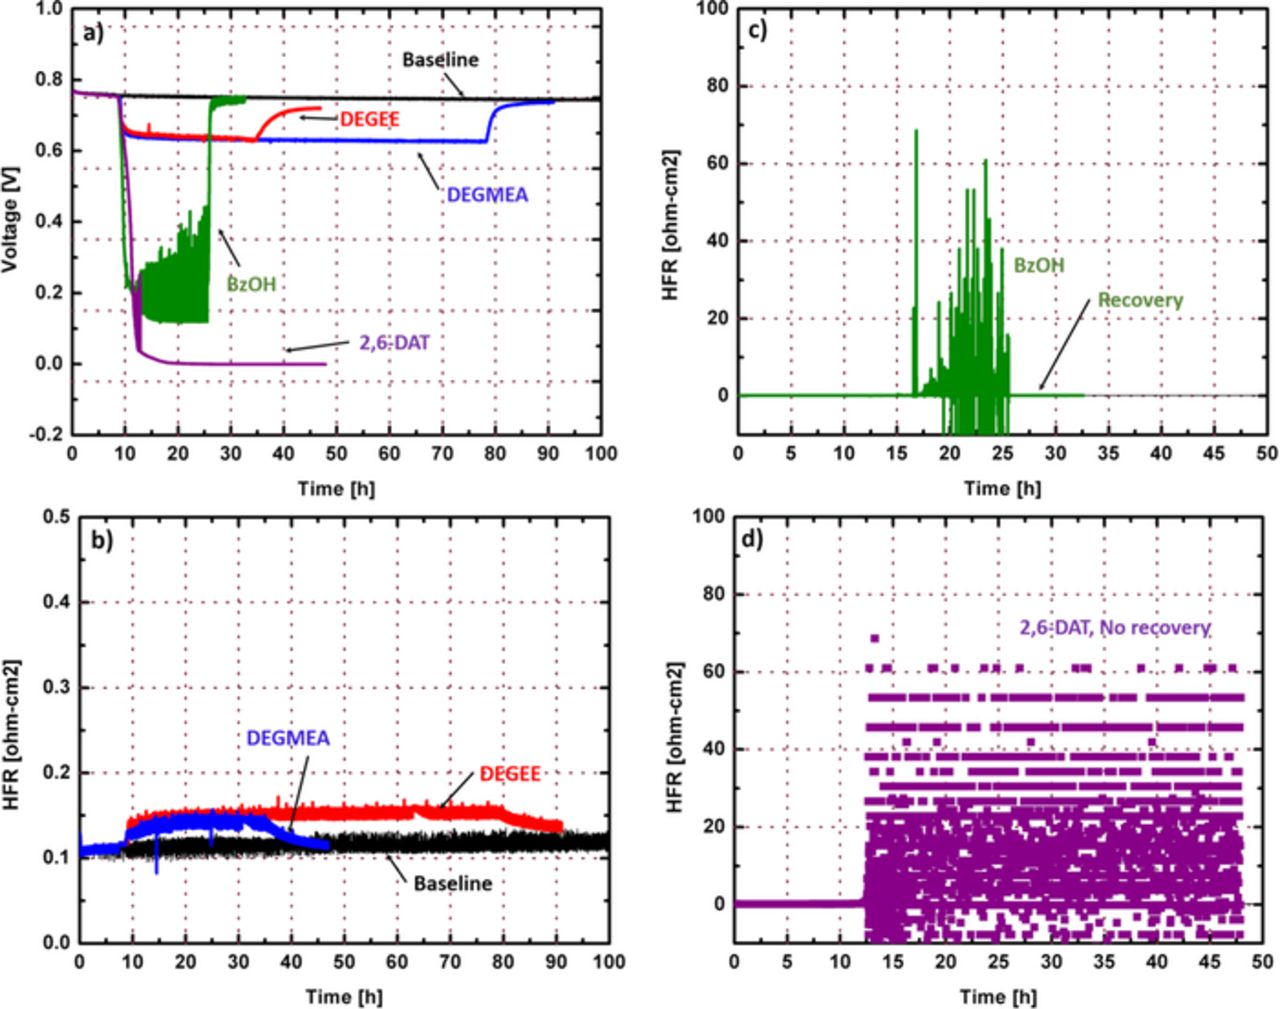
Figure 7. a) In-situ voltage response for model compound infusion, HFR changes for b) DEGEE and DEGMEA infusions, c) BzOH infusion, d) 2,6-DAT infusion: Infusion on cathode, Tcell = 80°, RH = 32/32%, stoich. = 2.0/2.0, back pressure = 150/150 kPa, I = 10 A. Infusion rates = 27 μmol/h.
Owing to the strong electrostatic interaction (i.e., ion-exchange reaction) between hydrolyzed amines of 2,6-DAT and the sulfonic acid groups of the membrane and/or ionomer, the absorbed 2,6-DAT can be difficult to remove from a single-cell membrane electrode assembly (MEA). That is, the irreversible and continuous decay of performance accounts for the accumulation of 2,6-DAT in the MEA during the 2,6-DAT infusion. However, for BzOH, DEGEE, and DEGMEA, no strong interactions occur between the functional groups of the compounds (i.e., -OH, -CHO, benzene) and membrane (i.e., -C-O-C, -SO3−), allowing the relatively easy recovery. It is thus believed the absorption mechanism is dominant for non-amine containing compounds, while amine-containing compounds mainly follow the ion exchange mechanism.
Elucidating this different behavior is critical for understanding the behavior of different contaminants. For the absorption mechanism shown for DEGEE, DEGMEA, and BzOH, we can speculate that the voltage loss is a function of the concentration of contaminants, and Figure 8 supports this hypothesis. With an increased concentration of DEGEE in the channel, the voltage loss at steady state was greater despite of equal dosages of DEGEE. However, all cases still showed self-induced recovery during contaminant-free gas purging, which removed the concentration gradient from the channel to the MEA.
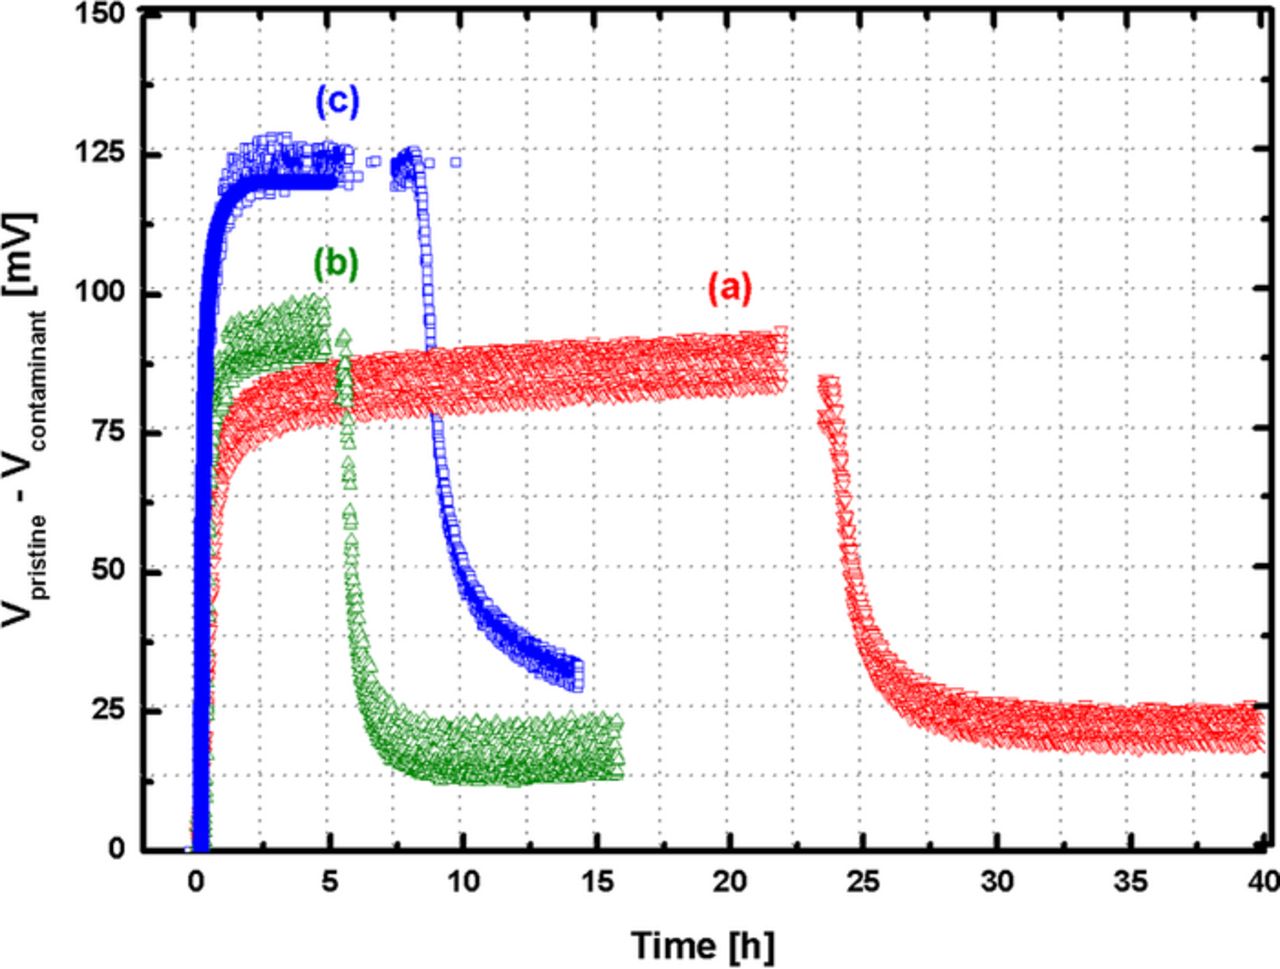
Figure 8. In-situ ΔV and ΔHFR for different concentration of DEGEE infusions Tcell = 80°, RH = 32/32%, stoich. = 2.0/2.0, back pressure = 150/150 kPa, I = 10 A.
Predicting the voltage loss
Next, to assess and develop a prediction model83 relating contaminant coverage to voltage loss, we used Ohm's law and the Tafel equation. With an assumption of no open circuit change and a negligible change in the anodic overpotential (η, V), the total voltage change (ΔV, V) can be written as follows:
![Equation ([3])](https://content.cld.iop.org/journals/1945-7111/162/9/F1056/revision1/jes_162_9_F1056eqn3.jpg)
where i is the current density [A/cm2]; R is the resistance [ohms].
The assumption of no OCV change by contamination can be justified for a low concentration of contaminants. The resistance is related to the membrane conductivity (κ), which can be determined from the ex-situ membrane conductivity results shown in Figure 4. The conductivity (κ, mS/cm) and coverage (χ) have the following exponential relation at constant RH:
![Equation ([4])](https://content.cld.iop.org/journals/1945-7111/162/9/F1056/revision1/jes_162_9_F1056eqn4.jpg)
The constants a and b at different RHs are shown in Figure 4d. Thus, the iR loss can be written in terms of coverage (χ) by the contaminant in the membrane for a specified RH condition:
![Equation ([5])](https://content.cld.iop.org/journals/1945-7111/162/9/F1056/revision1/jes_162_9_F1056eqn5.jpg)
where i is the current density [A/cm2]; z is the membrane thickness [cm].
For the cathodic overpotential (Δηc), the Butler-Volmer equation can be simplified to the Tafel expression for the large cathodic over-potentials of the ORR and can be written according to the notation in Ref. 84.
![Equation ([6])](https://content.cld.iop.org/journals/1945-7111/162/9/F1056/revision1/jes_162_9_F1056eqn6.jpg)
where Cij is the average concentration of species i on surface j, [mol/cm2]; αc is the transfer coefficient; F is the Faradady's constant, 96,487 [C/equiv]; i0 is the exchange current density, [A/cm2]; T is the temperature, [K]; R is the gas constant, 8314 [kPa cm3/ mol K]; qij is the Butler-Volmer coefficient; ref is the reference
Equation 6 can be rearranged to show this explicitly:
![Equation ([7])](https://content.cld.iop.org/journals/1945-7111/162/9/F1056/revision1/jes_162_9_F1056eqn7.jpg)
For the ORR (i.e., 2H2O↔O2 + 4H+ + 4e−)b, Eq. 7 can be written for pristine and contaminated electrodes, and through subtraction, the voltage change by contamination can be expressed:
![Equation ([8])](https://content.cld.iop.org/journals/1945-7111/162/9/F1056/revision1/jes_162_9_F1056eqn8.jpg)
Note that here we only considered proton and Pt concentrations and not including oxygen partial pressure. This assumption may produce inaccuracies for the prediction of voltage loss by contaminations. We also used the qij = 1 for Pt contamination and qij = 1.7 for ionomer contamination of ORR. The qij value for ionomer has been measured directly for film electrodes as 1.7 ± 0.3 as shown in Figure 9. The potentials at 5 × 10⁻⁴ A cm−2 for ORR are plotted as the change of pH of each electrolyte solution (i.e., mixtures of 0.1 M NaClO4 and 0.1 M HClO4) and we can obtain the qij value for the ionomer contamination from the slope of the linear graph from Eq. 9.
![Equation ([9])](https://content.cld.iop.org/journals/1945-7111/162/9/F1056/revision1/jes_162_9_F1056eqn9.jpg)
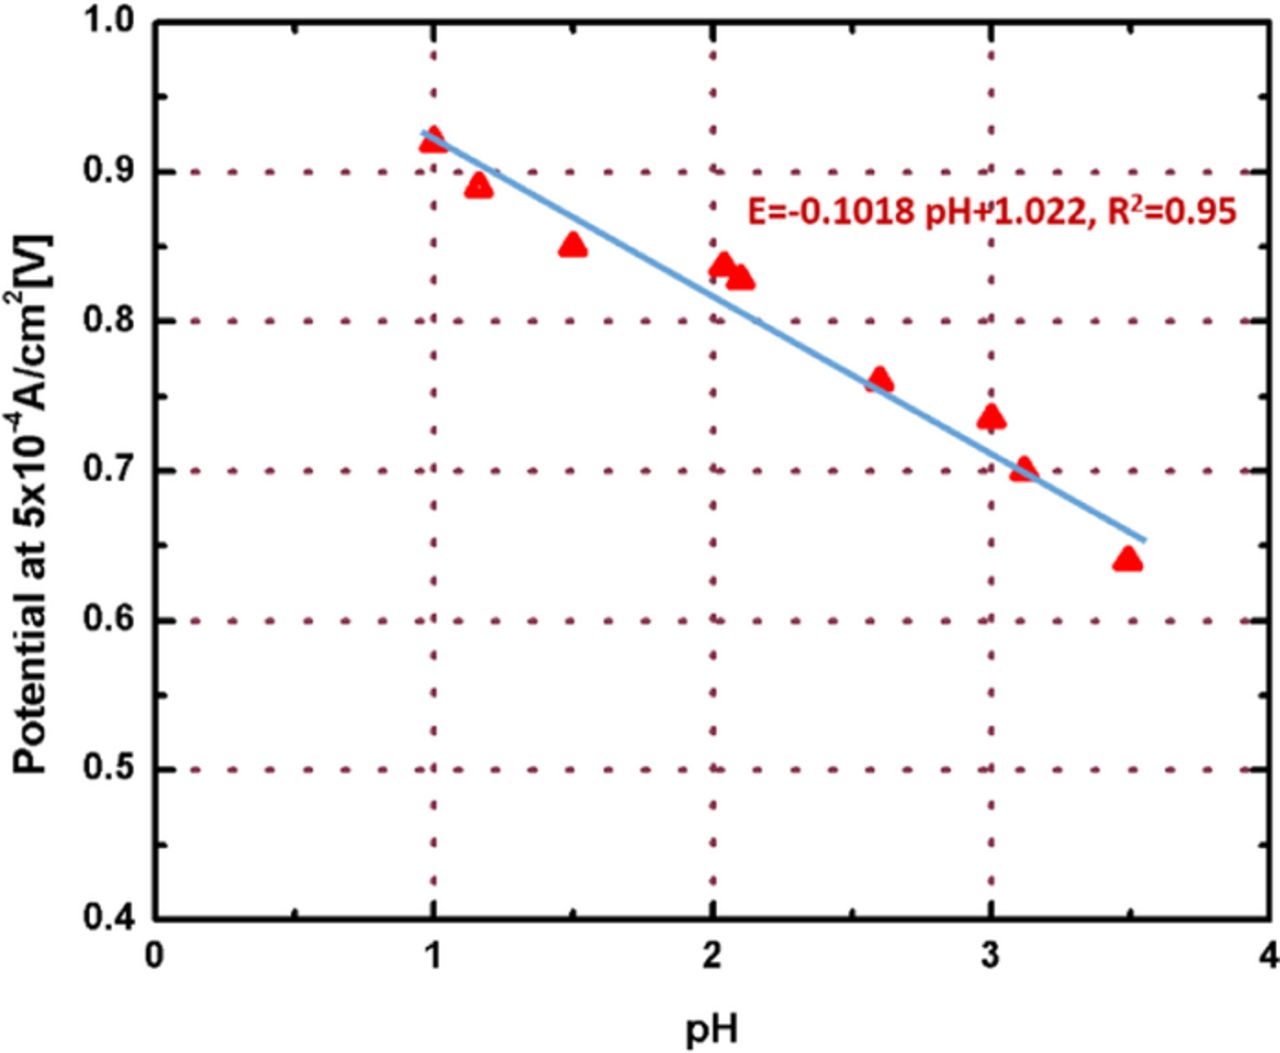
Figure 9. Potentials at i = 5×10⁻⁴ A/cm2 for ORR as varying of pH in electrolyte solutions.
The reaction order of 1.5 for acid solutions of oxide free crystalline Pt electrode was reported in a previous study.85 Additionally, Tafel slopes of –60 mV decade−1 and –120 mV decade−1 for V(iR corrected) > 0.85 V and V(iR corrected) < 0.85 V for the ORR on Pt/C electrode were used respectively.86
Thus, to predict the voltage loss due to electrode contamination, the changes in coverage on the Pt sites and on the ionomer proton sites are required. To obtain these values, we can use the adsorption and ion-exchange isotherms shown in Figure 2 and Figure 6. For the Pt contamination, we can obtain the coverage from Figure 6 as a function of concentration. Additionally, for the ionomer contamination, we can predict the coverage as a function of the mole fraction of protons and cationic compounds (e.g., aniline-anilinium) from Figure 2.
Figure 10 shows that the voltage loss depends on three different sources of contamination, the electrode ionomer, the Pt/C coverage, and the membrane, and also shows that the ionomer and membrane contaminations dominate relative to the Pt contamination. These prediction curves can provide the each voltage loss by contamination for different sources in the electrode of PEMFCs, which is typically hard to obtain from in-situ performance curves. It appears that the ionomer and membrane contaminations dominate relative to the Pt contamination. For limited coverage (i.e., Θ < 0.36) by aniline, the impact of contamination on the ionomer is more critical than on the membrane, but the impact on membrane contamination becomes more important as the coverage increases (i.e., contamination continues). The voltage change according to membrane contamination depends on the RH at the channel, and the lower the RH, the greater the effect of contaminants. Note that, in contrast to sodium,83 aniline contamination yields voltage losses greater than 50 mV with RH = 60% and a coverage of 0.3 to 0.4. This RH is an average of the RH on the cathode using 32% of the inlet RH with 10 A operating conditions (0.2 A/cm2 in the 50 cm2 lab PEMFC cell). More broadly, from the tolerance prospective, the coverage by aniline on the Pt and the membrane (including the ionomer) needs to be controlled to less than 0.5 and 0.2, respectively, to maintain the voltage loss due to contamination less than 100 mV.
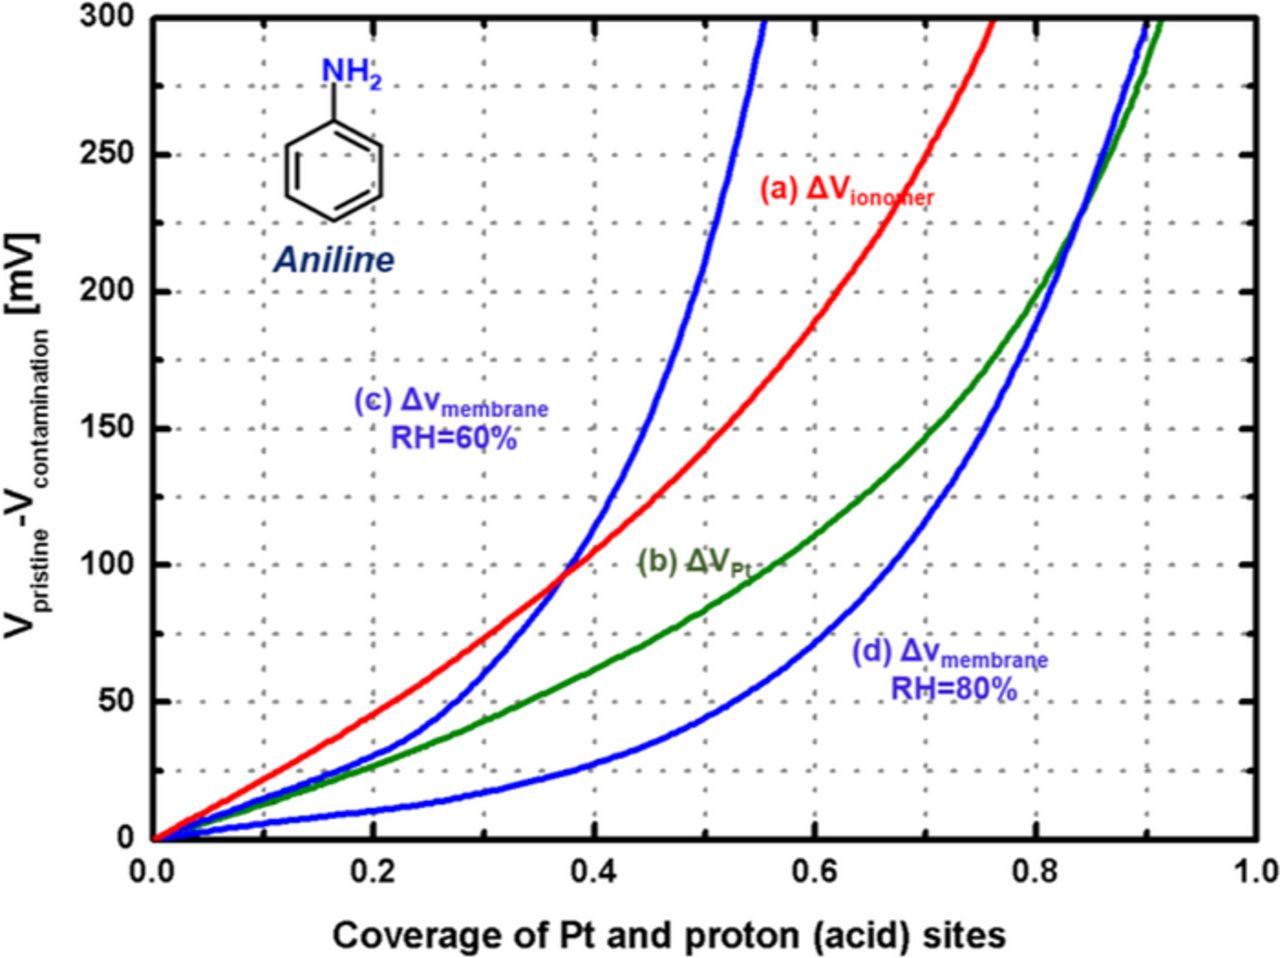
Figure 10. ΔV prediction curves for different contamination sources: Pt, ionomer, and membrane; I = 10 A, 50 cm2, 25 μm thickness membrane.
Break down voltage loss by contamination sources
Here, we discuss an example of how the ex-situ isotherms can be used for predicting in-situ voltage loss. For Pt contamination, before comparing ex-situ and in-situ ECSA loss, the contaminant concentration on the channel (i.e., in-situ) should be defined.
![Equation ([10])](https://content.cld.iop.org/journals/1945-7111/162/9/F1056/revision1/jes_162_9_F1056eqn10.jpg)
where  ;
;  ; R is the gas constant, 8314 [kPa cm3/mol K]; T is the temperature, [K];
  is the molar flow rate, [mol/s]; t = total, A = contaminant.
Note that the contaminant molar flow rate is negligible relative to the air and water flow. Thus, it is reasonable that aerosol contaminant infusion through a nebulizer could be assumed as a gas phase transport.
After a proper scaling method is applied to the ex-situ adsorption isotherm, the ex-situ liquid concentration and the Pt coverage corresponds to the in-situ gas phase concentration. For more details regarding the scaling technique, the reader can refer to the Refs. 53 and 82. Note that here the ex-situ concentration is multiplied by 40 (scale factor) to translate to the in-situ concentration, which is considering a case of 0.02 mg/cm2 of TFE-Pt loading on 0.254 cm2 of RDEs, and 0.4 mg/cm2 of electrode Pt loading of a 50 cm2 single cell. The Pt coverage prediction results compared to in-situ ECSA measurements are listed in Table III for the DEGEE contamination in Figure 9, and all results are comparable within an accuracy of 5%. In addition, the voltage loss can also be predicted using the prediction curve shown as line (b) in Figure 10.
Table III. Predicted ECSA, voltage losses by Pt and ionomer contaminations compared with in situ voltage loss (iR corrected); data shown in Figure 8.
| Measurements | Predictions | ||||||
|---|---|---|---|---|---|---|---|
| Contaminant concentration, CA (scaled) | ΔECSA/ | ΔECSA/ | △Vtotal, iR | △Vpt | △Vionomer | Ionomer | |
| ×10−9 [mol/cm3] | ex situ [%] | in situ [%] | corrected [mV] | [mV] | [mV] | coverage | |
| (a) | 1.66 (−66.3) | −40.0 | −42.3 | 125 | 61 | 64 | 0.27 |
| (b) | 0.33 (−13.3) | −21.0 | −24.1 | 91 | 28 | 63 | 0.27 |
| (c) | 0.34 (−13.6) | −23.6 | −26.0 | 80 | 32 | 58 | 0.25 |
The voltage loss for all cases shows an approximately 30–45% contribution from the Pt contamination. Therefore, we can speculate that the other 55–70% of voltage losses in DEGEE contamination derive from the ionomer and membrane. Assuming the HFR change derives from membrane contamination, 25% coverage of the ionomer's available proton sites would be predicted using the coverage-voltage prediction curve (i.e., predicts the coverage for the ionomer using ΔVionomer = ΔViRcorrected − ΔVPt). Interestingly, this prediction agrees with the results of membrane conductivity, as discussed in Figure 4. The membrane conductivity loss for 30%-contaminated Na+-form NRE211 agreed well with the conductivity loss for DEGEE-contaminated NRE211. Note that the NRE211 samples were soaked in 1 mM, 5 mM, and 50 mM, and the membrane conductivity loss for each case was equal within an accuracy of 3%. Additionally, the dominant contribution to performance loss from the ionomer and membrane contamination of DEGEE can account for the self-induced recovery as the DEGEE absorption depends on the concentration gradient of DEGEE between the channel and the MEA but is not a function of dosage as discussed above.
Conclusions
The effects of contamination by organic model compounds derived from the fuel cell BOP components' (e.g., assembly aids, structural plastics, hoses) such as 2,6-DAT, 4-MBSA, BzOH, aniline, DEGEE, and DEGMEA on performance in PEMFCs were examined using ex-situ and in-situ methods. The CVs and adsorption isotherms of Pt/C show greater coverage for aromatic ring compounds than aliphatic compounds, dependent on the concentration. In particular, when using amine-containing compounds, an ion-exchange reaction can occur in the Nafion membrane and ionomer in the electrode, causing significant voltage loss through a decrease of the number of available proton sites on the membrane. Model compounds lacking amine groups also show ionomer and/or membrane contamination due to the concentration gradient formed by absorption mechanisms, but the loss is reversible by self-induced recovery. Furthermore, ex-situ isotherms and conductivity measurements allowed the voltage loss to be quantified, as well as predicting coverage by contamination. The voltage loss due to ionomer and membrane contaminations was shown to be a more significant contributor to performance loss than Pt contamination.
Acknowledgments
The authors gratefully acknowledge financial) support for this work by the DOE (DE-AC36-08GO28308) under a subcontract from NREL (ZGB-0-99180-1) to the University of South Carolina. The authors would also like to acknowledge Dr. H. N. Dinh for interesting discussions on the results. Dr. S. Park read the manuscript and provided useful comments.
Appendix: Comparison of Different Types of Nafion Membranes used in Experiments
| Test | Type of membrane | Thickness [μm] | Available capacity [meq/g] | Remark |
|---|---|---|---|---|
| Membrane sorption isotherms | N115 | 127 | 0.95–1.01 | Equal acid capacity. |
| Conductivity measurement/ ATR-IR spectrum analysis | NRE211 | 25 | 0.95 | The conductivity is a function of available acid capacity of the membrane. Also it was found that the conductivity increases almost linearly with membrane thickness.86 |
| Water uptake | N117 | 183 | 0.95–1.01 | The water uptake (λ) in membranes show consistency at water vapor activity less than 0.6 regardless of thickness.49 |
| In situ infusion single cell | MEA (NRE 211) | - | - |
Footnotes
- b
Since ORR mechanism is governed by H2O and H2O2 formation, this model including only 4-electron pathway mechanism on ORR may produce inaccuracies for contaminants that showed 2-electron pathway (O2 reduced to H2O2) mechanism on ORR.