Abstract
Ionomer membranes used to separate the electrodes in polymer electrolyte fuel cells are known to degrade both chemically and mechanically during regular fuel cell operation and may ultimately result in lifetime-limiting failure. The objective of the present work is to understand the effects of combined chemical and mechanical stresses on the mesoscale morphology of the membrane and its role in the overall degradation process. The mesoscale effects of sulfonic acid group loss and fluoride release on the phase segregated morphology of the membrane are analyzed using contrast-enhanced transmission electron microscopy and energy dispersive X-ray spectroscopy. The end-of-life ionic domain size of the ionomer is shown to be substantially enlarged compared to the pristine membrane state. Elemental mapping overlayed with the binary ionic and non-ionic morphology reveals mesoscopic void regions in the degraded material that are depleted of ionomer fluorine and carbon and considered susceptible to micro-crack initiation. A larger, severely degraded void region is also identified which contains evidence of hygrothermal stress induced localized ionomer crazing as a potential nucleation site for macroscopic fracture development. The synergetic effects of chemical and mechanical degradation on the progressive changes in the observed mesoscale morphology are discussed.
Export citation and abstract BibTeX RIS

This is an open access article distributed under the terms of the Creative Commons Attribution Non-Commercial No Derivatives 4.0 License (CC BY-NC-ND, http://creativecommons.org/licenses/by-nc-nd/4.0/), which permits non-commercial reuse, distribution, and reproduction in any medium, provided the original work is not changed in any way and is properly cited. For permission for commercial reuse, please email: oa@electrochem.org.
Cost effectiveness, durability, and efficient performance are the essential requirements to be met for the commercialization of fuel cells.1 The properties of all key components comprising the fuel cell stack such as bipolar plates, gas diffusion layers, catalyst layers, and ion conducting membrane play a vital role in building the efficient and durable fuel cell system.2 One of the susceptible components responsible for the failure of polymer electrolyte fuel cells (PEFCs) is the ionomer membrane which conducts protons and separates the electrodes. The essential requirements of a standard fuel cell membrane are high proton conduction, good mechanical, chemical, and thermal stabilities, and low gas permeability. The most widely used electrolyte in PEFCs is the perfluorosulfonic acid (PFSA) ionomer membrane. The structure of the PFSA ionomer consists of hydrophobic tetrafluoroethylene main chains with periodic side chains terminated with hydrophilic sulfonic acid groups. When hydrated, the PFSA membrane exhibits a phase segregated network of ionic, water-filled hydrophilic domains which are necessary for enhanced proton conduction and non-ionic backbone dominated hydrophobic domains which are critical for the structural integrity of the material. The morphology of PFSA membranes can be studied using transmission electron microscopy (TEM), which is a direct imaging technique. The dehydrated morphology of a Pb2+ ion-exchanged membrane viewed under the electron column has revealed phase-separated, dark hydrophilic ion-rich domains and bright polytetrafluoroethylene (PTFE)-like backbone domains.3 Recently, 2D and 3D images of PFSA ionomer were also reported using cryo TEM tomography.4 The membrane transport properties which are crucial for efficient fuel cell operation depend on the morphology of the membrane.5,6 Apart from transport properties, the mechanical stability of the membrane also depends on the balanced interaction between hydrophilic domains and fluorocarbon backbone. Hence, characterizing the geometrical shape, size, and distribution of hydrophilic clusters is the most sought-after information for a better understanding of the transport properties of PFSA membranes.7 The overall performance and durability of the PEFC also depend on the morphology of the membrane employed.
Regular duty cycle fuel cell operation leads to chemical, mechanical, and thermal stresses in the membrane. The primary source of membrane degradation is chemical degradation of the ionomer molecules due to reactive radical species. Radical species such as •OOH and •OH generated through chemical and electrochemical routes have been observed to attack the side chain of the ionomer and release fluoride ions from the ionomer matrix.8–11 The second type of stress encountered in an operating fuel cell is the mechanical stress, which originates due to compression, humidity cycling, and inhomogeneous features of the membrane electrode assembly through the mechanisms of fatigue and creep.12–16 Thermal stress mainly acts as an accelerator of chemical and mechanical degradation provided that the temperature is kept within the design specifications of the membrane. In order to develop durable fuel cells and operating protocols with mitigated degradation rates, a thorough fundamental understanding of the various degradation mechanisms is essential.
Chemical membrane degradation can be characterized using solid state fluorine nuclear magnetic resonance (NMR) which has revealed substantial changes in the ionomer molecular structure.8,17 Chemical degradation of the PFSA ionomer proceeds with the initial attack of the C-S bond in the sulfonic acid end group by hydroxyl radical.8,10 With further attack of •OH radicals, the degradation progresses along the side chain to the C-F branch point in the main chain and leads to main chain scission, unzipping, and ionomer fragment release.10 As carboxylate concentration increases with chain scissions, the fraction of end group degradation will increase with time.18 The effect of in situ mechanical degradation was found to have prominent effect in bringing degradation features such as micro-cracks through mechanically weaker catalyst layers and propagate into the membrane during cyclic operation.19 Combined chemical and mechanical degradation in a CCM led to increased stiffness and brittleness with possible local variations in properties from a tensile test experiment.12 Reduction in molecular weight and disentanglement was inferred to cause the observed changes.12,17 The combined chemical and mechanical degradation resulted in failure modes based on physical damages such as cracks, delamination, and membrane thinning.17 The proton conductivity was found to decrease with in situ degradation of PFSA membranes,20 since the proton transfer occurs through the formation and breaking of hydrogen bonds, which is a strong function of the size and connectivity of the hydrophilic ionic domains.21 The in situ degraded ionomer structure was found to undergo thermal decomposition at a lower temperature owing to the weakened ionomer structure.20 Overall, the molecular effects of chemical degradation and the physical macroscopic effects of mechanical degradation are well documented. However, the critical interaction of the chemical and mechanical degradation processes through the intermediate mesoscopic scale has not yet been determined. The fundamental understandings of materials from in situ tests and its correlation to the applied aspects of the same experiment are difficult to be pursued due to many interfering factors22 and hence are rare in the literature. The present study intends to explore the effects of degradation on the ionomer morphology from an in situ degraded membrane and to investigate benchmarks for durable materials for PEFCs. Part of the motivation of this work is to gather information at a mesoscale perspective in order to aid interpretation of previously reported macroscale and bulk results on the global membrane degradation and water uptake changes.17,20
The objective of the present work is therefore to determine the effects of the membrane molecular level degradation on the mesoscale morphological changes and its relation to the affected physico-chemical properties due to coupled chemical and mechanical degradation. The results from this study are expected to bridge the gap between the known molecular degradation mechanisms and mesoscale degradation effects which eventually lead to membrane failure in an operating PEFC. This could provide an empirical description of the complex interaction between the internal degradation stressors and overall durability of the fuel cell membrane, which is essential for the ongoing growth in commercialization of reliable PEFC technologies.
Experimental
In situ degradation protocol
A commercial non-reinforced PFSA ionomer membrane in the protonic form was used in this work. Research-scale fuel cell stacks with membrane electrode assemblies (MEAs) fabricated from the same PFSA membrane with catalyzed gas diffusion electrodes (GDEs) were prepared. In order to evaluate the effects of combined chemical/mechanical stressors on the durability of the membrane, an in situ cyclic open circuit voltage accelerated stress test (COCV AST) was applied. The COCV AST exposed the membrane/MEA to periodic chemical and mechanical stresses through open circuit voltage hold at high temperature, elevated oxygen concentration, and low relative humidity and alternating wet/dry cycles, respectively (Figure 1), until membrane failure occurred. The fuel cell stacks were operated on an automated test station, consisting of fully computer-controlled mass flow controllers, back pressure regulators, preheated water circulating coolant loops, and electronic load. In the wet period, the inlet gases were oversaturated by injecting water into the evaporator type humidifier in an amount excess than that required attaining the saturated vapor pressure. In the dry period, the inlet gases were kept in a relatively dry state by closing the water supply pumps of the humidifiers. The stack was subjected to a beginning-of-life (BOL) conditioning procedure for initial electrochemical activation of the MEAs by applying a medium current density in pure hydrogen at the anode and air at the cathode. Further information on the fabrication and assembly as well as a set of in situ and ex situ diagnostics can be found in our previously published article by Lim et al.17 which utilized the same methodology. Partially degraded MEA samples were extracted from the AST stack after the 2nd, 5th, 8th, and 10th cycles for further analysis. A hydrogen leak rate indicative of stack failure represented the end-of-life (EOL) of the MEAs which occurred after ten cycles. The MEA samples were taken from the inlet region, which experienced the most aggressive conditions for degradation.
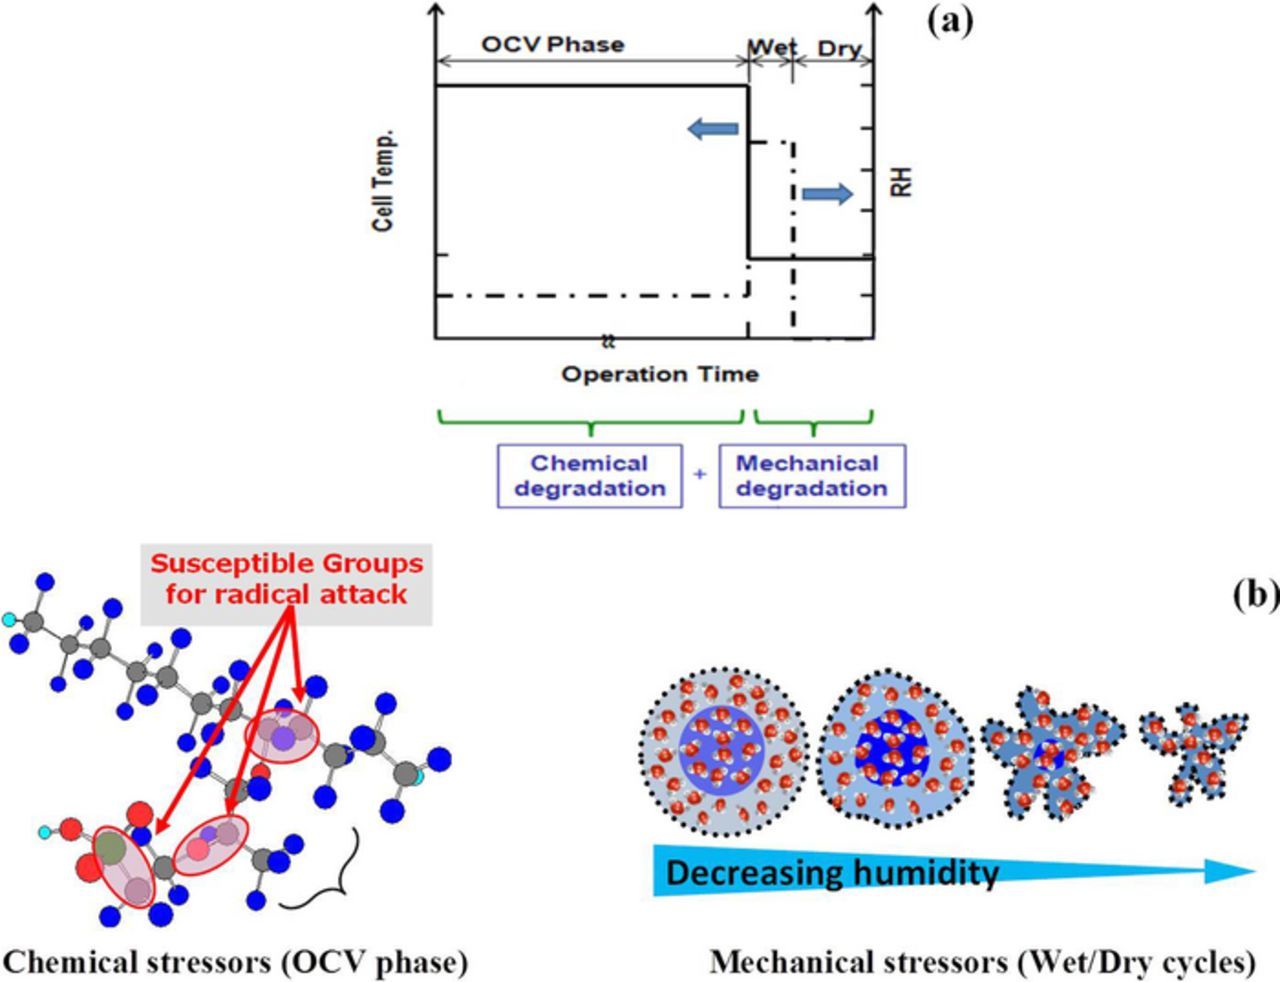
Figure 1. Graphical illustration of (a) the cyclic open circuit voltage accelerated stress test (COCV AST) and (b) its induced chemical and mechanical stressors on the membrane.
Imaging
Catalyst coated membrane (CCM) samples were carefully extracted from the partially degraded MEAs and stained in saturated lead acetate solution for about 48 hours in order to increase the electron image contrast of the ionic clusters by ion exchange of Pb2+ at the protonic sites. Due to the strong adhesion between the CCM component materials, the catalyst layers were not removed from the membrane, thus avoiding potential physical damage to the membrane during sample preparation. The CCM samples were then rinsed with water to remove excess lead, dried at room temperature, embedded in epoxy, and sliced into 70–90 nm sections using a Leica EM UC6 ultramicrotome instrument. The slices were collected onto Cu grids for imaging, with the cross section of the membrane exposed to the electron beam. A pristine PFSA ionomer membrane was used as a control sample and pre-processed similar to CCMs for imaging. High-resolution transmission electron microscopy (TEM) was performed on these samples using an FEI Tecnai Osiris TEM instrument equipped with a Gatan Ultrascan 1000XP-P 2k x 2k pixel charge-coupled device (CCD) camera. The images were recorded at an accelerating voltage of 120 keV by engaging the objective aperture for increased contrast. This relatively low E-beam energy was found to be favorable in order to minimize imaging artifacts. Micrographs from pristine and degraded membranes obtained using the Osiris TEM instrument were used for quantitative analyses. Additional images for qualitative analysis of partially degraded CCMs were obtained using a Hitachi 8100 TEM instrument equipped with a Gatan Multiscan 1k x 1k pixel CCD camera. Characteristic X-rays generated by the electron impact on the sample were captured for elemental mapping using a Gatan Ultrascan CCD camera equipped with analytical TWIN (A-TWIN) objective lens integrated with Super-X energy dispersive X-ray (EDX) detection system based on silicon drift detector (SDD) technology. The microanalyses of the acquired EDX spectra were carried out using Quantax Esprit 1.9 software from Bruker instruments. Since the micrographs and elemental maps were obtained by projecting X-ray signals from a thin slice of the sample, the information obtained represented the scenario throughout the entire thickness of the slice.
Results and Discussion
The present work aims to understand the mesoscale morphological evolution occurring in fuel cell membranes due to conjoint chemical and mechanical degradation implemented using a cyclic open circuit voltage accelerated stress test (COCV-AST). The localized effects of sulfonic acid group loss and fluoride release on the phase separated morphology of the membrane were investigated using a direct imaging approach for the first time. The local chemical and mechanical conditions favoring the initiation and propagation of micro-cracks were examined.
Micrographs of pristine and degraded membranes
Figure 2a shows a representative bright field TEM micrograph obtained for the pristine PFSA ionomer membrane which features micro phase separated morphology of uniformly distributed ionic and non-ionic domains. Since the protonic sites in the membrane were exchanged with Pb2+ ions, the dark regions indicate ion-rich hydrophilic domains and the bright regions indicate non-ionic, hydrophobic fluorocarbon main chain domains. The ion-rich domains are randomly distributed in small pockets defined by the surrounding structural matrix of the fluorocarbon backbone phase. The statistical treatment of the image through the domain area distribution plot is presented in Figure 2b. Binary phase segmentation and domain area calculations were performed using ImageJ (with details provided in the Appendix) and the average hydrophilic domain area was found to be approximately 7.5 nm2. The images obtained are in close agreement with previously reported images of similar membrane materials.7,23,24 Furthermore, the obtained absolute morphology result was reproducible on different pristine samples on different days using the same sample preparation and imaging techniques. It is thus expected that major alterations in morphology arising from degradation can be captured by this approach.
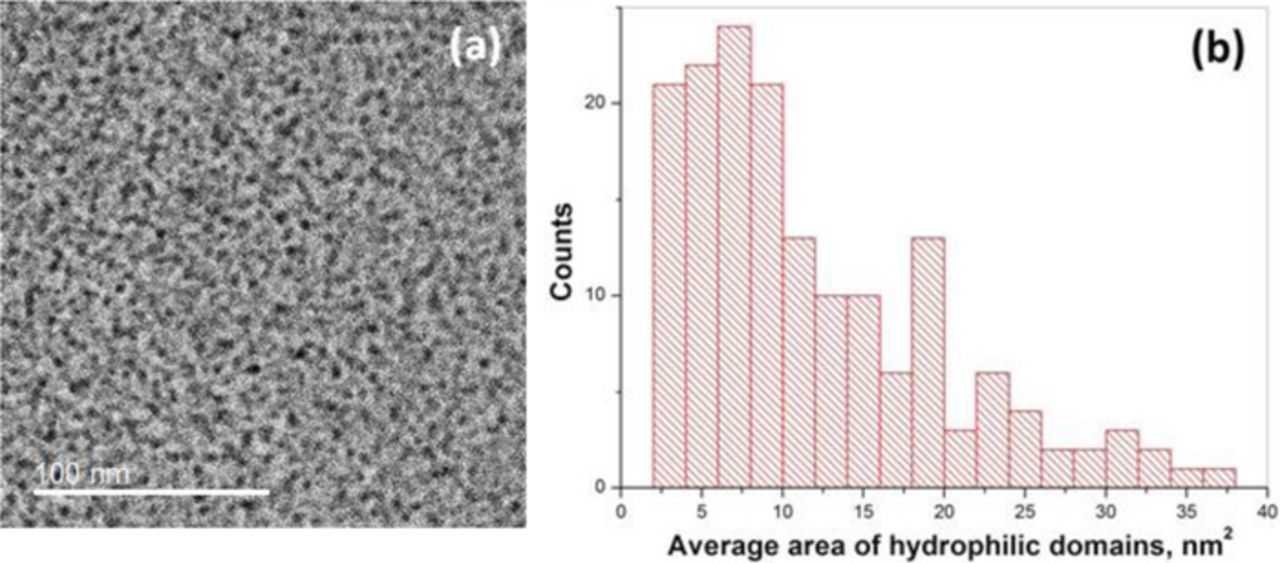
Figure 2. (a) TEM micrograph of a pristine PFSA membrane showing random distribution of dark ion-rich regions and bright tetrafluoroethylene regions and (b) statistical distribution of average hydrophilic (dark) domain area.
Figure 3 provides a collection of bright field TEM images observed for two typical regions of the partially degraded membranes from conjoint chemical and mechanical degradation using the COCV-AST protocol. Three different stages of degradation are shown (from top to bottom): two, five, and eight AST cycles. For reference, end-of-life (EOL) failure was reached after ten AST cycles. The same sample preparation and imaging procedures, including Pb staining, were applied in all cases; hence, any change in the morphology compared to the pristine membrane (Figure 2) was due to the degradation stressors rather than imaging artifacts. The two typical regions identified in Figure 3 represent regular morphology (a-c) present in the membranes after two, five, and eight AST cycles and special features related to local membrane degradation (d-f) after the same numbers of cycles. Notably, considerable variation in local morphology can be observed by comparing the images of the two regions. Though the regions exhibiting regular morphology were exposed to severe degradation stressors, the morphology of these regions were found to resemble the regular morphology of the pristine membrane, representing the bulk (overall) characteristics of the ionomer, whereas the regions exhibiting local degradation features were observed to deviate from the original membrane morphology, even at the early degradation stages. The extent of structural degradation as a result of radical attack and hygrothermal stress is expected to have perturbed the local morphology at the degraded sites. Apart from these special features observed due to local degradation, the images obtained after two and five AST cycles did not exhibit major morphological differences in other areas when compared to the pristine morphology. The relatively minor local degradation feature identified after two AST cycles shows a sudden disruption (encircled) in the phase-separated morphology that may have been initiated by locally elevated radical attack and resulting loss of functional groups associated with a local defect or contamination in the membrane or adjacent electrodes (Figure 3d). At this stage, however, the membrane largely appears to withstand the effect of initial degradation. After five AST cycles, though most of the membrane area still exhibited regular morphology, a qualitative feature observed in some locations exhibits an increase in the ordering and long range formation of ion-rich domains, which differs from the pristine morphology. The long range ordering of ionic domains may be due to the permanent deformation and creep resulting from the induced mechanical stresses acting on chemically weakened ionomer domains (Figure 3e). Similar effects of polymer chain alignment along the direction of applied tensile force are a commonly observed phenomenon in the literature,25 although it has not been previously shown for fuel cell membranes. At this stage of degradation, the membrane has already lost a substantial amount of fluoride from chemical degradation initiated from the side chains of the ionomer17 and hence affecting the functional groups, the loss of which is associated with decay in mechanical strength.12 After a significant effect of degradation exerted upon the membrane through subsequent AST cycles, the radical attacked regions are believed to have lost a large portion of the sulfonic acid end groups, which can influence the local phase-separated ionomer structure. Interestingly, the membrane subjected to eight AST cycles revealed a relatively large non-ionic feature in the severely degraded region that resembles the presence of a hollow, void space in the membrane slice (Figure 3f). This is believed to be a result of more mature local degradation under the auspices of combined chemical and mechanical degradation,17 where the chemical degradation is expected to have propagated from the side chain onto the main chain of the ionomer (i.e., also affecting the hydrophobic backbone domain), hence enabling a longer range of local morphological changes in the ionomer structure. Such regions may ultimately lead to the formation of pinholes, which were previously observed to be ∼100 μm in diameter and occur at the frequency of five holes per 3 cm2 survey area at the EOL state.17 However, the fine resolution of the present imaging technique is unable to resolve such 'large' scale features.
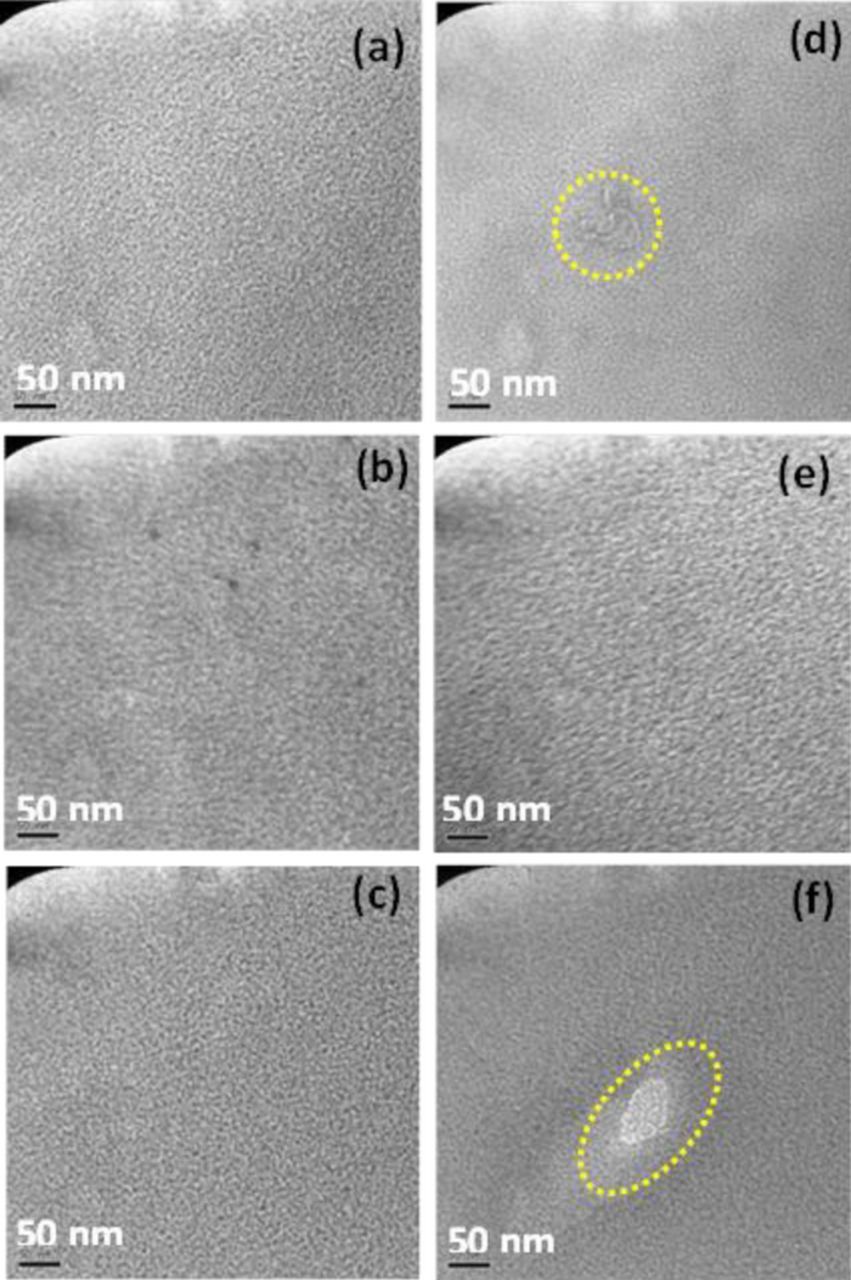
Figure 3. TEM micrographs of partially degraded membranes subjected to (a,d) two, (b,e) five, and (c,f) eight COCV AST cycles. (a-c) represent regions exhibiting regular ionomer morphology while (d-f) show specific features related to local degradation.
Figure 4a shows a bright field TEM micrograph of a typical membrane region at the EOL state. This image features regular ionomer morphology and a specific region (encircled) having reduced concentration of ion-rich domains essentially due to locally elevated chemical degradation. The morphology of the pristine membrane exhibited irregularly shaped ionic domains with low connectivity (Figure 2), whereas the morphology of the EOL membrane was found to have more spherical and highly networked ionic domains (Figure 4) which is believed to be an effect of bulk membrane degradation. These scenarios were observed irrespective of the imaging position across the membrane and are prevalent at the EOL stage. Statistical treatment was applied to the overall membrane structure, excluding the locally degraded zone in order to capture globally relevant effects. Figure 4b presents the obtained hydrophilic domain area distribution at end-of-life. It was inferred from these data that the average size of the hydrophilic domain areas in the selected region had undergone an increment of ∼16% compared to the pristine membrane. The calculated domain area distribution becomes bimodal at the EOL stage and a substantial increase in the number of domains in the range of 10–25 nm2 was observed, in contrast to the smaller domain areas in the pristine ionomer. This was accompanied by a net increase in the hydrophilic domain fraction observed in the image from roughly 15% at BOL to 20% at EOL. These results suggest that the advanced stage of chemical degradation affecting both main and side chains of the ionomer (as evidenced by high fluoride release and membrane thinning) may have reduced the hydrophobic domain size, while the loss of sulfonic acid functional groups could lead to weaker local ionic interactions and hence an increased hydrophilic domain size. Thus, the overall collection of hydrophilic domains in the image appears larger compared to the pristine morphology. These results demonstrate the influence of global chemical degradation on the bulk membrane structure, in addition to the locally elevated degradation exhibited by the regions with special features. The findings are in agreement with previously reported ionomer mass normalized water uptake data, which indicated a sharp increase from eight AST cycles to EOL.20 It is hence expected that the enlarged hydrophilic domains are filled with water during humidified conditions such as those prevalent during fuel cell operation.

Figure 4. (a) TEM micrograph of the end-of-life membrane subjected to conjoint chemical and mechanical degradation. The encircled area indicates locally elevated chemical degradation. (b) Statistical distribution of the average hydrophilic (dark) domain area.
Local degradation effects observed by elemental mapping
Elemental mapping was performed on the degraded zones in order to determine the chemical state of the previously observed local degradation features. In this technique, the electron beam was focused on the area of interest and scanned across the material to generate characteristic X-rays of each element. Figure 5 shows (a) the micrograph of a representative, severely degraded zone at the EOL state, along with its (b) high-angle annular dark field (HAADF) image and corresponding elemental maps of (c) Pb, (d) F, (e) C, and (f) O. The HAADF mode is sensitive to the average atomic number of the electron scatterer and can therefore illustrate the effects of chemical degradation with improved Z-contrast and without diffraction effects. In the dark field image, the regions of the specimen which transmit electrons appear dark while those that scatter appear bright. In the present case, the dark region represents significant loss of ionomer material in the two hollow, dark areas in Figure 5b. This is expected to be associated with regions depleted of side chains carrying the sulfonic acid groups. Hence, the elemental map of Pb is presented in Figure 5c which was used to exchange protons with heavy Pb2+ ions at the sulfonic acid group sites. It shows a reduced concentration of Pb at the two locally degraded areas which indirectly reveals missing sulfonic acid groups due to side chain scission by radical attack. Since the PFSA ionomer is predominantly comprised of fluorine, carbon, and oxygen in the main and side chains, chemical maps of these elements at the severely degraded site are also presented. Figure 5d indicates the absence of fluorine element due to severe fluoride release at the two hollow areas. The carbon map (Figure 5e) further reveals the loss of carbon to a similar extent in these two areas.17 The elemental map of oxygen presented in Figure 5f shows a similar trend of oxygen loss, albeit with a lower contrast compared to carbon and fluorine in the local areas. The similarity of the oxygen and Pb patterns suggests a presence of residual water in the remaining hydrophilic domains, mainly located in the mildly degraded regions rather than at the hollow, severely degraded areas. The oxygen map could also potentially indicate the presence of terminal carboxylic acid groups appearing due to side chain degradation induced main chain cleavage at advanced stages of chemical degradation.10,11 Overall, the two hollow areas identified in these images are likely to have experienced an advanced stage of chemical degradation, involving both side chain and main chain decomposition, thus creating small essentially void features that may potentially grow further into macroscopic damage features such as micro-cracks and pinholes normally observed by SEM based failure analysis of EOL membranes.
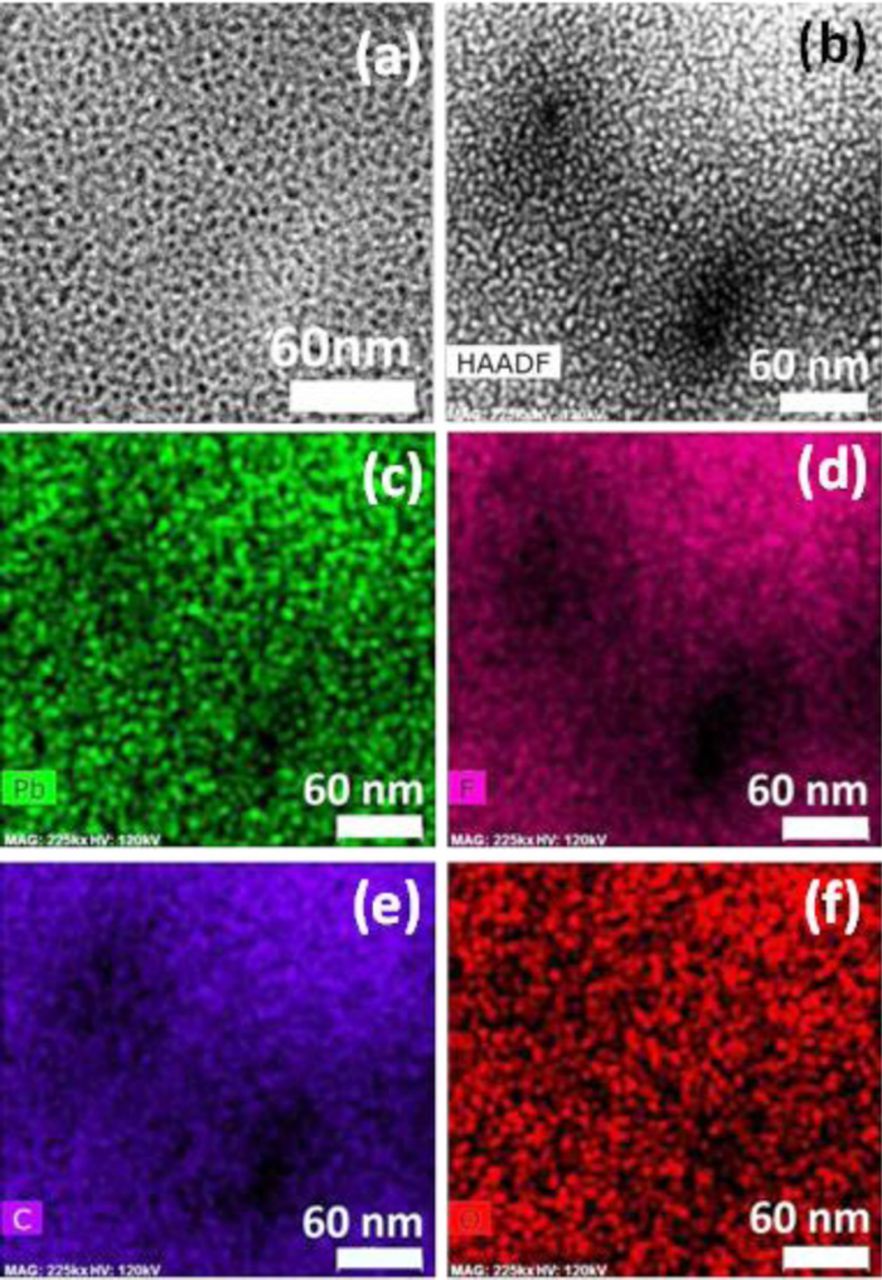
Figure 5. Analytical imaging of a locally degraded region in the end-of-life membrane: (a) regular TEM micrograph; (b) HAADF image; and (c-f) elemental maps of (c) lead, (d) fluorine, (e) carbon, and (f) oxygen.
Apart from the observed morphological changes, another feature observed in the degraded membranes was a layer of nanocrystals of platinum generated close to the cathode. In the degraded MEAs, it is a common phenomenon that platinum in the cathode catalyst layer dissolves and deposits inside the membrane. Many contrasting results were also seen in the literature due to platinum in the membrane (PITM), which arises mainly due to the different sizes, geometry, and distribution of the particles. However, PITM was found to mitigate chemical membrane degradation through rapid decomposition of hydrogen peroxide formed during the oxygen reduction reaction.26,27 Here, a visible platinum band first appeared in the membrane after eight AST cycles, close to the EOL state. Hence, the status of membrane health near the platinum protected region was difficult to diagnose. Further study about PITM is beyond the scope of the present work and can be found elsewhere.26
Micrographs of degraded and fractured membrane zones
Though concurrent effects of chemical and mechanical stresses are difficult to distinguish, physical damage such as cracks and pinholes are considered to be induced due to mechanical stress acting on weakened membrane regions due to chemical degradation.12,17,26 Apart from the formation of chemically degraded locations in the membrane discussed in the previous section, other regions were found to undergo long range ordering of ion-rich domains until end-of-life. This could be perceived as mechanical stress induced morphological change28 which is acting throughout the area of the membrane during the wet/dry cycles of the COCV-AST. Meanwhile, radical attack on the bulk membrane takes place throughout its area during the OCV phase, which was evident from the TEM images at EOL as well as from the global membrane thinning reported previously.17 Notably however, as new carboxylate end groups are formed during advanced stages of chemical degradation, the fraction of end group mediated radical attack at main chain sites is likely to increase over time. The gross loss of ionomer in the observed void areas is consistent with main chain, carboxylate-mediated degradation. Due to the 'hollow' nature of these chemically degraded areas, the local mechanical stress may be exacerbated around the perimeter of the site, thus further expanding the damage. Furthermore, chemical membrane degradation was previously found to increase the brittleness of the membrane during ex situ tensile testing,12 which indicates that the chemically degraded structure is more susceptible to damage propagation under mechanical stress. It is noteworthy however that the macroscopic hydrogen leak carrying holes observed by SEM are essentially three orders of magnitude larger in scale than the hollow areas observed in the previous section, which warrants further analysis on damage propagation. Indeed, the present TEM analysis of the EOL membrane revealed a larger damage feature than those previously discussed, as shown in Figure 6a. This void feature is on the order of 1 μm in size, and is surrounded by several smaller hollow voids, which is indicative of local crazing around the edges. A magnified image captured from the edge of the void (Figure 6b) revealed a fibrillary ionomer structure which is most likely a result of mechanical stress applied to a chemically degraded area that stretches out the remaining ionomer strands during the process of damage growth. Another interesting observation from this image is the small micro-crack being initiated at the edge of the ionomer fibril at a specific site of low concentration of ionic clusters, which indicates that small cracks may propagate preferentially from chemically degraded regions (Figure 6b). The direction of crack propagation is also found to be along the direction of low concentration of ionic clusters, which is more distinctly shown in the supporting image in Figure 6c. These regions are likely to possess weak interaction between the constituent polar and non-polar phases due to chemical degradation and could favor mechanical fracture along this direction. In general, it is inferred that the mechanically yielding ionomer fibrils exhibit low concentration of hydrophilic domains. The severe side chain loss that caused a low concentration of ion-rich domains is likely to initiate the crack formation which is evident from the micrograph as shown by the arrows in Figure 6.
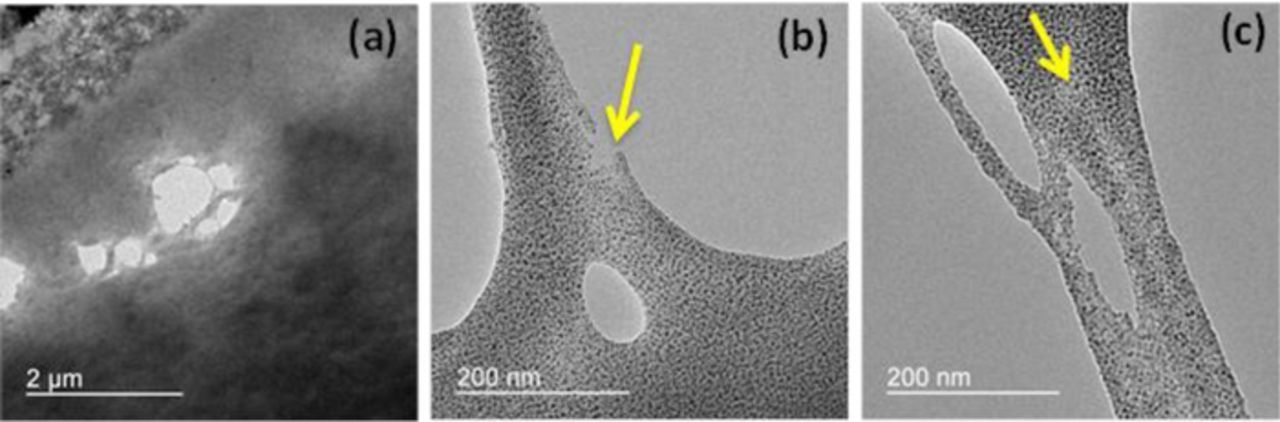
Figure 6. TEM micrograph of the end-of-life membrane showing (a) a local void site in the membrane, (b) a micro-crack initiation site in an ionomer fibril, and (c) local crack propagation along the low ion concentration direction (as indicated by the arrows).
Overall, the observations in these images suggest that the conjoint chemical and mechanical degradation mechanism proceeds with the formation and coalescence of mesoscopic voids to form a fracture. Such fractures could eventually propagate under mechanical stress into membrane-spanning cracks and pinholes observed macroscopically.17,26 Imaging of macroscopic damage evolution would however require alternate techniques with higher field of coverage than TEM, which is subject to future work.
Conclusions
This work contributes important knowledge on the mesoscale morphological effects of conjoint chemical and mechanical degradation of PFSA ionomer membranes in fuel cells. The progression in the morphology of the membrane was analyzed from beginning-of-life (BOL) to end-of-life (EOL) using contrast-enhanced transmission electron microscopy and energy dispersive X-ray spectroscopy. The microstructure of the membrane was found to be strongly influenced by its degradation history. The bulk membrane morphology was largely intact until advanced stages of degradation at which a significant increase in the hydrophilic domain fraction and the associated average domain area was observed. This global change was underpinned by substantial ionomer molecular decay due to severe chemical degradation affecting both side chains and main chains as evidenced by fluoride release and membrane thinning. Most notably however, the obtained micrographs indicated elevated localized membrane degradation due to the combined action of chemical and mechanical stresses, which is believed to initiate the development of macroscopic membrane damage which is ultimately the culprit for membrane failure due to hydrogen leaks. The elemental maps revealed the absence of fluorine at the locally degraded zones along with reduced concentrations of carbon and oxygen, thus comprising an essentially hollow space with little to no ionomer material available at the core. From the micrographs, the evidence of ion-cluster voids which could develop to micro-cracks was found at advanced degradation stages. The micrographs of degraded membranes revealed initial, localized crazes that propagate preferentially along the direction of low concentration/absence of ion-clusters under the influence of mechanical (or hygrothermal) stress. Overall, the results of this work provide a bridge in terms of the mechanistic understanding of mesoscale morphological changes in the membrane, from molecular changes through locally elevated mesoscopic void formation and micro-crack initiation under mechanical stress to fracture propagation which is believed to be the underlying effect for local macroscopic damage and eventual membrane failure. The new insight on the degradation dependent mesoscale structure of the membrane and its correlation to the deteriorating fuel cell characteristics is expected to be useful for the development of more durable membrane materials and fuel cell durability mitigation strategies, and can also contribute to predictive membrane durability models for fuel cell applications.
Acknowledgments
Funding for this research provided by Automotive Partnership Canada and the Natural Sciences and Engineering Research Council of Canada is gratefully acknowledged. Ballard Power Systems is acknowledged for providing material samples, access to the experimental facilities, and technical support. The authors gratefully acknowledge Timothy J. Peckham and Xin Zhang at Simon Fraser University (SFU) for insightful technical discussions. This work made use of the SFU 4D LABS shared facilities supported by the Canada Foundation for Innovation, British Columbia Knowledge Development Fund, Western Economic Diversification Canada, and SFU.
Appendix: Binary Phase Segmentation of Micrographs for the Calculation of Average Ionic Domain Area
The TEM images were taken from the center of the membrane in order to represent the bulk membrane morphology and avoid interferences from the catalyst layer interfaces. The BOL and EOL images were analyzed using ImageJ software for the average area of hydrophilic domains. The average domain area was calculated from the binary hydrophobic/hydrophilic images by assuming a threshold value for segmentation of the TEM images obtained at the BOL and EOL stages. From the sensitivity analysis, it was found that the threshold value is a sensitive parameter in calculating the average domain area. For any threshold value selected, the average domain area for the EOL membrane was always higher than at BOL, as shown in Figure A1. The threshold value set at 96 was empirically found to completely cover the hydrophilic area in the BOL membrane, and hence the same was selected for EOL membrane image analysis as well (Table A1). Two different regions of the same image were selected to carry out the domain area analysis.
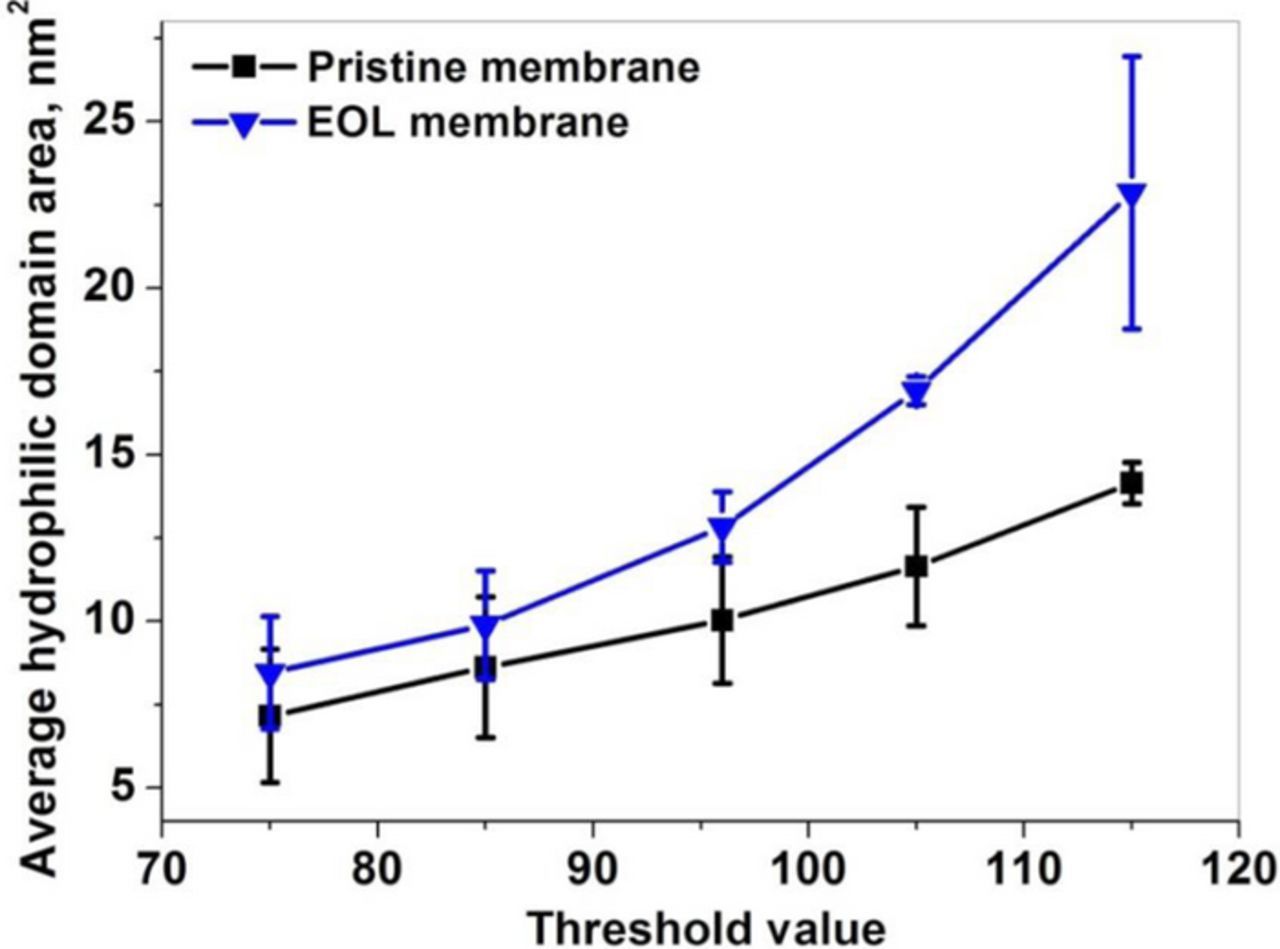
Figure A1. Sensitivity analysis carried out on the BOL and EOL membrane images for various threshold values.
Table A1. Image analyses for BOL and EOL membranes.
| Survey area, x104 nm2 | Total highlighted hydrophilic domain area, x104 nm2 | % Area | Domain count | Avg. size, nm2 | |
|---|---|---|---|---|---|
| BOL | 1.30 | 0.19 | 15.0 | 164 | 11.9 |
| EOL | 1.04 | 0.20 | 20.1 | 151 | 13.9 |
Domain areas from 3 nm2 to 40 nm2 were considered. This is based on previous reports on the size of hydrophilic domains considering circular cross sectional area.7 Hence, any domains less than 3 nm2 could be due to image noise and domains above 40 nm2 could be an artifact due to the application of thresholding, and the corresponding hydrophilic cluster diameter tends to be impractical.7