
Abstract
A mathematical model was developed to study the voltage behavior of LixNi0.5Mn1.5O4(LNMO) electrode at particle scale. The phase transition process of Li1 → Li0.5 → Li1 in spinel LNMO was modeled by Avrami equation, which was incorporated into lithium transport process in the particle. By simulating the charge and discharge process, numerical results indicated that phase distributions in the LNMO particle are different between charge and discharge at the same SOC condition, which can lead to different capacity utilization in practical battery operation. Results of average phase fractions also qualitatively demonstrated the existence of path dependent behavior of phase transformation inside LNMO electrode, which can be attributed to the competition between diffusion and phase transformation. The path-dependent behavior at different SOC conditions were then studied. Results show that longer phase change time can result in more capacity utilization. The relaxation impact was investigated at last. Numerical results showed that the path-dependence behavior can be reduced by long relaxation, and this is because phase transformation reactions take place during the relaxation period and eventually can reduce the path-dependence effect.
Export citation and abstract BibTeX RIS
High voltage LixNi0.5Mn1.5O4 (LNMO) spinel is an attractive cathode material for next-generation, high energy density Li-ion batteries.1–4 One of the issues challenging the implementation of LNMO is its flat potential wherein the voltage is invariant with state of charge (SOC) in the charge or discharge operations. This is believed to be originated from its two consecutive phase transition processes in the charge and discharge process.5–10 In our Part I (experimental study),11 we conducted a series of experiment to explore the LNMO voltage behavior at the particle scale, and had demonstrated the existence of path-dependence character of LNMO electrode. In this Part II (mathematical modeling), our objective is to develop a continuum model that accounts for the presence of these observed SOC dependent and time dependent character of LNMO electrode voltage behavior at the particle scale.
Modeling approach, as a complement to experimental investigation, can effectively reveal the processes and mechanisms accounting for electrode voltage behavior. In this study, a spherical LNMO particle is applied as the computational domain to provide insight into the nature of the electrode voltage hysteresis behavior. Rather than assuming infinite phase change rates,12 our modeling approach assumes a limited reaction rate of phase change process by using Avrami equation,13,14 and incorporates phase transformation process into lithium insertion and de-insertion process. To our knowledge, none similar work has been reported on LNMO electrode. In the charge and discharge operations, the phase production and consumption are well captured by numerical simulation. On a single spherical LNMO electrode particle, the corresponding voltage variation is calculated by using lithium metal as counter electrode. Modeling results of charge and discharge under different SOCs can well show the path-dependent voltage behavior through interaction between phase transition and transport, which is in concert with our experimental observations.
Modeling
Phase change
The phase transition process in the LNMO electrode is described by applying Avrami equation:
![Equation ([1])](https://content.cld.iop.org/journals/1945-7111/166/12/A2518/revision1/d0001.gif)
where, εs, j is volume fraction of phase j; t is the time; n is set to be 1 by assuming the homogeneous phase transition in all directions of a sphere LNMO particle. Applying the equation derivation reported by Gallagher et al.,15 the phase change reaction rate k' can be further formulated by:
![Equation ([2])](https://content.cld.iop.org/journals/1945-7111/166/12/A2518/revision1/d0002.gif)
where, kji is reaction rate constant from phase j to phase i; Δcs, j is the supersaturation concentration introduced to initiate nucleation;15 H(Δcs, j, εs, j) is Heaviside function to nullify the phase growth rate if it is outside the reasonable concentration and phase fraction range (cmin ⩽ cs, j ⩽ cmax , 0 ⩽ εs, j ⩽ 1).
Hence, the phase change rate of Ni at each stage during discharging can be expressed as following:
![Equation ([3])](https://content.cld.iop.org/journals/1945-7111/166/12/A2518/revision1/d0003.gif)
![Equation ([4])](https://content.cld.iop.org/journals/1945-7111/166/12/A2518/revision1/d0004.gif)
![Equation ([5])](https://content.cld.iop.org/journals/1945-7111/166/12/A2518/revision1/d0005.gif)
where, εs, Li0 + εs, Li0.5 + εs, Li1 = 1, meaning only two of above equations are independent, and Mn phase change process is not considered in this model by setting the cutoff voltages from 4.4V to 4.95V, which is consistent with our previous experiments. The Heaviside function, H(Δcs, j, εs, j), is defined as:
- (1)Li0-Li0.5 stage, H(Δcs, Li0, εs, Li0):

- (2)Li0.5-Li1 stage, H(Δcs, Li0.5, εs, Li0.5):


Diffusion process
The material balance of lithium inside LNMO sphere particle is formulated by neglecting effects from stress, anisotropic diffusion, volume change and all other non-idealities:
![Equation ([6])](https://content.cld.iop.org/journals/1945-7111/166/12/A2518/revision1/d0006.gif)
where, cs is the local lithium concentration,  , Ns is the mass flux of lithium:
![Equation ([7])](https://content.cld.iop.org/journals/1945-7111/166/12/A2518/revision1/d0007.gif)
where, Ns, j = −Ds, j∇cs, j,Ds, j is the diffusion coefficient in phase j.
Substituting lithium concentration in each phase, the material balance can be expressed by,
![Equation ([8])](https://content.cld.iop.org/journals/1945-7111/166/12/A2518/revision1/d0008.gif)
where, Ds, eff = εs, Li0Ds, Li0 + εs, Li0.5Ds, Li0.5 + εs, Li1Ds, Li1.
Assuming lithium would never diffuse across the interface between two coexistence phases but only the phase change process exists, above diffusion equation can be further simplified as the diffusion process of each phase:
![Equation ([9])](https://content.cld.iop.org/journals/1945-7111/166/12/A2518/revision1/d0009.gif)
![Equation ([10])](https://content.cld.iop.org/journals/1945-7111/166/12/A2518/revision1/d0010.gif)
![Equation ([11])](https://content.cld.iop.org/journals/1945-7111/166/12/A2518/revision1/d0011.gif)
where, ∑Rj = RLi0 + RLi0.5 + RLi1 = 0, and these source terms can be assumed by using the volume average assumption:  . Since the volume fraction of each phase, εs, j, is not a function of particle radius, above equations can be further transformed for each phase as:
![Equation ([12])](https://content.cld.iop.org/journals/1945-7111/166/12/A2518/revision1/d0012.gif)
Boundary conditions are determined according to the constant current operation in the experiments. On the particle surface,
![Equation ([13])](https://content.cld.iop.org/journals/1945-7111/166/12/A2518/revision1/d0013.gif)
In the center of the particle:
![Equation ([14])](https://content.cld.iop.org/journals/1945-7111/166/12/A2518/revision1/d0014.gif)
Numerical simulation
The mathematical model is numerically solved using finite element package COMSOL Multiphysics V5.2 and MATLAB. An one-dimensional geometry in spherical coordinates is applied to represent single LNMO particle, and a constant lithium mass flux is applied on the particle surface to simulate constant current charge and discharge. Since the thickness of our thin-layer LNMO electrode is equal to LNMO particle diameter, LNMO electrode voltage then can be estimated by the modeled lithium surface concentration using a lithium metal counter electrode. To represent phase transformation window from Li1Ni0.5Mn1.5O4 (Li1 with Ni2+) to Ni0.5Mn1.5O4 (Li0 with Ni4+), same voltage cutoff window as our experiment, [4.4V, 4.95V], is applied, and we defined 0% SOC at 4.4 V and 100%SOC at 4.95V to be consistent with the experimental setup. The related model parameters are estimated from experiment, and have been listed in Table I.
Table I. Model parameters.
| LNMO particle radius: | 6 × 10− 6m | Diffusion coefficient in Li0.5 phasea: | 0.85 × 10⁻¹⁶m2/s |
| Charge capacity of LNMO: | 146mAh/g | Diffusion coefficient in Li1 phasea: | 0.7 × 10⁻¹⁶m2/s |
| Density of LNMO powder: | 4381kg/m3 | Exponent in Avrami equation: | 1 |
| Maximum concentration of lithium in LNMO: | 23864mol/m3 | Phase change rate constant,16,17 Li1↔Li0.5: | 2 × 10⁻⁶ |
| Diffusion coefficient in Li0 phasea: | 1 × 10-16m2/s | Phase change rate constant,16,17 Li0↔Li0.5: | 4 × 10⁻⁶ |
Results and Discussion
Charge and discharge behaviors of LNMO particle
Figure 1 illustrates the numerical results of LNMO particle behavior (phase transition) in the charge and discharge process, and the corresponding phase distributions along particle radius. The discharge process started from the fully charged state and is the intercalation of lithium into the LNMO particle, which experiences two phase transformation stages: Li0 → Li0.5and Li0.5 → Li1. Using the developed model, LNMO particle shows its local volume fraction of Li0.5 phase is slightly over 50% on the particle surface (r/R = 1) but only around 40% in the center (r/R = 0), when it is discharged to 75%SOC from the fully charged state. As the discharge process moves forward to 50% and 25% SOCs, the new formed phases, Li0.5 and Li1, both have higher volume fractions on the surface than the center region. Similarly, in the reverse process, charge is the deintercalation of lithium out of the LNMO particle, and have Li1 → Li0.5 and Li0.5 → Li0two phase transformation processes. New formed charge phases, Li0.5 and Li0, both also have more volume fractions on the surface than the center region. These phenomena can be explained by the interplay between the lithium diffusion in the particle and local phase-change rate which is concentration (lithium) dependent. Besides, it is interesting to note that the phase distributions at the same SOC are quite different between charge and discharge, which could directly influence the capacity utilization in the LNMO charge and discharge process, and can lead to the observed asymmetric character between charge and discharge on capacity utilization reported in our previous paper (Part I: experimental study11).
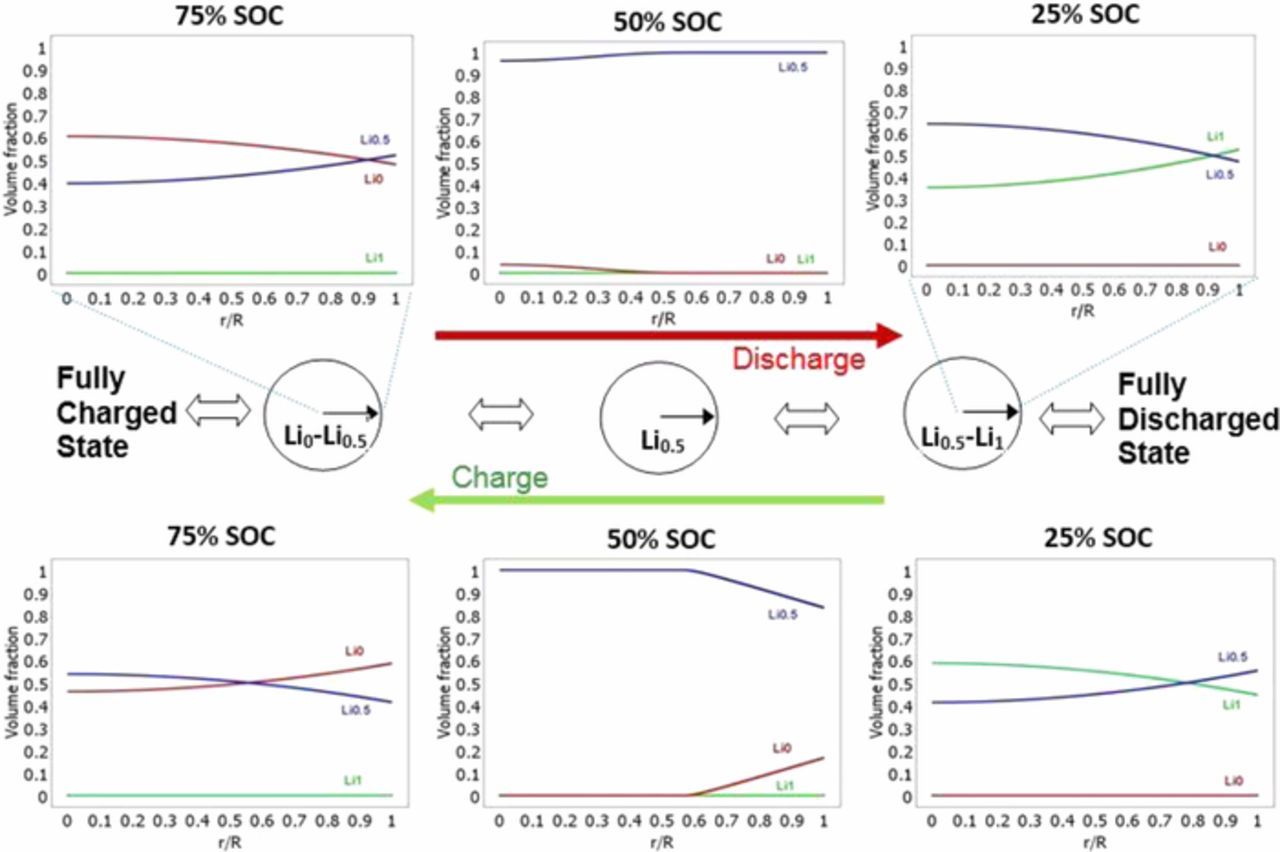
Figure 1. Numerical results of phase distributions and volume fractions along LNMO particle radius direction in the charge and discharge process.
In order to qualitatively explain the asymmetric behavior of LNMO charge and discharge capacity, Figure 2 illustrates the variation of average volume fractions of each phase (Li0, Li0.5 and Li1) in a full charge and discharge cycle. It is clear to see that there is no overlap in phase fractions between charge and discharge process of the LNMO electrode. In other words, the present three phases' volume fractions in the LNMO are different in the charge and discharge process although the total amount of lithium inside are same. This demonstrates the path dependent behavior of phase transformation inside LNMO electrode. Meanwhile, it indicates that the path-dependent behavior observed on thin LNMO electrode is originated from both the transport limitation (lithium diffusion) and the slow phase transformation process.
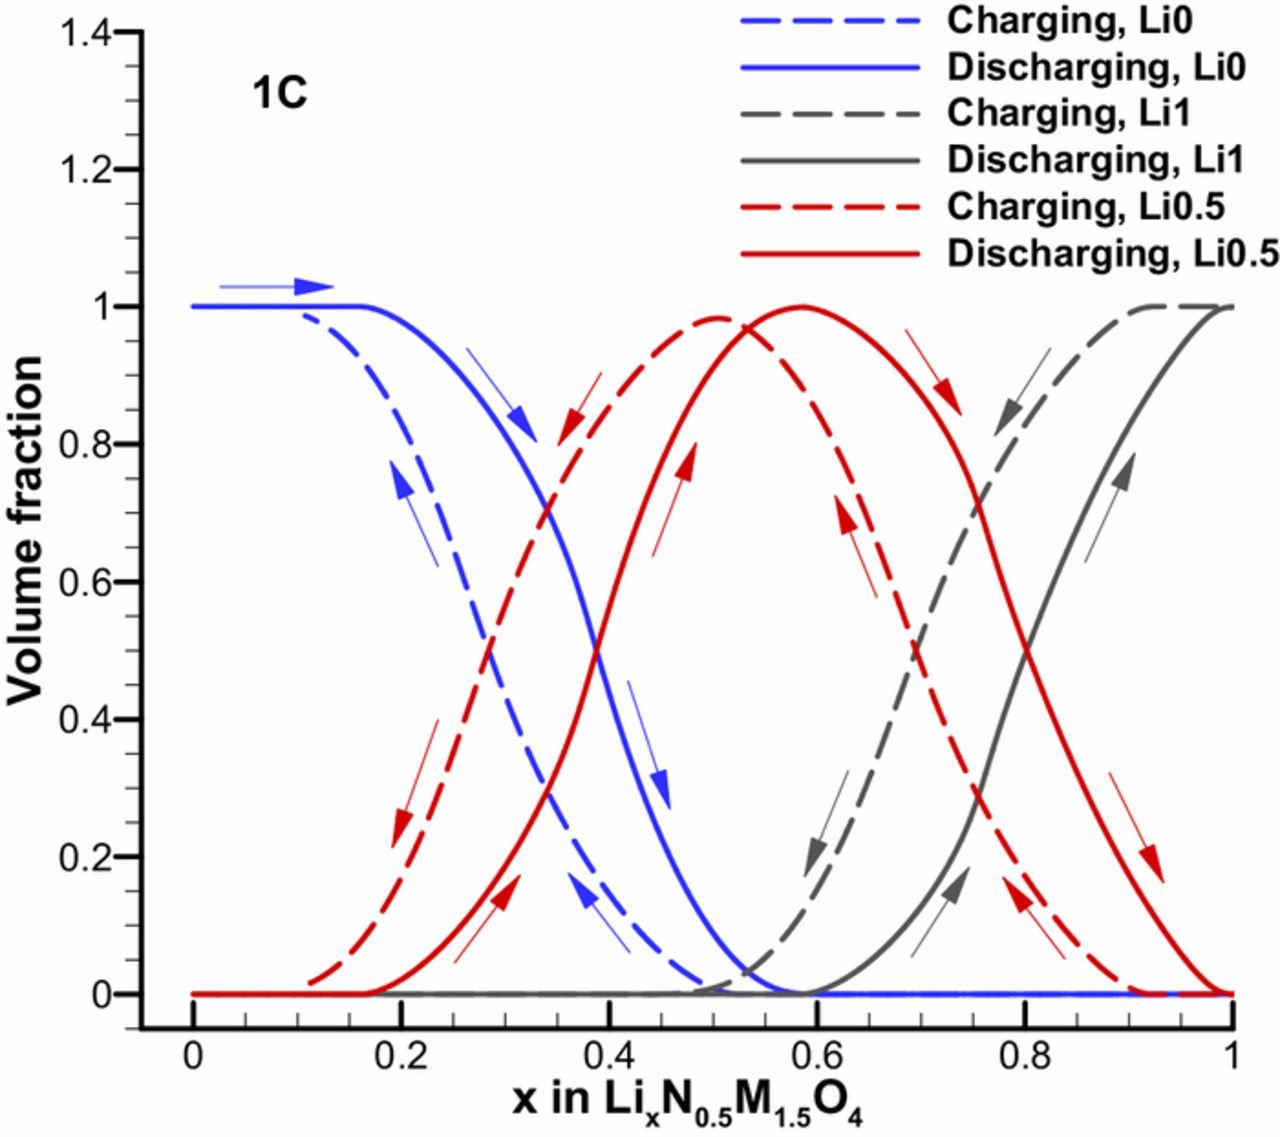
Figure 2. Average volume fraction variation of Li0, Li0.5 and Li1 phase in a LNMO particle during a full charge and discharge cycle.
Phase coexistence and boundary
Because of the lithium diffusion in solid phase, fast discharge (or charge) rate on LNMO particle can lead to lithium accumulation (or reduction) on its surface. Since local phase transformation rates are highly dependent on the lithium concentration according to chemical kinetics, this inevitably causes local phase transformation rates are higher on the surface than the core region of LNMO particle. Hence, phase coexistence and distributions in the LNMO particle will be affected by the competing nature between diffusion and phase transformation. To explore this competing effect, in Figure 3, we simulated Li0 → Li0.5 phase change process (εs, Li0 + εs, Li0.5 = 1) in a constant rate discharge of a fully charged LNMO particle. As the lithium flux goes into the particle, Li0.5 phase will be firstly generated on the LNMO particle surface while the local volume fraction of Li0 decreases. Three different Li0 → Li0.5 transformation rates in forms of ratio to the lithium diffusion coefficient (k/D, 2k/D and 10k/D) are applied in the model respectively. Along the normalized particle radius, a clear phase boundary between Li0 phase and Li0.5 phase could show up at r/R = 0.6 when 10k/D is applied. Besides, the coexistence region of Li0 and Li0.5 in the particle (0 < εs, Li0 < 1, 0 < εs, Li0.5 < 1) increases instead of a clear phase boundary when k/D and 2k/D are applied to the model. These observations demonstrate that the competition between phase change limitation and transport limitation determines the phase distribution and coexistence as well as the existence of phase boundary. Since LNMO electrode undergoes two phase change processes (Li1↔Li0.5 and Li0.5↔Li0), two distinct phase boundaries (Li1/Li0.5 and Li0.5/Li0) can only exist when the lithium diffusion is much slower than the phase change rates of Li1/Li0.5 and Li0.5/Li0 simultaneously, otherwise, phase distribution would show coexistence character throughout the LNMO particle in the charge and discharge operation.
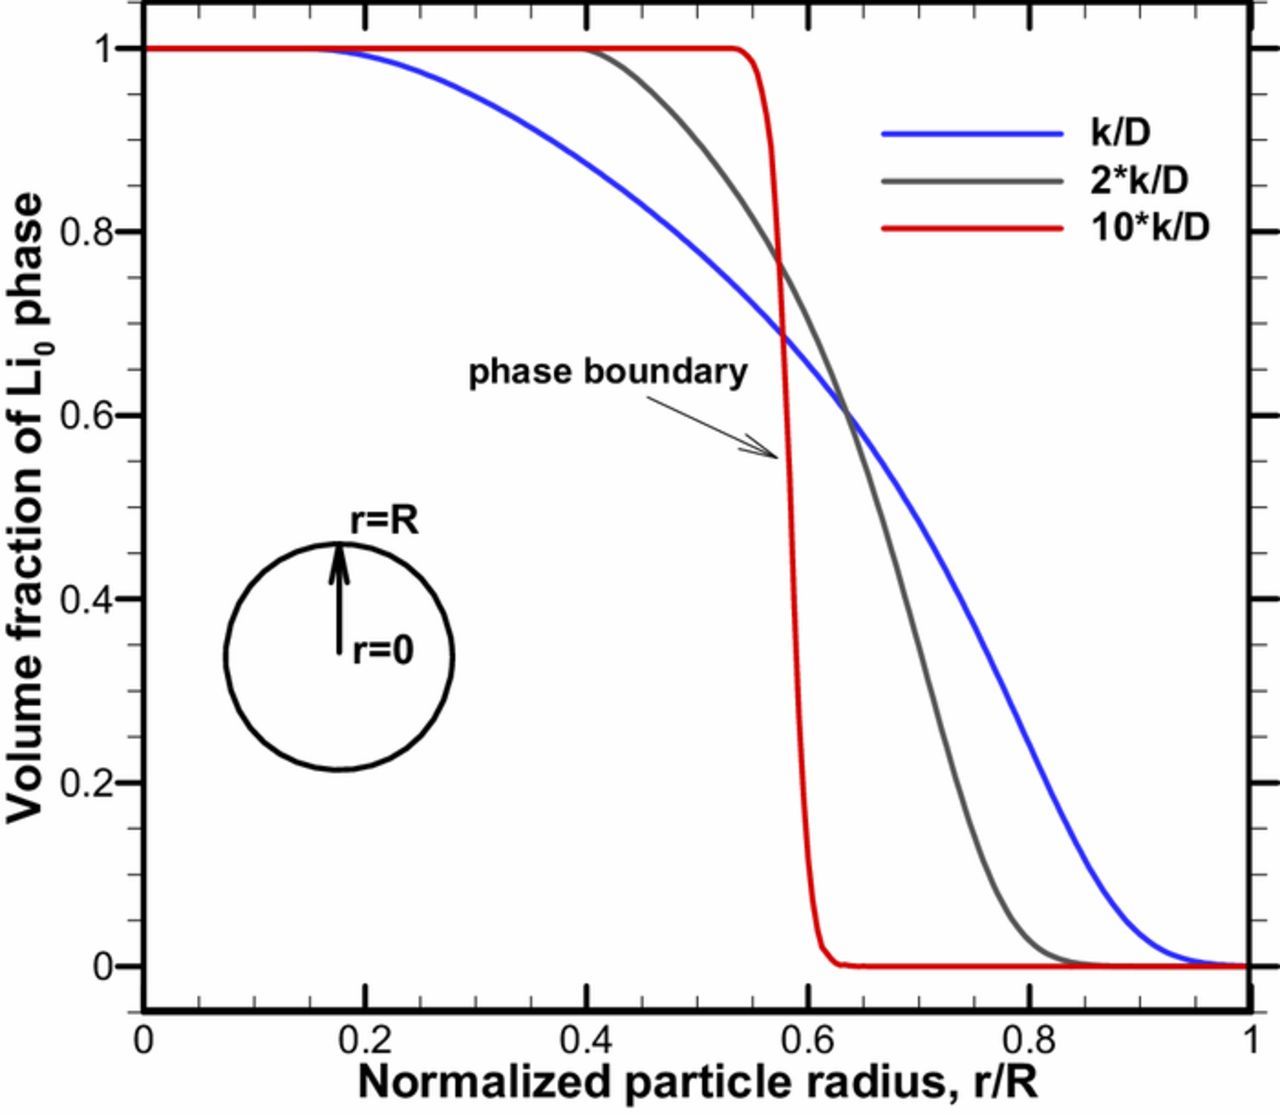
Figure 3. Parameter study of the ratio between transformation rate and lithium diffusion coefficient.
Path-dependent behavior at different SOCs
Our model has demonstrated that one consequence of transport limitation and phase change limitation interaction is the path dependent behavior of phase transformation and distribution inside LNMO particle, which results in the difference of lithium concentration on the particle surface in charge and discharge, and is the origin of the electrode path-dependent voltage behavior. In our previous experimental study,11 we found thin-layer LNMO electrode did not only have path-dependent voltage behavior, but also show SOC dependent character on this path-dependence. To explore this behavior, in this section, we simulated two operation procedures: fast discharge after slow discharge/charge, and fast charge after slow discharge/charge. Both operation procedures are started from fully charged (discharged) state to fully discharged (charged) state, and the switch between fast C-rate and slow C-rate is set at a given SOC, where three SOCs, 25%, 50% and 75%, were simulated respectively. The cutoff voltage window, [4.4V, 4.95V], is applied the same as that in the experiment, which represents SOC variation from 0%SOC (Li1 phase) to 100%SOC (Li0 phase).
As shown in Figure 4, the discharge path-dependence exists at all three SOC conditions, moreover, numerical results show that 75%SOC has the largest path-dependence on capacity utilization in comparison with the other two. This can be understood by that both the diffusion process and the phase change are rate limiting, and a larger SOC takes longer time to get fully discharged and hence has more time for local phase change reactions taking place to capture lithium. The results of charge path-dependence are illustrated in Figure 5. Similarly, modeling results show that charge path-dependence exists at all three SOCs. However, different from discharge, the charge path-dependence on capacity utilization at 25%SOC is the largest. This can also be explained by the limited phase change rates as well as the diffusion process: the charging process from 25%SOC to fully charged state (100%SOC) takes a longer time than from 50%SOC and 75%SOC, and thus more phase change reactions can take place, and more charge capacity can be obtained. Here, it has to be emphasized that our model is trying to explain the particle scale path-dependence as well as its SOC dependent behavior of LNMO electrode, while thick LNMO electrodes involve complicated porous electrode effect and are beyond the scope of this work.
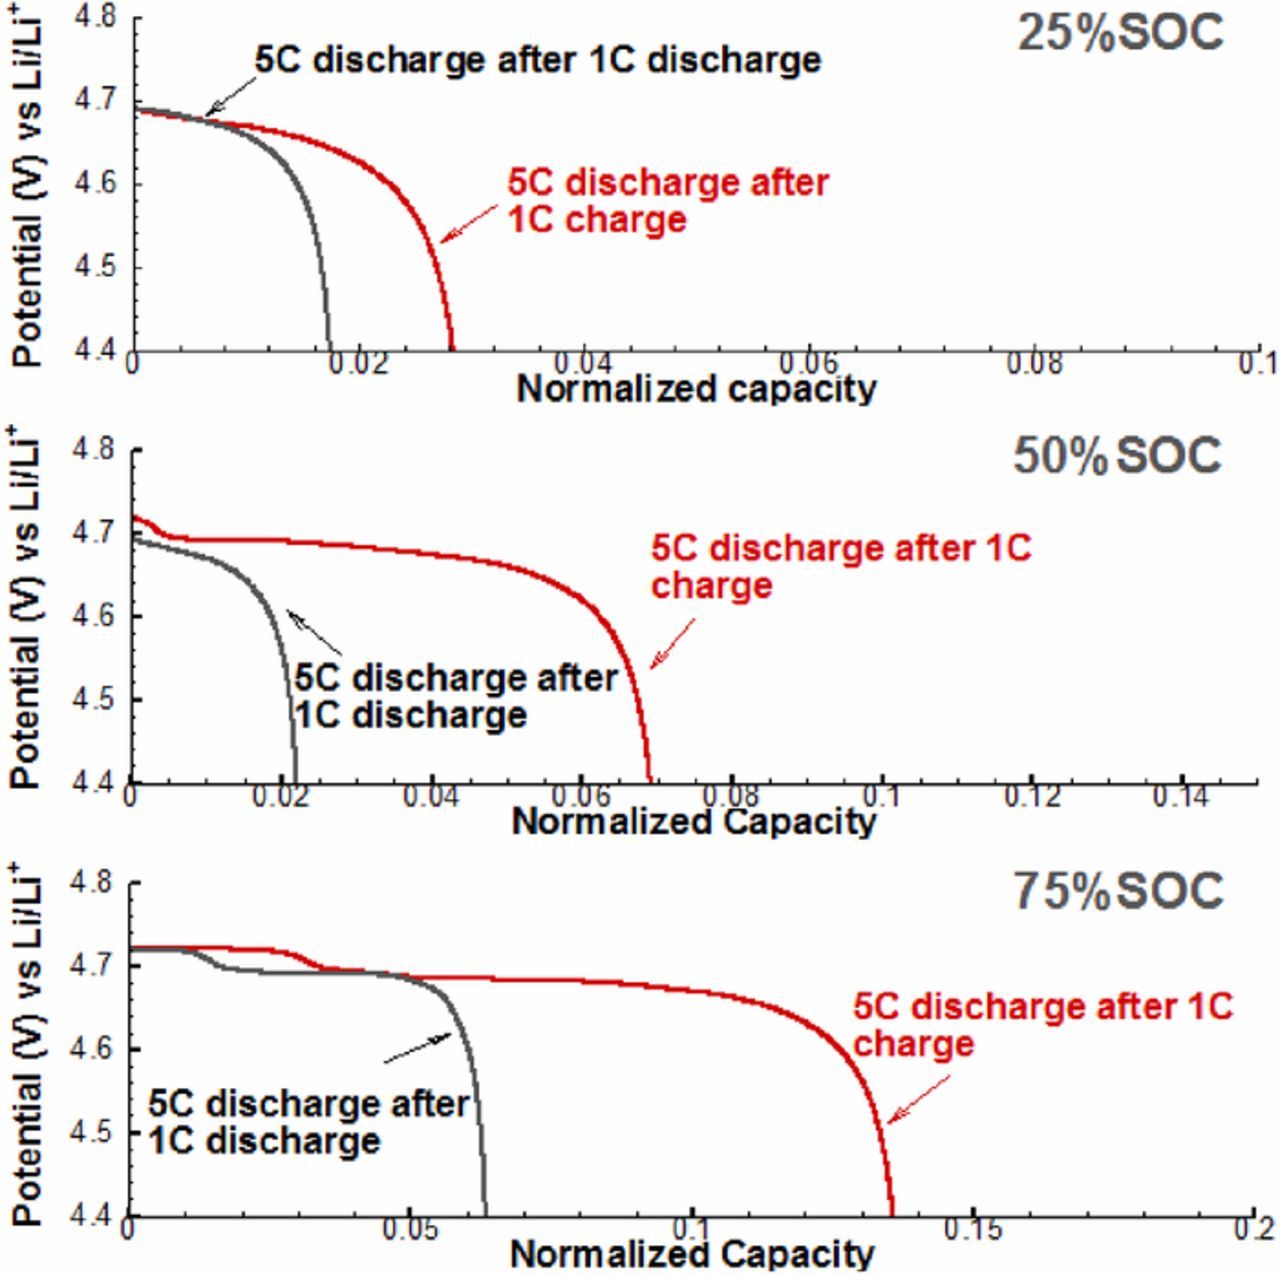
Figure 4. Simulated path-dependent voltage behavior of LNMO particle in the discharge at 20%, 50%, and 75% SOC.
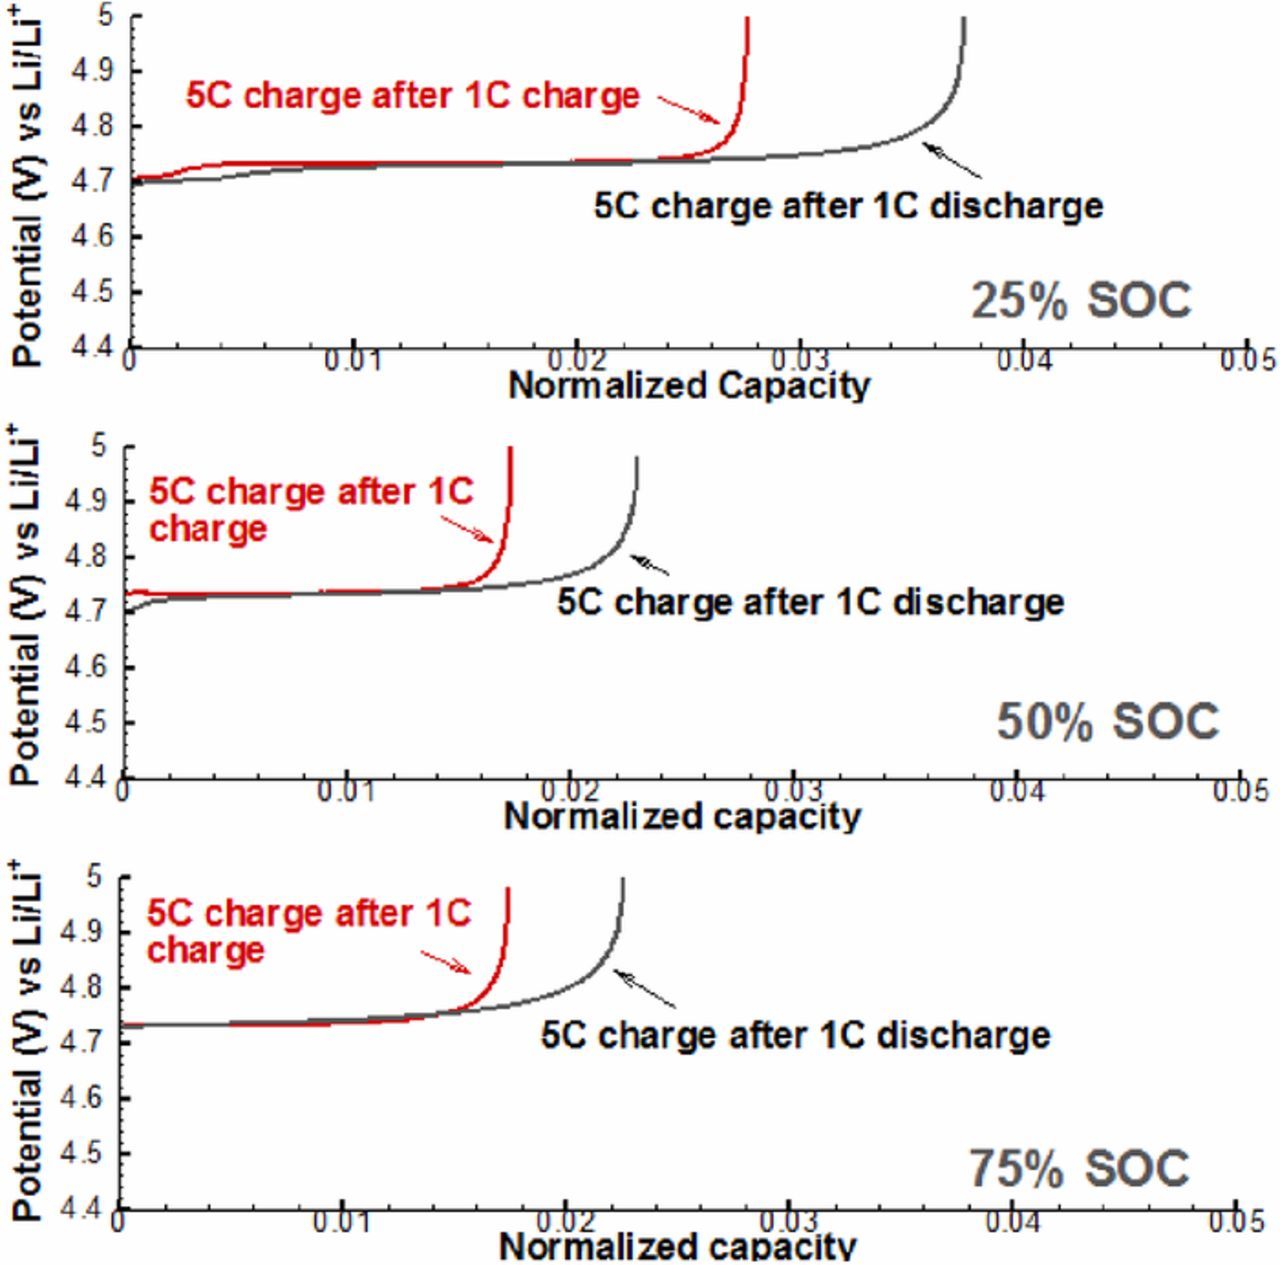
Figure 5. Simulated path-dependent voltage behavior of LNMO particle in the charge at 20%, 50%, and 75% SOC.
Relaxation impact
Our above numerical studies have demonstrated that slow phase transformation process in LNMO particle can lead to the SOC dependent character of the path-dependent voltage behavior. If this were true, long relaxation time would have important impact on the voltage behavior since it can provide the phase transformation time needed. In Figure 6, the effect of relaxation was simulated on the LNMO discharge behavior: a thirty-minutes rest was applied when the operation is switched from slow charge/discharge at 1C to fast discharge at 5C. Comparing with 'none rest' condition, the path-dependence behavior decreases as the difference of capacity utilization becomes smaller between 'discharge after charge' and 'charge after discharge'. This is because long relaxation time provided more time to phase transformation reactions, and the lithium distributions on the surface and inside LNMO particle are thus different before and after the relaxation, although the total lithium amount is the same. This also can well explain the vanish of path-dependence in both charge and discharge in our experiments by applying sufficient long relaxation period.
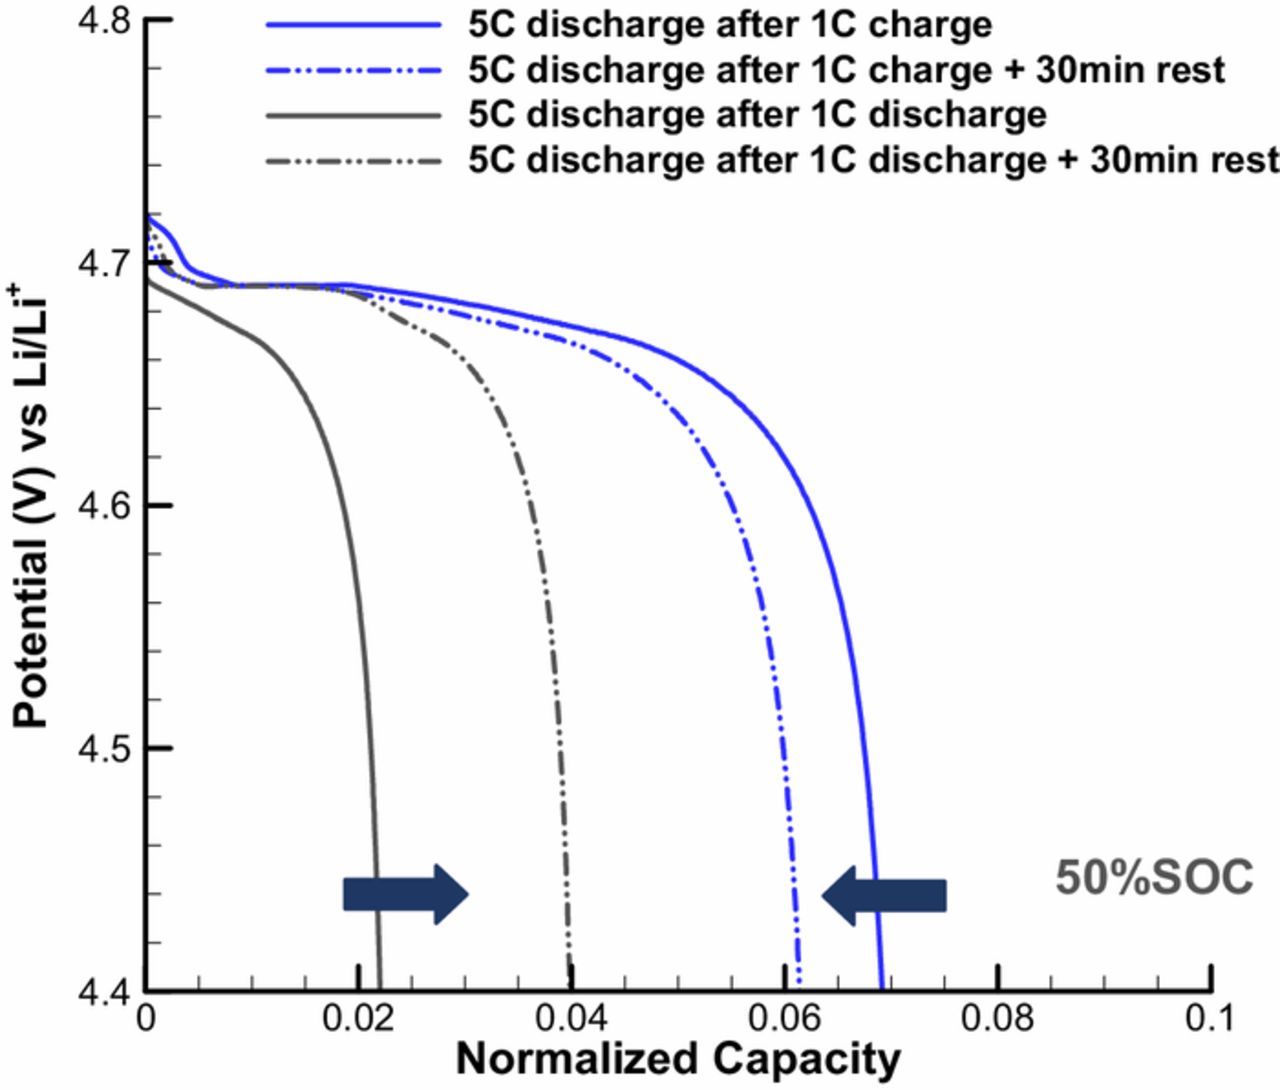
Figure 6. Effect of 30-min relaxation on discharge path-dependent voltage behavior of LNMO particle.
Conclusions
In this study, we modeled the phase transformation in LNMO particle during charge and discharge, and explored the mechanisms behind the observed path-dependent voltage behavior. A mathematical model was developed for Li1 → Li0.5 → Li1 phase transition process, which was incorporated into lithium diffusion process. By simulating charge and discharge behavior of LNMO, numerical results indicate that phase distributions (Li0, Li0.5 and Li1) at same SOC are different in charge and discharge, which can lead to different capacity utilization. Results of average phase volume fractions also qualitatively demonstrate the path dependent behavior of phase transformation inside LNMO electrode. Since local phase transformation rates are highly dependent on the lithium concentration, phase coexistence and distributions in the LNMO particle are affected by the competition between diffusion and phase transformation. Parameter study shows that the competing between phase change limitation and transport limitation determines the distribution and coexistence of phases as well as the existence of phase boundary. The observed SOC dependent voltage behavior of thin LNMO electrode was also investigated, where three SOCs, 25%, 50% and 75%, were simulated respectively. Results show that 75%SOC has the largest discharge path-dependence behavior on capacity utilization while 25% SOC shows the largest charge path-dependence. This is because 75%SOC in discharge or 25%SOC in charge can offer more time for local phase change reactions to take place, and hence more capacity can be obtained. The relaxation impact is investigated at last, which shows that the path-dependence behavior can be reduced by long relaxation. This is because long relaxation time can provide more time to phase transformation reactions, and reduce the difference between after charge and after discharge.
Acknowledgments
The authors gratefully acknowledge the Toyota Motor Corporation for the funding support of this work. YYX thanks the fund support from the Claude C. Laval Jr. Award for Innovative Technology and Research, Fresno State.
ORCID
Yuanyuan Xie 0000-0002-9859-1149
Venkat Srinivasan 0000-0002-1248-5952