Abstract
The effect of the cation nature is explored for the reaction of alkali metal ions intercalation into the AVPO4F material. Application of electrochemical methods allowed determining the key diffusional and kinetic parameters for Li+, Na+ and K+ intercalation reactions. The obtained formal redox potential values, apparent diffusion coefficients and charge transfer resistance values are contrasted, providing the possibility to assess the variation in the reaction energetics for metal ion insertion/extraction. The observed differences in reaction rates are rationalized in terms of different contributions of ion desolvation and transition through adsorbate layer/electrode interface for various ions.
Export citation and abstract BibTeX RIS

This is an open access article distributed under the terms of the Creative Commons Attribution 4.0 License (CC BY, http://creativecommons.org/licenses/by/4.0/), which permits unrestricted reuse of the work in any medium, provided the original work is properly cited.
The mechanism of ion intercalation reactions is still poorly understood in spite of the obvious importance of intercalating systems in metal-ion batteries development for applications in energy conversion and storage. The research in the field of establishing ion intercalation kinetic patterns is mainly focused on evaluating charge transfer resistance parameters and diffusion coefficients for materials with presumably higher energy density and rate capability, while the fundamental aspects of the reaction mechanisms are typically overlooked. However, the research aimed at finding the limiting step of intercalation reaction might provide additional non-empirical approaches to control the rate of the intercalation reaction. In this regard, fundamental studies exploring the effects of solvent and cation nature on the overall reaction rate are of primary importance.
In a series of recent publications, the intercalation reaction rate was shown to be highly dependent on the solvent nature, providing an implication to consider ion transfer rather than electron transfer or ion insertion into the host matrix step to be rate limiting.1–4 It was also shown that intercalation of solvated cations is kinetically more facile as compared to the reaction of ions without the solvation shell.5,6 These findings imply that the contribution of ion desolvation to the reaction activation barrier could be dominant. On the other hand, the reaction rate was shown to be dependent on the structure of electrode/electrolyte interface (EEI) especially in cases when adsorbate layers are formed at high potentials at the electrode surface (solid electrolyte interface, SEI, on anode, or cathode/electrolyte interface, CEI).2 All these results point to the complex interplay between the energetics of ion desolvation and the transition of the ion through the EEI. Variation of the solvent nature cannot be applied to distinguish between these two contributions, as changing the solvent results in simultaneous changes in the EEI structure, desolvation energy and the preexponential factor, which is determined by the solvent effective frequency. Variation of the intercalating ion provides another possibility to assess the mechanism of the intercalation reaction. The desolvation energy contributions should be very different for ions of different charge and radius, as well as the barriers for the ion transition through the EEI.
Unfortunately, very few intercalating matrices exhibit the capability to incorporate ions of different sizes without drastic changes in the material structure and the loss of reversibility. Prussian blue analogues are the most intensively explored model systems, which can reversibly insert univalent ions, such as Li+, Na+, K+, Rb+ and Cs+.7,8 A very pronounced dependence of the formal potential of the intercalation/deintercalation reaction on the solvation energy of the cation was observed,9,10 as well as the nonlinear dependence of the diffusion coefficient on the cation's size, with K+ showing a maximal value of the apparent diffusion coefficient.8 However, no systematic studies on the variation of ion transfer kinetic parameters were performed for these systems to our knowledge.
Prussian blue analogues, in spite of obvious advantages such as facile preparation by means of electrosynthesis and simple reversible single-phase behavior, often show nonstoichiometry, which results in the peak splitting, complicating the analysis of the electrochemical data. Moreover, the deposited films are often not stable enough for continuous electrochemical measurements, such as potentiostatic intermittent titration or impedance spectroscopy measurements.
Polyanion transition metal compounds may provide a larger playground for searching for new model systems.11 For instance, fluoride-phosphate based materials possess a huge variety of polymorphs, thus offering ample opportunities in designing of new intercalation hosts and tuning electrochemical properties. Moreover, they take a number of advantages over oxide-based cathode materials in terms of higher operating voltages stemming from the inductive effect of both fluoride and phosphate anions, better thermal and chemical stability and faster kinetics due to lower affinity of alkali metals toward fluorine than oxygen.12 It has been shown recently that the KTiPO4O (KTP) structure type materials13,14 can reversibly host Li+, Na+ and K+ ions in a continuous system of spacious tunnels and cavities similar to the Prussian blue systems. From crystal chemistry point of view, AVPO4F with the KTP structure is seemingly the only representative of fluoride-phosphates so far which could accommodate three types of alkali metals (Li, Na, K). Our recent study of the KVPO4F cathode material15 adopting a related KTP-like crystal structure, demonstrated that up to 85% of K can be extracted and the resulting framework maintains the reversible Li+ intercalation. Encouraging electrochemical performance coupled with the structural and chemical peculiarities should make KVPO4F not only a feasible model system for investigating transport and kinetic parameters of the alkali ion de/intercalation but also a promising electrode material for alternative metal-ion batteries including the actively developing sodium-ion and just emerging potassium-ion ones.
In this work, we explore the effect of the cation's nature on the kinetics of the ion intercalation into the KVPO4F material. Based on the results of the electrochemical analysis, we compare the diffusion coefficient and charge transfer resistance values for different intercalating cations.
Experimental
Synthesis
KVPO4F cathode materials were prepared using the two-step freeze-drying assisted solid-state technique as it was reported earlier.15 At first step, vanadium phosphate VPO4 was synthesized. For this, NH4VO3 (>99%) and NH4H2PO4 (>99.5%) was dissolved in distilled H2O under vigorous stirring at 70°C with a drop-wise addition of an ascorbic acid solution as a carbon source and reducing agent. The resulting blue solution was pulverized into liquid nitrogen and objected to a sublimation at a low pressure (10−2 bar) within 72 hours. The obtained powder was annealed at 825°C for 7 hours. The residual carbon content in the VPO4 sample was evaluated by a thermogravimetric method in air (80% Ar:20% O2) to be ∼4%. At the second stage, the prepared VPO4 was subsequently mixed with an equivalent amount of KHF2 (>99.5%), grinded in a mortar and fired under a steady Ar flow at 650°C for 1h followed by quenching to room temperature to prevent the formation of by-products and/or decomposition of the target material.
Electrolyte and electrode preparation
An appropriate amount of ethylene carbonate, EC, (99%, anhydrous, Aldrich) was dissolved in diethyl carbonate, DEC, (99%, anhydrous, Aldrich) to achieve 1:1 volume ratio. After the complete dissolution of EC, the mixture was dried with activated 3 Å molecular sieves overnight. KPF6 (0.5 M K+ electrolyte, >99.9%, Aldrich) or NaClO4 (1 M Na+ electrolyte, >99.9%, Aldrich) salts were dried at room temperature in vacuum (p(O2) <10−2 atm) for 12–16 h. The electrolyte salts were dissolved in EC/DEC solution under Ar atmosphere. Commercial 1 M LiPF6 in EC/DEC (battery grade, Aldrich) was used as a Li+ electrolyte.
Composite electrodes were fabricated by mixing 70% KVPO4F, 13% Super C carbon black (Timcal) and 17% polyvinylidenefluoride (PVDF) as a binder. The electrode mass was suspended in an appropriate amount of N-methylpyrrolidone and spread over a platinum support. The resulting electrodes were dried at 120°C in vacuum (p <10−2 atm) for 7 h. The typical loading of the cathode material was 0.3–0.5 mg·cm−2.
Materials characterization
X-ray powder diffraction patterns were collected by a Bruker D8 Advance powder diffractometer (Cu-Kα1,2 radiation) operating at 35 kV and 40 mA. According to the XRD phase analysis, all KVPO4F materials exploited in this work for electrochemical measurements contained less than 3% of admixture phases, and can be considered as single-phase.
The morphology, particle size and chemical composition of the initial material as well as the composition of the recovered electrodes were investigated using Carl Zeiss NVision 40 scanning electron microscope (field-emission LaB6-cathode, In-Lens-detector, 10÷20 kV) equipped with an energy-dispersive X-ray spectroscopy attachment (INCA Energy 350X-Max 80, Oxford, Si-(Li)-detector). The KVPO4F material consists of well-defined round-shaped or shapeless particles of 100÷300 nm size at the longest direction (Figure 1).
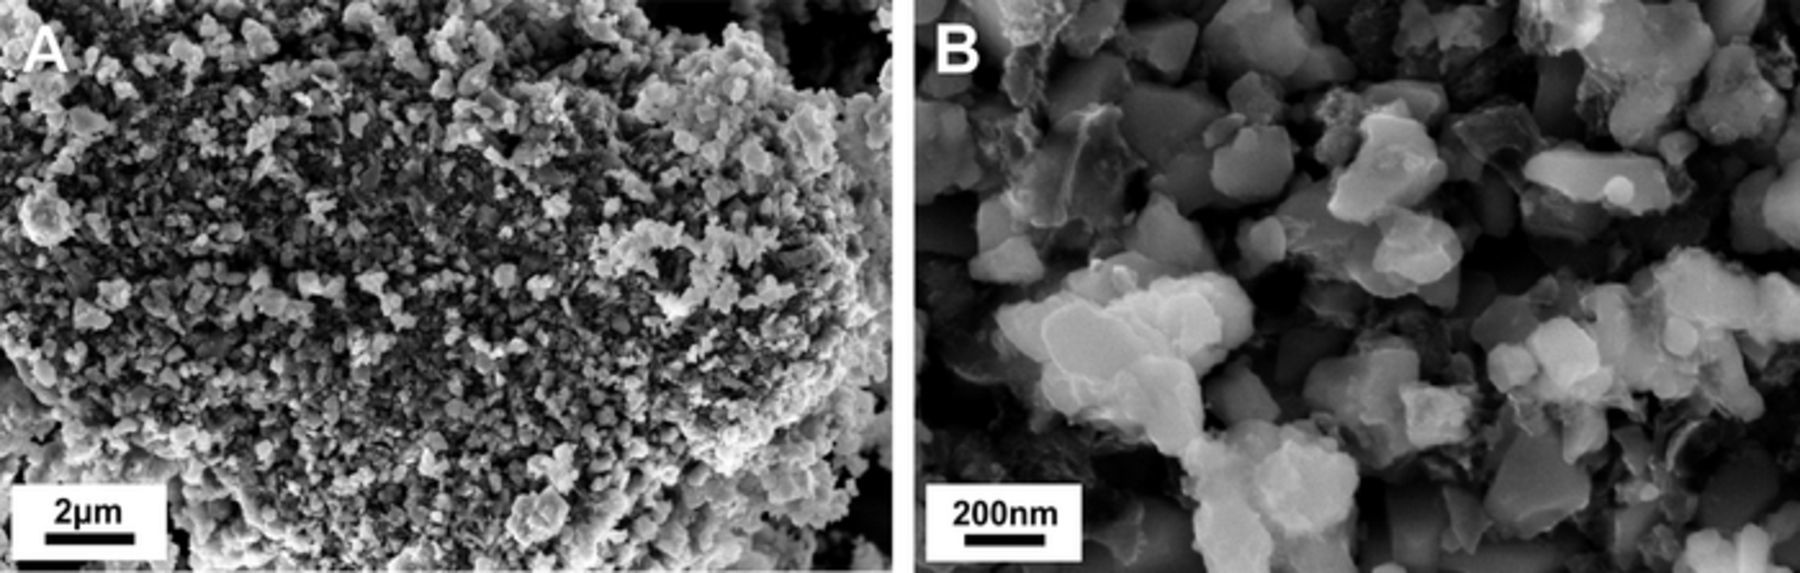
Figure 1. SEM images of KVPO4F obtained at different magnifications: A) 10 K, B) 100 K.
Bond valence energy landscapes (BVEL)
The bond valence summation (BVS) method and its derivatives such as bond valence energy landscapes (BVEL) are recognized as a quick and simple tool to analyze the possible shape and dimensionality of diffusion paths for a given mobile ion. The BVEL method is considered to be more reliable because in comparison to the parent BVS method, it takes into account both similar and opposite charge interactions in the lattice as well as an asymmetry of ion coordination environments. In contrast to BVS, the BVEL approach operates with specific energy values, E(A). The details and mathematical procedure of E(A) calculations can be found in References 16,17. It should be noted that these energy values do not have direct physical meaning still they are usually in a good correlation with those provided by MD or DFT approaches. The algorithm of BVEL calculations is implemented in the 3DBVSMAPPER program,18 which automatically produces a three-dimensional grid of E(A) values for alkali ions (Li+, Na+, K+).
Since this method deals with a static model of the crystal structure not considering possible lattice distortions or atoms displacements upon the ion migration, it provides only a tentative view on the ion migration pattern within the structure. A more accurate analysis of the ion migration including calculations of energy profiles and activation barriers could be performed using much more resource-intensive density functional theory (DFT) simulations. However, they require reliable data on structure transformations taking place during ion de/intercalation, which could be retrieved, for instance, from operando diffraction experiments. In this work, the BVEL method was utilized for the preliminary investigation of alkali ion migration topology and dimensionality to be used in the further analysis of electrochemical data.
Electrochemical measurements
Electrochemical measurements in Li+, Na+ and K+ electrolytes were performed in a three electrode glass cells with working volumes of ca. 5 mL (cylindrical cell, 3 cm diameter). Counter and reference electrodes were prepared by spreading metal foil (Li or Na) over copper plates (ca. 1 cm2). The working electrode (Pt foil, ca. 0.5 cm2) was placed opposite to the counter electrode at a distance of ca. 0.7–1 cm, to ensure optimal current line distribution. The reference electrode was located in close proximity to the working electrode (ca. 1 mm) to minimize the effect of the uncompensated ohmic resistance in solution.
The initial KVPO4F material was used as a working electrode in all electrochemical experiments. A partial substitution of K ions for Li or Na ions was observed in the course of cyclic voltammetry scans. It was found that cycling the electrode in a wide potential range (at potentials more positive than 4.4 V vs Li+/Li) results in a slow degradation of the material, which takes place in the large excess of the electrolyte presumably due to dissolving of V+4 at higher potentials.19,20 Although it is possible to remove up to 0.85 K from the host structure15 in this study the anodic potential limit did not exceed the value, which corresponds to the extraction of less than 0.6 K from the host structure.
Large volumes of electrolyte were necessary to achieve low concentrations of K ions in the Li+ and Na+ electrolytes to prevent backward intercalation of the deintercalated potassium ions. In what follows, for the sake of simple notations, we refer to the substitution of K ions for Li and Na ions as to the intercalation into the AVPO4F host, implying only a partial substitution of K+ for different cations. More precise notation of the lithium and sodium intercalated materials would correspond to the formula MxKyVPO4F, where M is Li or Na.
All the reported voltammograms were recorded in the third potential scan (after stabilization of the electrode's electrochemical response).
Na and Li metal foils on a copper support were used as counter and reference electrodes in the respective electrolytes. In the K+ electrolyte, due to the high risk associated with using of metallic potassium, an Ag+/Ag reference electrode, separated from the working and counter electrodes compartment, was utilized. Graphite electrode was applied as a counter electrode for measurements in the K+ electrolyte. The potentials of Ag+/Ag, Li+/Li and Na+/Na reference electrodes were calibrated against the potential of the Fc+/Fc (ferocenium/ferrocene) redox couple in EC/DEC solvent to provide a common reference potential scale in all the electrolytes under study. The cells were assembled in an argon-filled glove box (MBraun, c(H2O) < 0.1 ppm, c(O2) < 50 ppm). Electrochemical data were registered with Biologic VMP3 potentiostat/galvanostat.
Potentiometric intermittent titration technique (PITT) was employed to determine the potential dependence of Li+, Na+ and K+ apparent diffusion coefficients. The potential was scanned in 10 mV steps. At the end of each potential step, the residual current did not exceed the background value (typically 1–3 μA). Diffusion coefficient calculations were performed assuming the mean particle diameter of 0.2 μm.
Impedance spectroscopy measurements (EIS) were performed to determine charge transfer resistance values of Li+, Na+ and K+ intercalation reactions. Impedance spectra were registered in steps of 10 mV, after equilibrium state was reached for each potential value (usually 1 h in single-phase and up to 3 h in phase-transforming regions). The frequency range was 10 kHz – 10 mHz, with a 5 mV peak-to-peak alternating voltage. For the evaluation of the equivalent circuit parameters, experimental impedance spectra were analyzed using MEISP program package.21
A conventional equivalent circuit with the account for the ion transition through CEI (RCEI CCEI contour) adsorbate layer was employed to model the intercalation reaction (Figure 2).22–25
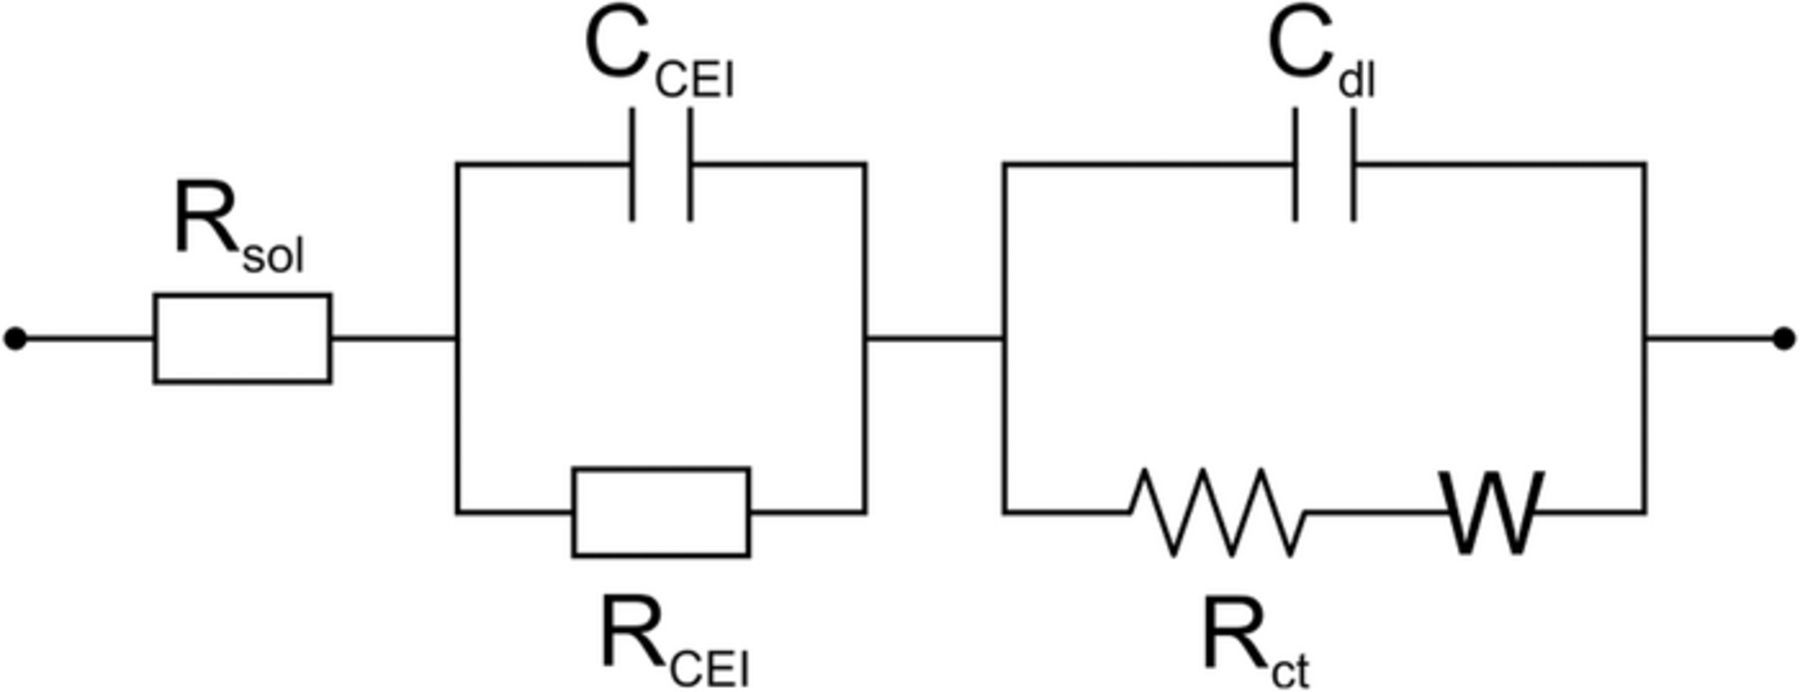
Figure 2. Equivalent circuit for the intercalation reaction. Rsol – uncompensated solution resistance; CCEI – CEI capacity; RCEI – CEI resistance; Cdl – double layer capacity; Rct – charge transfer resistance; W – Warburg impedance.
Calculation of diffusion coefficients
As it was discussed in a number of publications,26 application of Cottrell equation, which assumes the limiting step of semi-infinite planar diffusion without any additional current-limiting complications, gives erroneous results for evaluation of diffusion coefficients for intercalating materials, which demonstrate slow charge-transfer kinetics and non-zero ohmic resistance. In this work we used the model formulated by C. Montella to describe a small-step chronoamperometric response for the case of a non-negligible ohmic resistance and slow charge-transfer kinetics for planar,27 cylindrical and spherical diffusion geometries.28 The model is derived for the case of single-phase monodisperse intercalating system for small-step chronoamperometric experiments. In our systems multiple phase transitions are possible (as it is outlined in Cyclic voltammetry section), which should result in artificial current minima in the vicinity of the potentials of phase transitions. However, the diffusion coefficient values in the regions of single phase behavior should be considered reliable. The magnitude of potential steps in the PITT procedure was 10 mV to ensure the applicability of the model. Narrow material particles size distribution also allows using the model for quantitative estimates.
Within this approach, the current vs time relation I(t) for planar geometry is given in the form of infinite series:
![Equation ([1])](https://content.cld.iop.org/journals/1945-7111/164/1/A6373/revision1/d0001.gif)
![Equation ([2])](https://content.cld.iop.org/journals/1945-7111/164/1/A6373/revision1/d0002.gif)
where ΔQ is the intercalation/deintercalation charge passed during potential step ΔE, bn – n-th positive root of the equation b·tan b − Λ = 0, τ – time constant for the diffusion process, D – diffusion coefficient, L – diffusion layer thickness.
Λ is a key model parameter reflecting relative contributions of diffusion and others limiting steps:
![Equation ([3])](https://content.cld.iop.org/journals/1945-7111/164/1/A6373/revision1/d0003.gif)
where Rdiff, Rct, RΩ - effective resistance of diffusion, charge transfer and ohmic resistances, respectively.
In case of cylindrical or spherical diffusion the current vs time dependence is given by:
![Equation ([4])](https://content.cld.iop.org/journals/1945-7111/164/1/A6373/revision1/d0004.gif)
![Equation ([5])](https://content.cld.iop.org/journals/1945-7111/164/1/A6373/revision1/d0005.gif)
where J0, J1 are Bessel functions of zeroth and first order, respectively.
Experimental current vs. time transients were approximated by the Equations 1, 4 and 5 (depending on the appropriate diffusion geometry) using least-squares method. τ, Λ and ΔQ values were varied in the course of the fitting procedure. The background current value Ibkg was evaluated by averaging the long-time domain regions of the chronoamperograms. The initial value of ΔQ was estimated by integrating chronoamperograms followed by the subtraction of background current contribution. During calculation of I(t) summation was carried out until m-th series member was less than 10−6 of the sum of the previous members:
![Equation ([6])](https://content.cld.iop.org/journals/1945-7111/164/1/A6373/revision1/d0006.gif)
where p = 1, 2, 3 for planar, cylindrical, and spherical geometries of diffusion. To provide equal contributions from different time domains, logarithmic timescale was used during approximation. Experimental data were interpolated to a fixed number of equidistant points on log(t) scale (usually 50 points per order).
Results and Discussion
AVPO4F crystal structure and diffusion pathways
The crystal structure of the initial KVPO4F material features the chains of the corner-sharing VO4F2 octahedra bridged by the PO4 tetrahedra to form a rigid framework with a 3D network of continuous spacious cavities. Potassium accommodates two 9-coordinated sites, designated as K1 and K2, which are located in the open tunnels along the a and b axes respectively (Figure 3). As it was shown in our previous work,15 both deintercalated KxVPO4F and Li-substituted LixK1-xVPO4F materials preserve the initial framework displaying an extremely small volume variation within 2.2%. The intercalated Li ions in LixK1-xVPO4F fill the K2 position as well as form a specific 4-coordinated Li3 position. In case of Na, the structural data for NaxK1-xVPO4F are not established so far. Still, the stability of the "VPO4F" framework, which does not undergo any significant distortions or changes in interatomic distances during the de/intercalation of both small Li and much larger K ions, allows to exclude emerging of severe lattice transformations upon Na de/intercalation. In other words, it was assumed that the possible topology and dimensionality of the migration pathways in NaxK1-xVPO4F could be tentatively analyzed based on the initial structural model of KVPO4F, with K atoms being manually replaced by Na and unit cell parameters being decreased so that the cell volume is reduced by 2.5%.
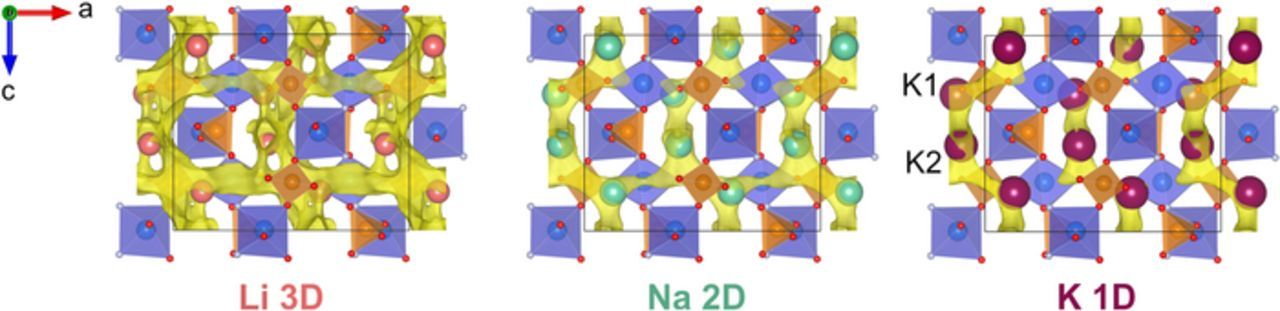
Figure 3. The ball-polyhedral representation of the KVPO4F crystal structure and the visualization of alkali ion migration pathways as bond valence energy isosurfaces. VO4F2 are depicted as blue octahedra, PO4 – dark-orange tetrahedra, oxygen and fluorine atoms – red and gray spheres respectively.
The migration maps of three alkali ions in AVPO4F obtained using BVEL calculations are demonstrated in Figure 3. According to the BVEL results, all alkali metal positions are to be involved into the diffusion process. The migration network dimensionality varies depending on the nature of the alkali metal: from 3D in case of Li to 2D and 1D for Na and K respectively (Figure 3). The Li+ migration map comprises all three geometrically accessible channels along the a, b and c axes. Na+ ions seem to follow a two-dimensional pathway in the (010) plane while K+ ions exhibit a curved one-dimensional diffusion profile along the c axis. A preferable 1D ionic transport along the [001] direction in the KTP-type structures was repeatedly confirmed by direct ionic conductivity measurements.29–31
Cyclic voltammetry
Figure 4 shows cyclic voltammograms of AVPO4F electrodes in Li+, Na+ and K+ EC/DEC electrolytes. In all the three electrolytes, the shape of the curves is different. In the Li+ electrolyte, (Figure 4a) two pairs of peaks at 3.63 and 3.68 V vs Li+/Li are observed, with the peak-to-peak separations of 20–40 mV. The second set of unresolved peaks is located at ca. 3.93 V. Another anodic peak is observed at 4.13 V, with the cathodic peak being merged with the peaks at more negative potentials. Previous studies15 showed that up to the potential of 4.25 V ca. 0.5 K ions are substituted for Li ions. As further increase in the anodic potential limit results in a slow degradation of the material, the electrochemical measurements in the Li+ electrolyte were restricted to 4.25 V implying the maximal deintercalation level in this study of 0.5 Li ions per formula unit. The results of EDX analysis of the electrode cycled in lithium electrolyte (Table I) confirm this consideration.
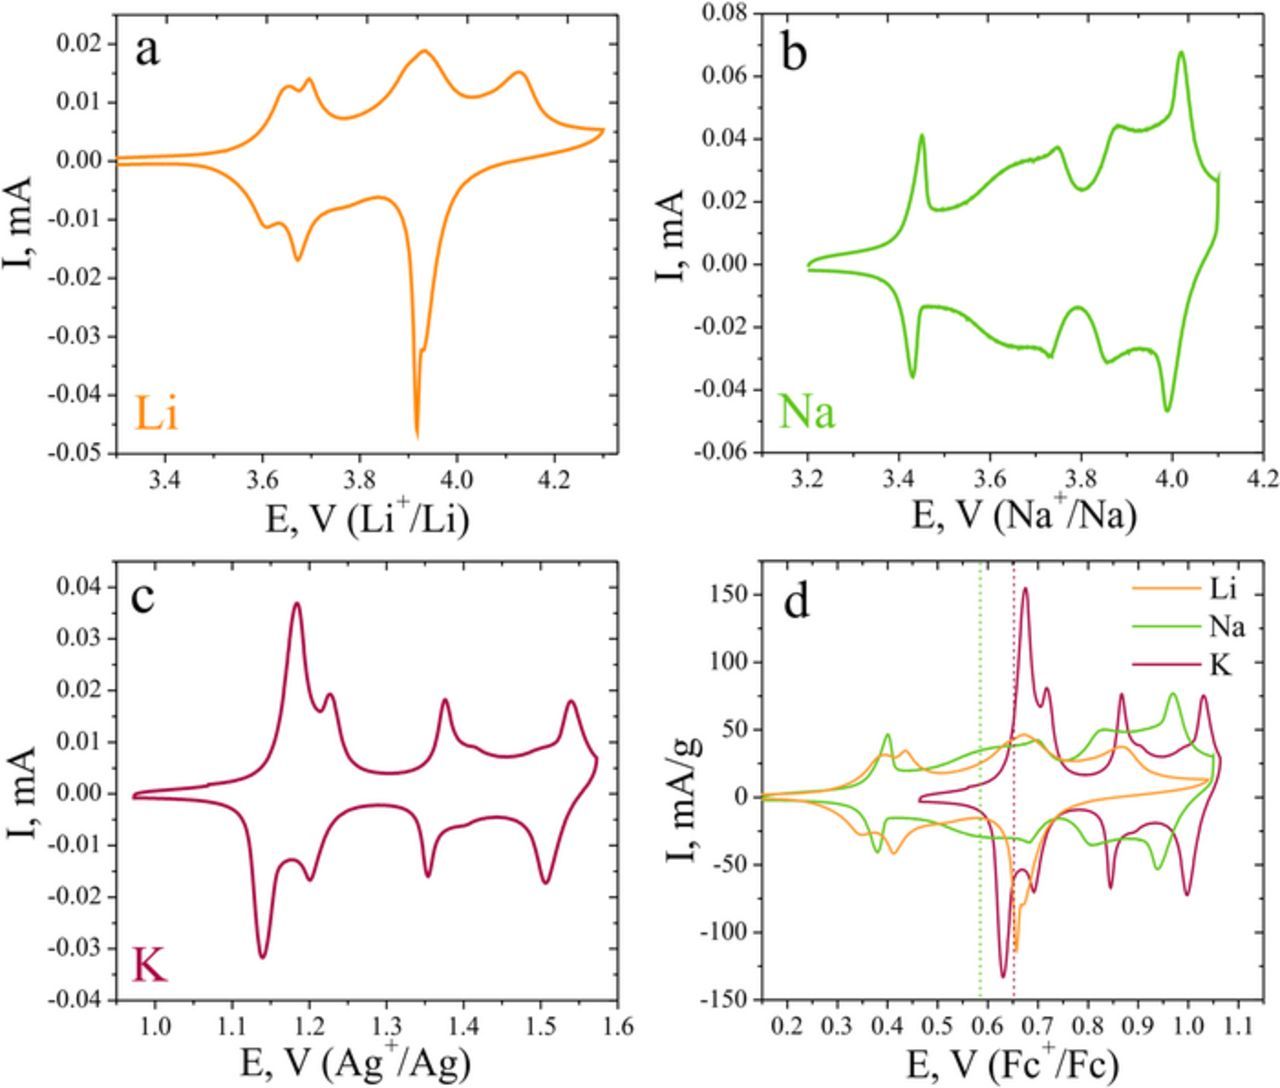
Figure 4. Cyclic voltammograms of AVPO4F electrodes in Li+ (a), Na+ (b) and K+ (c) electrolytes. Voltammograms for all cations in the common reference Fc+/Fc potential scale (d). Scan rate is 50 μV·s−1. Vertical bars designate formal potentials of the first de/intercalation process in K+ and second de/intercalation process in Na+ electrolyte.
Table I. The results of EDX analysis for Li and Na intercalated electrodes (completely discharged state) and deintercalated K electrode (up to the potential of 1.6 V vs Ag+/Ag). The data are normalized to the vanadium content.
| K | V | P | Na | |
|---|---|---|---|---|
| Initial material | 0.99(3) | 1.00(2) | 1.00(2) | |
| Li+ electrolyte | 0.52(8) | 1.00(10) | 0.98(10) | |
| Na+ electrolyte | 0.33(9) | 1.00(12) | 1.03(6) | 0.67(21) |
| K+ electrolyte | 0.46(10) | 1.00(5) | 0.97(5) |
Sodium intercalation follows different patterns as compared to the Li system (Figure 4b). The first pair of sharp peaks with a peak-to-peak separation of 20 mV is observed at 3.43 V vs Na+/Na. At 3.70 V two more broad peaks appear, followed by another two pairs of peaks at 3.88–4.10 V. For all the pairs of peaks the peak-to-peak separations are in the range of 20–40 mV, which suggests that at low scan rates the intercalation primarily proceeds under thermodynamic control. According to crystallochemical considerations as well as the results of the BVEL analysis, larger Na+ ions are likely to accommodate the spacious K1 and K2 sites. The EDX analysis of the electrode revealed that 0.7 K+ ions are replaced by Na+ ions upon cycling up to 4.1 V vs Na+/Na.
The cyclic voltammogram of the AVPO4F electrode in the potassium electrolyte (Figure 4c) is similar to that in the sodium electrolyte, except for the first pair of peaks, which is present only in the Na+ electrolyte. Two pairs of sharp well-resolved peaks appear at 1.16–1.21 V vs Ag+/Ag followed by two pairs of more complex shaped peaks at 1.37–1.52 V. The peak-to-peak separations are again small (20–40 mV), pointing to the similar thermodynamic reaction rate control, characteristic for all three alkali metal intercalates into AVPO4F. Ca. 0.55 K ions per formula unit are extracted at the potential of 1.6 V vs Ag+/Ag (Table I).
The potentials of Li+/Li, Na+/Na and Ag+/Ag reference electrodes were calibrated against the potential of the Fc+/Fc redox couple (3.26 V vs Li+/Li) to provide a common potential scale for all three intercalation reactions under study (Figure 4d). It is only possible to compare the redox potentials for the processes of ion insertion/deinsertion reactions for ions, which reside in the similar positions from the viewpoint of interactions with the host lattice. Thus, the comparison of the potential for lithiation of AVPO4F with the potentials of sodium and potassium intercalation/deintercalation reactions would not be adequate, as in the AVPO4F structure, Li+ ions additionally occupy a distinct Li3 site. Due to a less capacious coordination environment this site is not capable to accommodate large Na+ and K+ ions, which results in a completely different Li+ ions de/intercalation behavior from the crystal structure viewpoint. However, we can compare the formal redox potential of the first intercalation/deintercalation pair of peaks in the K electrolyte (0.65 V vs Fc+/Fc) with the similar peaks in the Na electrolyte (0.59 V vs Fc+/Fc). The difference in the formal potentials amounts to 60 mV, while the difference in the solvation energies of K+ and Na+ in carbonate-based electrolyte should amount to ca. 60 kJ·mol−1.32,33 The redox potential of the ion insertion/extraction reaction is determined by the difference between the ion solvation energy, GA+solv, and its energy in the host lattice, GA+cryst:
![Equation ([7])](https://content.cld.iop.org/journals/1945-7111/164/1/A6373/revision1/d0007.gif)
Thus, a 60 kJ·mol−1 difference in solvation energy would imply a ca. 0.6 V difference in the redox potential values, if the energies of Na+ and K+ in the crystal lattice were close. If the formal potential of the first pair of peaks in the Na+ electrolyte is assumed to correspond to the first de/intercalation process in the K+ electrolyte, the difference between the two processes is ca. 275 mV, which is still significantly lower than the calculated 0.6 V potential shift. This apparently contradicts the experimental observations, indicating that GNa+cryst is significantly more negative than the value for K+. This is in a qualitative agreement with the results of BVEL analysis, which indicates that the accommodation and migration of the Na+ ions within the KVPO4F lattice are ca. 50 kJ·mol−1 more energetically favorable in comparison to the K+ ones (see AVPO4F crystal structure and diffusion pathways section). Obviously, quantitative estimates of the potential differences for all three intercalation reactions can be attained in the framework of higher-level computational approaches such as DFT.
Apparent diffusion coefficients
Apparent diffusion coefficient values for Li+, Na+ and K+ were determined from PITT data. As for all the three intercalation reactions under study the shape of the peaks does not correspond to the simple semi-infinite solid state diffusion control,34 the data cannot be analyzed by using simple forms of Cottrell's equation. Based on the BVEL results, planar, cylindrical and spherical diffusion geometries were adapted for modeling K+, Na+ and Li+ diffusion in AVPO4F host, respectively. Kinetic parameter Λ, evaluated from the fitting of experimental current transients, can be used for a qualitative comparison of the ratios of diffusion and charge transfer resistance values for the reaction.27
Figure 5 shows apparent diffusion coefficients, calculated using Montella's methodology, as well as incremental charges Q at each potential step. For the lithium intercalation reaction (Figure 5a) two sharp peaks in the Q(E) dependence are observed at 3.63 and 3.68 V vs Li+/Li, followed by a complex broad peak in the potential region 3.85–4.05 V. The anodic peak at 4.1 V in the cyclic voltammogram is absent in the Q(E) plot, which is indicative of a very slow process, which does not attain an equilibrium state under the conditions of a slow potential scan. The diffusion coefficient varies greatly with the composition, showing distinct minima, which coincide with the first peaks in Q(E). In the potential region of 3.85–4.10 V an increase in the D values is observed (from 3·10−14 to 5·10−13 cm2·s−1). The kinetic parameter of Montella's model is in the order of 10, which indicates the predominantly diffusional reaction rate control. This is not surprising given that the low apparent diffusion coefficient values possibly originate from stronger "pinning" interactions of Li+ ions with the lattice, which might severely hinder their diffusion within the structure.
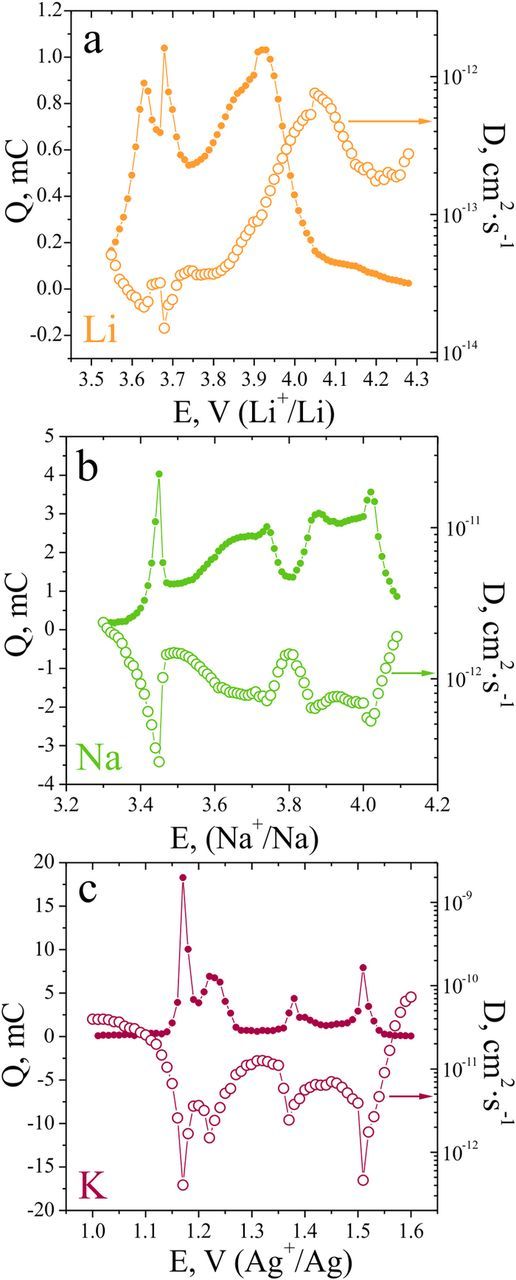
Figure 5. Incremental charges during the deintercalation of Li+ (a), Na+ (b) and K+ (c) from AVPO4F and apparent diffusion coefficients, as determined from PITT data.
In the sodium electrolyte (Figure 5b) the incremental charge vs potential dependence shows a series of maxima at the potentials, corresponding to phase transitions or ordering phenomena upon Na+ deintercalation. The diffusion coefficient follows the trends in Q(E) plot, showing pronounced minima in the vicinity of corresponding CV peaks. We stress that this is a purely artificial result, originating from the application of the formalism, derived only for single-phase systems, and the corresponding minimum D values in the two-phase coexistence regions should be regarded as unphysical.27,28 In the regions of presumable single-phase behavior, the diffusion coefficients are in the order of 1–2·10−12 cm2·s−1. The kinetic parameter Λ values, evaluated from the fitting of the current transients, are close to the value of 6, indicating a rather fast charge-transfer kinetics and mainly diffusion control of the intercalation reaction at high scan rates under cyclic voltammetry conditions or high charge-discharge rates under the conditions of galvanostatic cycling.
In the K+ electrolyte (Figure 5c) the incremental charge vs potential dependence is similar to that in the sodium electrolyte. The apparent diffusion coefficient values in the regions between the deintercalation maxima are in the range 6·10−12–4·10−11 cm2·s−1. The Λ value for K+ intercalation amounts to 1.5–2.0, which points to the slower charge-transfer kinetics, as compared to the sodium system, and mixed (diffusion and kinetic) reaction rate control.
The comparison of the average values of diffusion coefficients for Li+, Na+ and K+ in the AVPO4F material suggests that the lowest diffusion coefficient value is observed for Li ion, while the diffusion coefficient of K+ is 0.5 – 1 orders of magnitude higher than that of Na+ ion. A similar effect of the intercalating cation nature on the D value was observed in Ref. 9 for nickel hexacyanoferrate Prussian blue analogue.
If absolute D values are addressed, the value of 10−13 cm2·s−1 for lithium ion diffusion in AVPO4F matrix is significantly lower, than the values for LiCoO2 (10−9 – 10−11 cm2·s−1) and LiMn2O4 (10−10 – 10−12 cm2·s−1) conventional cathode materials, nevertheless, it is still higher than in LiFePO4 material (10−13 – 10−15 cm2·s−1).35 Given the low values of the particles size, low diffusion coefficients for Li+ ion should not limit the performance of the material even at substantially high scan rates.
Sodium diffusion coefficients (10−12 cm2·s−1) in AVPO4F are substantially higher than the values reported for a promising Na intercalating material Na2/3Fe1/2Mn1/2O2 (10−13 – 10−14 cm2·s−1),36 and comparable to the D value for Na3V2(PO4)2F3 (10−12 – 10−13 cm2·s−1).37 Potassium diffusion in AVPO4F (D ∼ 10−11 cm2·s−1) is slower than in the Prussian blue cathode (D ∼ 10−10 – 10−11 cm2·s−1),38 but still is fast compared to diffusion of Li+ and Na+ in conventional cathode materials, which makes this system very attractive for technological applications.
Charge transfer kinetics
Estimating charge transfer resistance values for an ion intercalation reaction provides a direct way to assess the rate of charge transfer. For an ion transfer reaction, in the simplest consideration, the value of the charge transfer resistance, Rct, should reflect the contributions from the ion desolvation and the transition of the ion through EEI. These two steps were shown to provide the highest contribution to the activation barrier of the reaction in computational studies of ion transfer processes in the course of metal deposition.39,40 Obviously, more complicated kinetic mechanisms can take place in an ion intercalation reaction (preceding ion adsorption or slow insertion of the ion into the oxide matrix). However, given the scarcity of experimental information, consideration of complex schemes can hardly be advantageous.
Rct values were determined from the impedance spectra, registered in the course of the ion deintercalation reaction in the Li+, Na+, and K+ electrolytes. Analogously to the treatment of PITT data, different diffusion geometries were applied to model the spectra. Figure 6 collects representative impedance spectra, registered for all three alkali ion electrolytes.
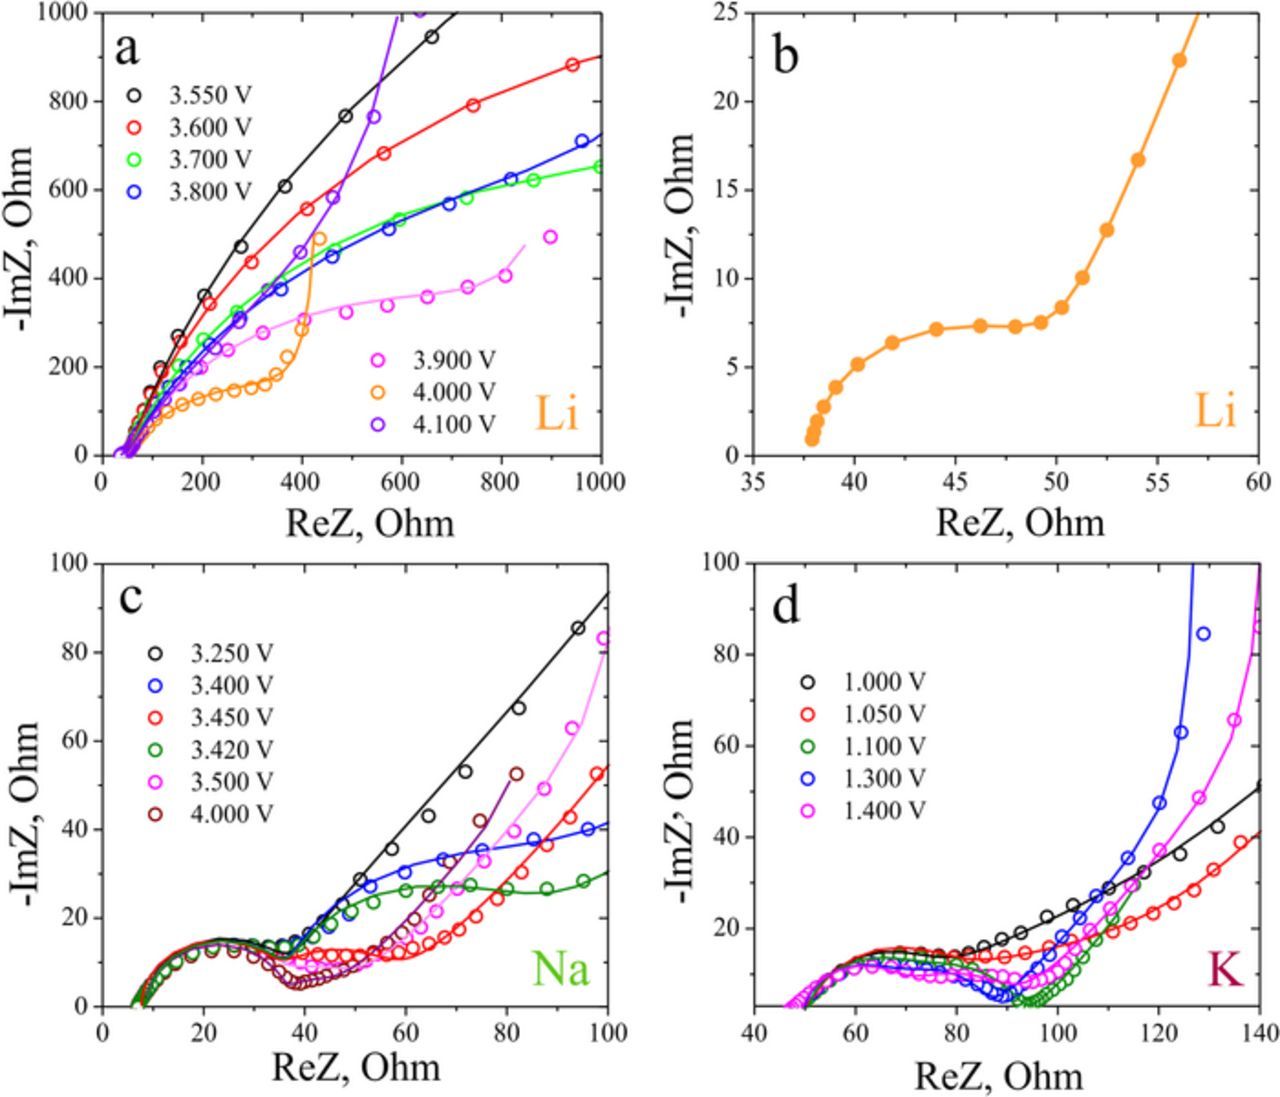
Figure 6. Representative impedance spectra of AVPO4F electrodes in Li+ (a), Na+ (c) and K+ electrolytes (d) and the fits of the spectra (solid lines) to the equivalent circuit in Figure 2. High-frequency part of the impedance spectrum in lithium electrolyte (b).
The impedance spectra in the Li+ electrolyte show a large potential-dependent semicircle at medium frequencies (Figure 6a), and a smaller semicircle in the high-frequency limit (Figure 6b). The high-frequency semicircle was attributed to the resistance of surface layers (RCEI), while the medium frequency semicircle is considered to reflect the reaction charge transfer resistance, according to the conventional treatment in literature.22–24 While the radius of the high frequency semicircle remained almost constant in the course of the deintercalation process, the radius of the lower frequency semicircle decreases significantly with the increase in the potential values (from ca. 40 kOhm·cm2 at 3.550 V to 6 kOhm·cm2 at 4.000 V). At the potentials over 3.9 V vs Li+/Li, Warburg and capacitive parts of the impedance spectra can be detected in the selected frequency range.
For sodium and potassium, CEI and charge transfer resistance semicircles are not well-resolved at all potentials during the deintercalation. However, the indications of the presence of two partially overlapping semicircles can be clearly observed (Figures 6c, 6d). Good fits of the experimental data to the selected equivalent circuit can be achieved with the constant radius of the first semicircle, while the radius of the second semicircle demonstrates significant variation with the potential. The RCEI values in the K+ and Na+ electrolytes were found to be close to the values, observed in the Li+ electrolyte (20–30 Ohm for ca. 0.4 mg of active material in the electrodes), while the Rct values were at least one order of magnitude lower than those in the Li+ electrolyte.
Figure 7 shows the potential dependence of charge transfer resistances for three de/intercalation reactions in the common Fc+/Fc potential scale. The Rct values are normalized per true surface area of the electrode, which was calculated from the coulometric mass of the material and the average particle size. For all the intercalating cations the Rct values exhibit a significant dependence on the composition. In the Butler-Volmer kinetic model, the charge transfer resistance value is given by:
![Equation ([8])](https://content.cld.iop.org/journals/1945-7111/164/1/A6373/revision1/d0008.gif)
where n is the number of transferred electrons, i0 – exchange current density, ks – heterogeneous rate constant of charge transfer, α – transfer coefficient, cR, cO – concentration of ion involved in the reaction and vacancy concentration, respectively. The main reason of the Rct variation with the potential, if a simple one-step charge-transfer model is assumed, originates from the kscαRc1 − αO factor, which leads to a very sharp increase in Rct in the beginning of the de/intercalation, when the ions/vacancy concentration is very low. Such a variation can be found in literature data for LiCoO2 electrodes.24 However, the charge transfer resistance values for the deintercalation of Li ions from the AVPO4F material do not exhibit a sharp initial rise in Rct. This might suggest that the limiting step for the lithium intercalation/deintercalation involves a chemical step of ion desolvation. More conclusive information could be obtained by evaluating the potential dependence of the intrinsic rate constant, ks, which can also show a variation in the different phases of the material. However, the rate constant cannot be estimated without the information on the intercalation isotherm and the ranges of the stability for all the phases, which are formed in the course of intercalation. The detailed structural study of the AVPO4F material upon the intercalation of different cations will be the scope of our further studies.
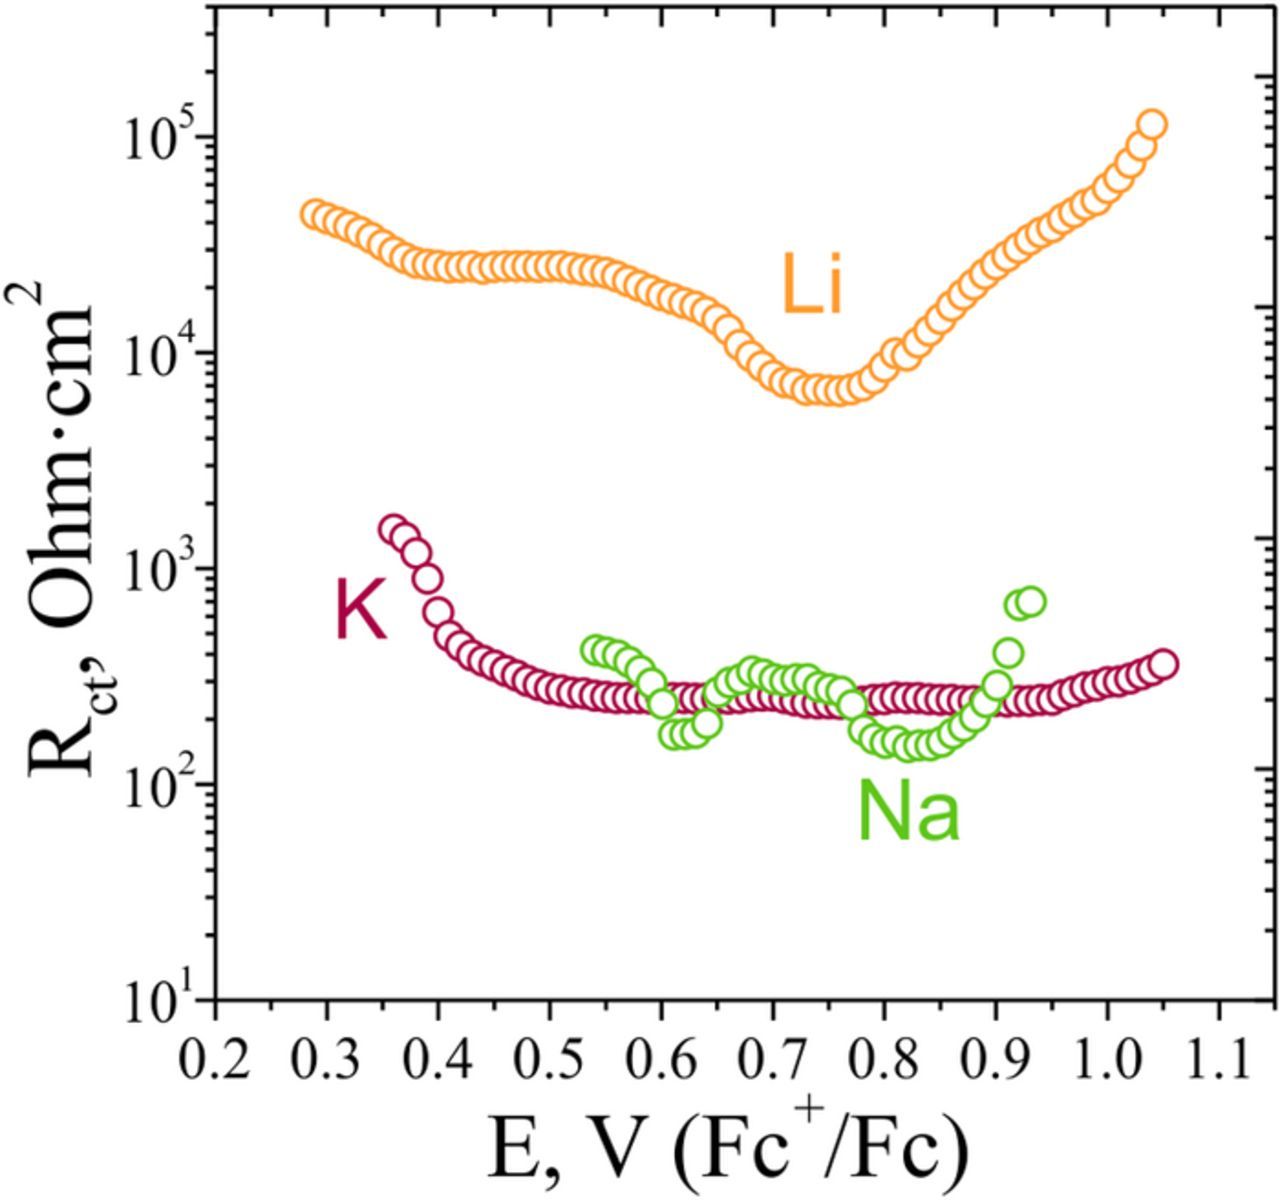
Figure 7. Potential dependence of the charge transfer resistance values in the Li+, Na+ and K+ electrolytes, normalized to the active surface area of the electrodes.
In the Na+ and K+ electrolytes at the beginning of the deintercalation the variation in the charge-transfer resistance is higher, than that in the Li+ electrolyte. However, this variation is still low in comparison to the predictions from Butler-Volmer kinetics. Thus, the preceding desolvation step is also likely to affect the rate of the Li+ and Na+ intercalation reaction.
If the charge transfer resistance values for Li+, Na+ and K+ cations are compared in the regions far from the beginning of the deintercalation, where these values are relatively constant, it can be seen that the Rct values for lithium deintercalation are one order of magnitude higher than those for the Na+ and K+ intercalation. This can be tentatively attributed to the higher desolvation energy of lithium (ca. 110 and 170 kJ/mol more negative than the values for Na+ and K+, respectively), which should result in a higher activation barrier and lower reaction rate. The charge transfer resistance values for Na+ and K+ intercalation reaction are in the range of 150–300 kOhm·cm2, and given the variation of Rct in the K+ electrolyte it is hard to draw a solid conclusion on the relation of the charge transfer rate for the two intercalation reactions. However, it is clear that for the suggested limiting step of the ion desolvation, the barrier should be considerably higher for sodium ions, and the charge transfer resistance should be higher. These considerations imply that for the potassium ion, which is the largest ion in the series, the transition through the CEI/electrode interface involving the displacement of adsorbate layers from the oxide surface, might be rate limiting.
The results of our study are in agreement with the previous findings of Z. Ogumi's group. It was demonstrated that the intercalation reaction activation energies for a range of materials (LiCoO2, LiMn2O4, Li4/3Ti5/3O4) are very close in carbonate electrolytes (propylene carbonate PC, EC/DEC, EC/DMC).1,3,5,41 This is a very strong indication that the overall rate of the intercalation reaction is controlled by the solvent properties. Later it was found that the Rct value shows a pronounced dependence on the presence of EEI-forming additives.2 This finding showed that the transition of the ion through the EEI, rather than desolvation alone, contributes to the reaction activation barrier. Our results suggest that the interplay between the desolvation energy and the energy for ionic transition through EEI results in different limiting steps for ions of different size.
The presented kinetic analysis is based on a very crude assumption of the ion intercalation mechanism, which comprises ion desolvation and transition through EEI as rate limiting steps. However, this apparently simplified treatment allowed us to rationalize the experimental observations on the rate of different cations intercalation into the AVPO4F material, suggesting factors, which primarily determine the reaction rates for Li+, Na+ (desolvation step) and K+ (transition through adsorbate layer/electrode interface).
Conclusions
In this study, we took advantage of the rare property of KVPO4F material to reversibly incorporate three alkali metal ions with the preservation of the host structure. Application of cyclic voltammetry, PITT and EIS techniques allowed us to determine key diffusional and kinetic parameters of the intercalation reaction and to compare them for different metal ions. Solid state transport properties were found to be very different for Li+, Na+ and K+ ions, the lowest values of the apparent diffusion coefficient being observed for lithium ion, while the diffusivity of K+ was found to be the highest in the series.
Analysis of the charge transfer resistance values for AVPO4F electrodes in the three electrolytes under study allowed us to highlight the pronounced differences in the charge transfer rate for Li ion, as compared to the reaction rates for Na and K ions. The rate of the lithiation reaction was found to be 1–2 orders of magnitude lower than that for the reactions of Na+ and K+ insertion. This difference was assigned to the high contribution of the desolvation of the small lithium ion to the reaction activation barrier. At the same time, close values of charge transfer resistances, observed for Na+ and K+, were tentatively attributed to the higher energy of the largest K+ ion transfer through the adsorbate barrier layers. These results suggest that the intercalation reaction control may differ for the ions of different size and charge. For smaller (or highly charged) ions the desolvation step is likely to limit the reaction rate, while for the larger weakly solvated ions the transition through CEI(SEI)/electrode interface could provide the dominant contribution into the reaction activation barrier.
In our simplified qualitative consideration only two possible limiting steps of the intercalation reaction are addressed, which, of course, does not allow for the generalization of the formulated conclusions. More experimental studies on selected model systems involving the variation of the solvent dielectric properties, material's structure and the nature of the intercalating cations are essential for the development of non-phenomenologic models of ion intercalation and ion transfer. However, even in the framework of this simplified treatment, we were able to draw self-consistent conclusions on the possible kinetic limitations for the selected reactions. Moreover, the presented results provide the opportunity to suggest that the application of AVPO4F as a cathode material for lithium-ion batteries might not optimal due to the relatively low diffusion coefficient values and high charge transfer resistance. Employment of this material in sodium-ion and especially potassium-ion batteries should be even more attractive, resulting in higher capacity and rate capability characteristics.
Acknowledgments
VAN acknowledges RFBR financial support (grant No. 16-33-60036 mol_a_dk) for funding the electrochemical kinetic analysis study. SSF, ASS and NRK acknowledge the financial support of Russian Science Foundation (grant 16-19-00190). EVA acknowledges NGP grant 2016-1/NGP. This work was also supported by Skoltech Center for Electrochemical Energy Storage and the Lomonosov Moscow State University Program of Development up to 2020.