Abstract
Single phase (Pr1-xNdx)2NiO4 cathode powders (x = 0, 0.25, 0.50, 0.75, and 1.0) were synthesized via a glycine-nitrate combustion and high temperature calcination. Anode supported cells were used to investigate the cathode property. A reproducible performance, within 9% for each cathode composition, was observed providing a wealth of data for quantitative studies. Area specific resistance analysis and i-V measurements between 650 and 850°C showed a decrease in the cell performance with increasing Nd content. Impedance spectrum analysis suggests that the decline in performance results from an increase in electrode polarization. While Pr2NiO4 cells showed significant performance degradation of 6.40%/1,000 hours, the degradation rate for (Pr0.75Nd0.25)2NiO4 cells was reduced by an order of magnitude (0.56%/1,000 hours) with a 7% lower power output. Likewise, the cathodes with a higher Nd content showed further improvement in performance stability with a marginal degradation rate of 0.06%/1,000 hours.
Export citation and abstract BibTeX RIS

This is an open access article distributed under the terms of the Creative Commons Attribution 4.0 License (CC BY, http://creativecommons.org/licenses/by/4.0/), which permits unrestricted reuse of the work in any medium, provided the original work is properly cited.
During the past few years, praseodymium nickelate (Pr2NiO4+δ, PNO) has attracted increasing attention as the cathode for solid oxide fuel cells (SOFCs) because of its unique properties over a wide temperature range,1–5 including: (1) a high oxygen diffusion coefficient (e.g. 8 × 10⁻⁸ cm2 s−1 at 750°C), (2) a high surface exchange coefficient (e.g. 2 × 10⁻⁶ cm s−1 at 750°C),6 (3) a low polarization resistance in a single cell, (4) a large oxygen overstoichiometry (δ as much as 0.22 at room temperature),6 and (5) the ability to accept various substituents with similar ionic radii and valance at Pr and/or Ni sites.2 Moreover, its coefficient of thermal expansion (13.2 × 10⁻⁶ K−1)4,7 is compatible to doped ceria (13 × 10−6 K−1)7 and yttria-stabilized zirconia (11 × 10−6 K−1)7 electrolytes. The electrochemical performance of PNO, however, did show an appreciative degradation4 which likely resulted from its readily occurring phase transitions at operating conditions.8
PNO partially decomposes to praseodymium oxide (PrOx) and a higher order layered structure (Pr3Ni2O7) during operation,8 which presents a concern because of possible structural collapse and long-term performance degradation.4,8 Current approaches to stabilize the PNO phase focus on substituting A and/or B-site ions.9,10 Both La2NiO4 and Nd2NiO4 (NNO) are more stable than PNO,11 but have lower power density.12 This work reports an attempt to stabilize the long-term cell performance in praseodymium nickelate. (Pr1-xNdx)2NiO4 (PNNO, x = 0, 0.25, 0.50, 0.75, and 1.0) cathodes were synthesized and electrochemically evaluated in anode supported cells. Nd was chosen as an A-site substituent due to its similar physical properties to Pr and its ability to suppress the formation of PrOx and higher order phases. The i-V and electrochemical impedance spectroscopy (EIS) measurements were performed between 650–850°C, while the performance stability was measured at 750°C and 0.8 V for 500 hours.
Experimental
Starting materials, Pr(NO3)3, Nd(NO3)3, and Ni(NO3)2 (99.9% REO, Alfa Aesar, Haverhill, MA) were standardized using thermogravimetric analysis. Glycine nitrate combustion process was used to synthesize the raw powders.13 PNO was calcined at 1080°C in air for 10 hours, while the rest of the PNNO series was calcined at 1150°C for 5 hours. Calcined powders were studied via XRD analysis at room temperature, using a Rigaku Miniflex II (Houston, TX) diffractometer (Cu Kα, 2θ = 20–60°, step 0.02°, 1 s/step) equipped with scintillating and high speed silicon strip (D/teX) detectors.
The anode support and Ni-8YSZ bilayer were prepared through a tape-casting and lamination process.14 The 10-μm thick dense electrolyte was sprayed and sintered at 1350°C. A Gd0.10Ce0.90O1.90 (GDC-10) layer was sprayed on YSZ and sintered at 1250°C.14 Micrometer carbon powder was added as a pore former to single phase PNNO powders, which were then ball milled to obtain mean particle size of 200–300 nm. This particle size distribution was used in cathode ink manufacturing. Cathode inks were screen printed and sintered at 1200°C for 2 hours resulting in 25-μm thickness. The electrode active area was 2 cm2. Metal grids, as cathode current collectors (CCs), were then screen-printed (pastes with 80% metal loading were obtained from Ferro, Cleveland, OH) and sintered at 900°C (Au) or at 1000°C (Pt), resulting in thickness of 10 μm. Pt wires were co-sintered with CCs allowing the four probe measurements.
Each full cell was electrically connected to the test fixture with Pt wires, and then sealed on a tubular alumina stand with a glass paste. A perforated alumina cap was laid on top of the cell and spring-loaded to provide sufficient mechanical contact and air delivery to PNNO electrodes. Anode was provided with 3% humidified H2 at a flow rate of 200 sccm, and the PNNO electrodes were supplied with 400 sccm air. Biologic VMP3 multi-channel potentiostat (Bio-Logic USA, Knoxville, TN) equipped with external current boosters was used for i-V sweep and EIS measurements. The i-V measurements were performed with a 5 mV/s scan rate, and EIS was measured between 0.1 Hz and 50 kHz, with a scan rate of 30 points per decade. The dc and ac measurements were performed every 25 hours of operation.
Results and Discussion
Power density and area specific resistance
Fig. 1 shows i-V and power density curves for PNNO cells operated between 650°C and 850°C. The open circuit voltage (OCV) for all tested cells was in a range of 1.10 ± 0.02 V, suggesting reproducible assembly and quality seals. The i-V curves show nonlinear behaviors as a function of current density, which is consistent with our previous measurements on PNO electrodes.3–4,7–8 With an increase in Nd content, the overall cell performance decreases. For instance, the power densities at 0.7 V at 750°C are 0.85, 0.63, and 0.14 W·cm−2 for PNO, PNNO5050 and NNO, respectively. This may be attributed to the slower kinetics in NNO11 because of its smaller surface exchange coefficient than PNO (e.g. 4 × 10⁻⁷ cm s−1 in NNO vs. 2 × 10⁻⁶ cm s−1 in PNO at 750°C).6 Fig. 1f illustrates the power density as a function of temperature for all cathodes measured at 0.8 V. The power density increases with temperature by threefold for PNO cells, and by an order of magnitude for NNO cells. Therefore, higher operating temperatures are desirable to enhance ORR and ionic transport6 in Nd rich PNNO cathodes.
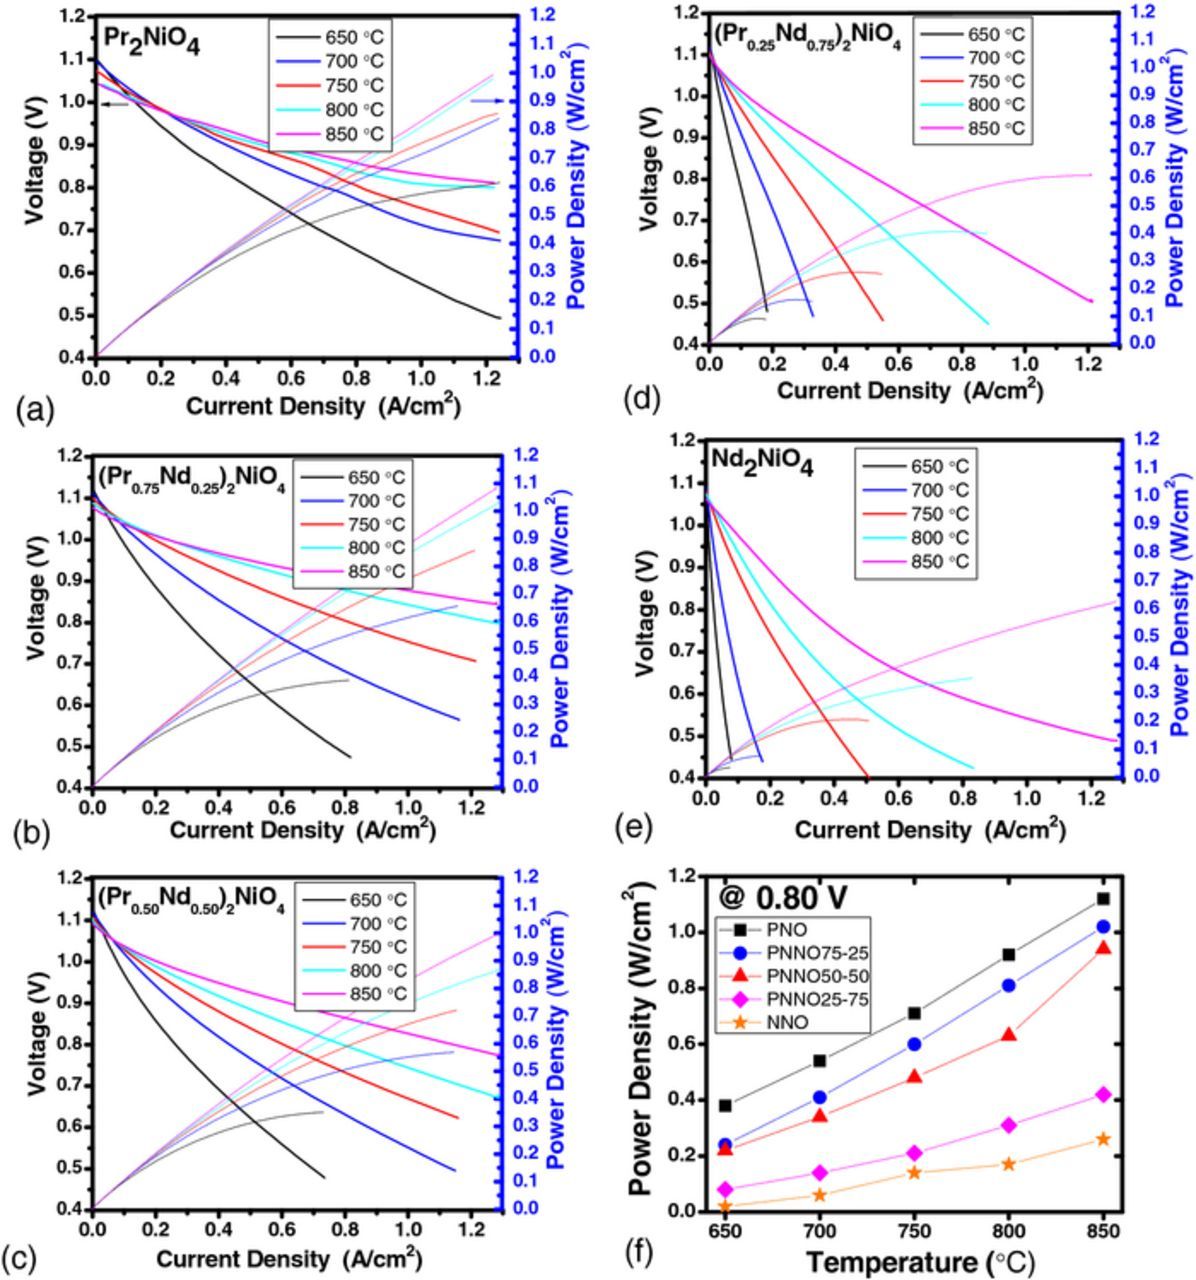
Figure 1. (a-e) Initial i-V and power density curves for (Pr1-xNdx)2NiO4 cathodes as a function of x, operated between 650 and 850°C, and (f) power density measured at 0.80 V as function of temperature for each composition.
The total cell ASR as a function of current density at 750°C is shown in Fig. 2, which was calculated from the slope of i-V curves. The activation polarization region was observed between 0 and ∼ 0.25 A·cm−2 with a large negative slope. In the ohmic polarization region, the total cell ASR is nearly linear with the current density. A positive slope would suggest the existence of the concentration polarization region. PNO was found to have the lowest ASR with a global minimum occurring at 0.80 V. With an increase in Nd content, the cell ASR increases, especially at low current densities, which is attributed to the reaction rate losses in electrodes.

Figure 2. Total cell ASR as a function of current density for (Pr1-xNdx)2NiO4 cells calculated from dc measurements at 750°C.
Additionally, the total cell ASR can be obtained from the analysis of impedance spectra by using an equivalent circuit shown in Fig. 5c. Fig. 3 shows a comparison of the electrode ASR determined from EIS and i-V measurements. The results for the two testing regimes (i-V vs. EIS) were reproducible and within 5% for each cathode composition. With an increase in current density, the overall electrode resistance decreases at 750°C in air. Fig. 4 shows ln(ASRe) as a function of 1/T for all compositions measured at OCV. The electrode ASR decreases with increasing temperature for each cathode composition. PNO and PNNO7525 electrodes have comparably smaller ASR than other PNNO compositions between 650°C and 800°C at all measured currents. This can be attributed to smaller activation energy for the overall electrode reaction for PNO and PNNO7527 (0.87 ± 0.02 eV and 0.91 ± 0.02 eV, respectively). Extrapolated activation energy values from the DRT analysis (Fig. 4b) further show the trend of an increase in Ea in Nd rich compounds. The greater activation energy in Nd-rich compounds results in more active electrodes at temperature >800°C. Therefore, a desirable PNNO composition can be selected while retaining relatively stable long-term performance, based on the operating conditions of SOFC stacks (e.g. temperature and voltage).
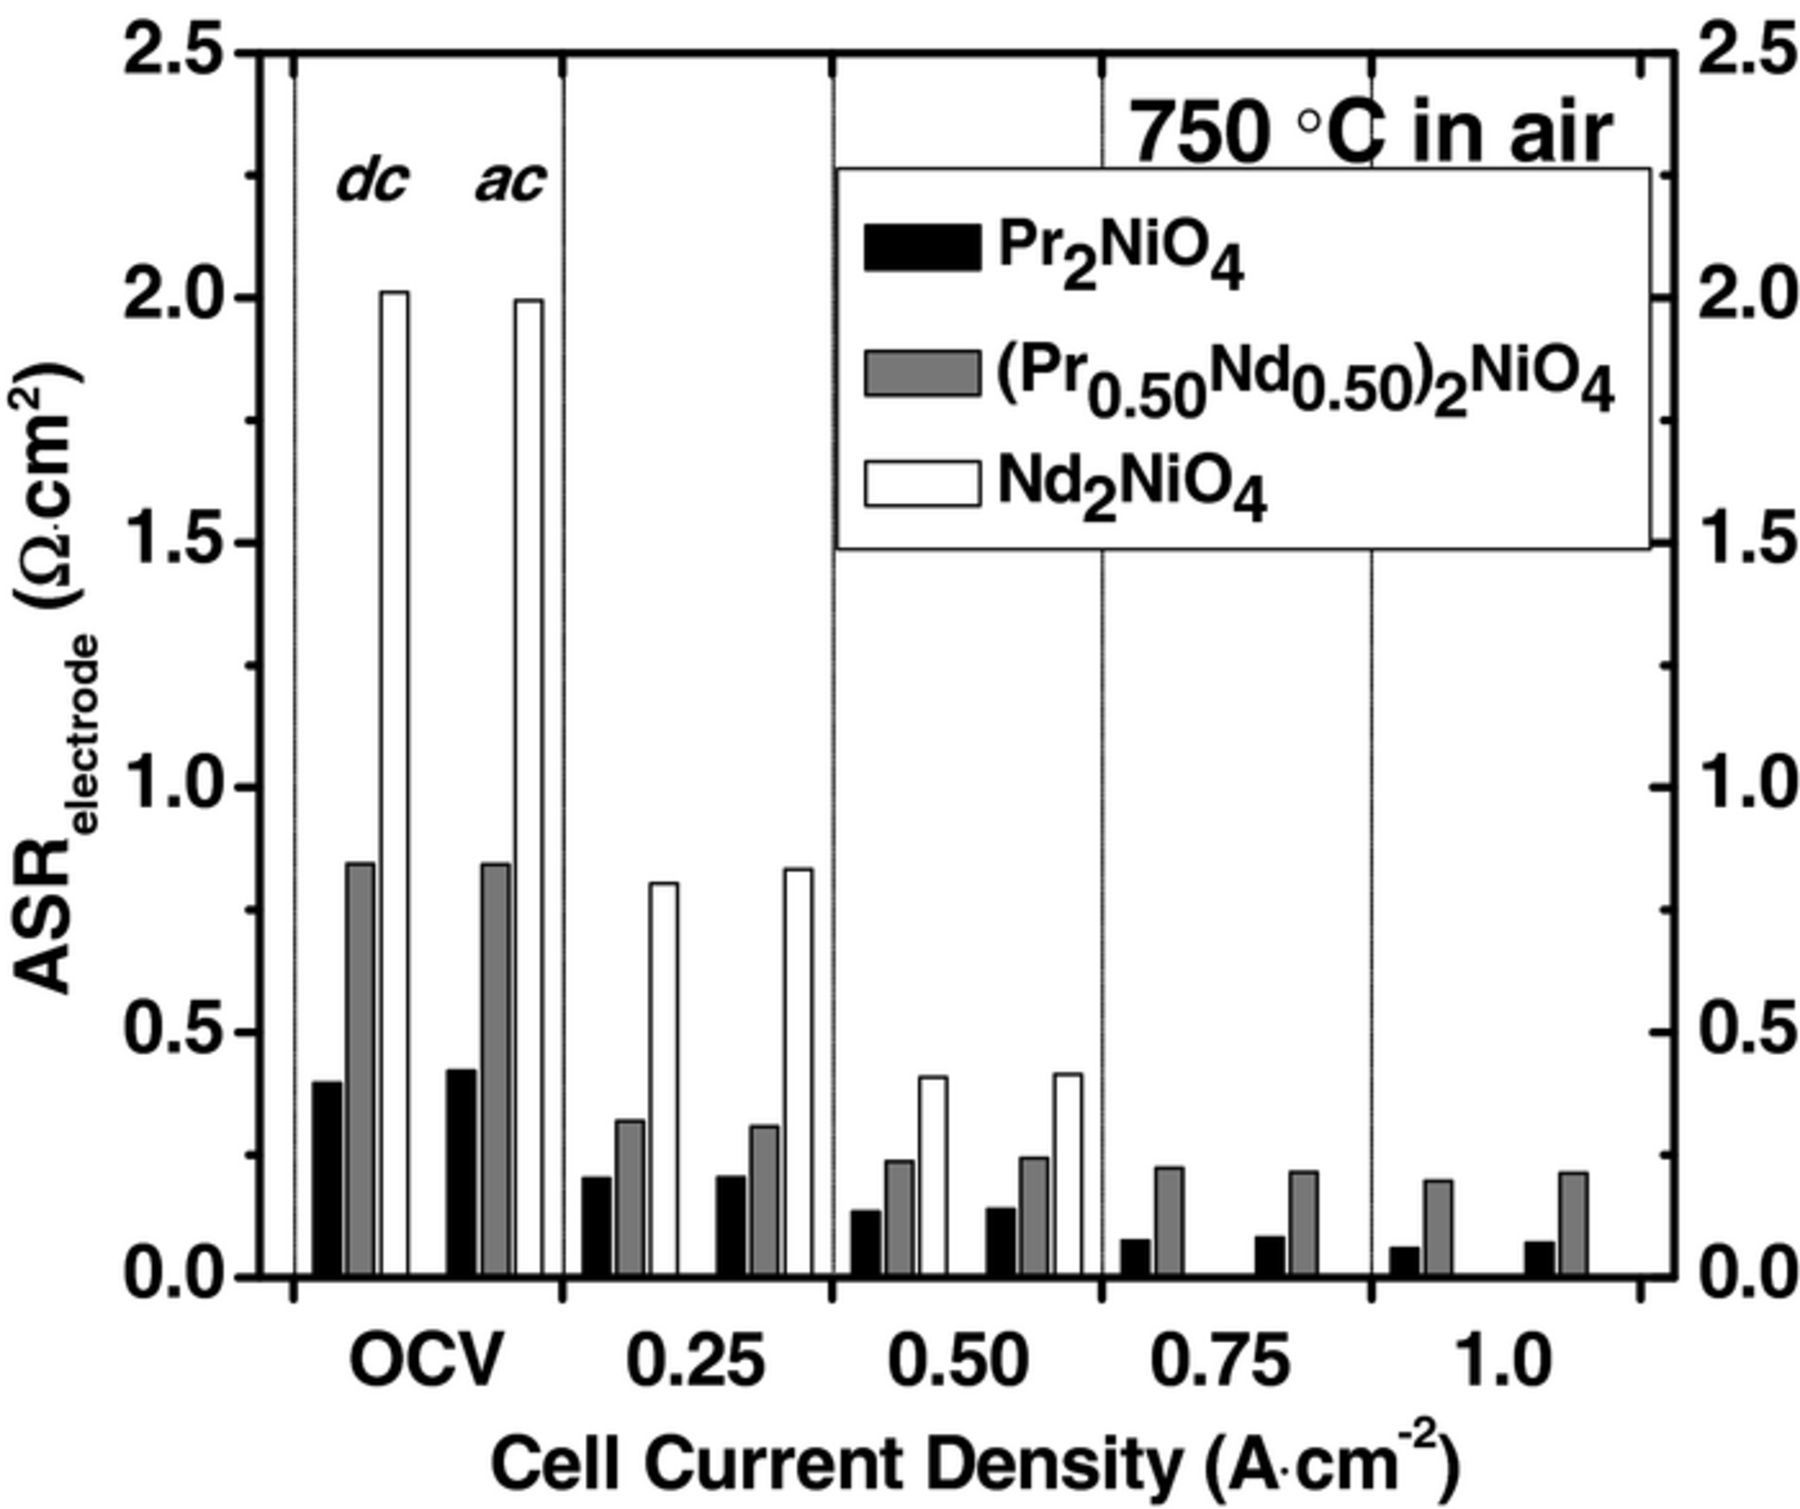
Figure 3. A comparison of the electrode ASR obtained from i-V and EIS measurements at 750°C. ohmic ASR was obtained by using the equivalent circuit presented in Fig. 5c.

Figure 4. (a) Electrode resistance ln (ASRe) as a function of 1/T for all cathode compositions at OCV obtained from i-V curves. (b) A similar plot obtained from the DRT analysis while subtracting the anodic ASR.

Figure 5. (a) DRT analysis on cells as a function of Nd content. (b) DRT analysis on a cell with x = 0.25 exposed to air and oxygen environments. (c) A schematic equivalent circuit model for PNNO cells.
Analysis of the distribution of relaxation times (DRT)
The evolution of DRT spectra for Nd-rich electrodes (x = 0.75 and 1.0) is even more profound than Pr-rich electrodes. The advantage of DRT analysis lies in its high frequency resolution ability,15–18 since it allows to separate neighboring electrode processes which resonate within a half a decade. Consequently, relatively small frequency shifts can be deconvoluted and a unique equivalent circuit model can be constructed for each impedance spectrum. Fig. 5a shows the cathodic peaks P1c, P2c, and P3c dominate in the spectra. The high frequency impedance arc shifts to 5 kHz, as shown in Fig. 6f. The shift is accompanied by corresponding changes in DRT spectra including a shift of P3c peak to higher frequency and an evolution of an additional cathodic process at 35 Hz. A twofold increase in the electrode polarization is consistent with a decrease in performance maxima, as illustrated in Fig. 1.
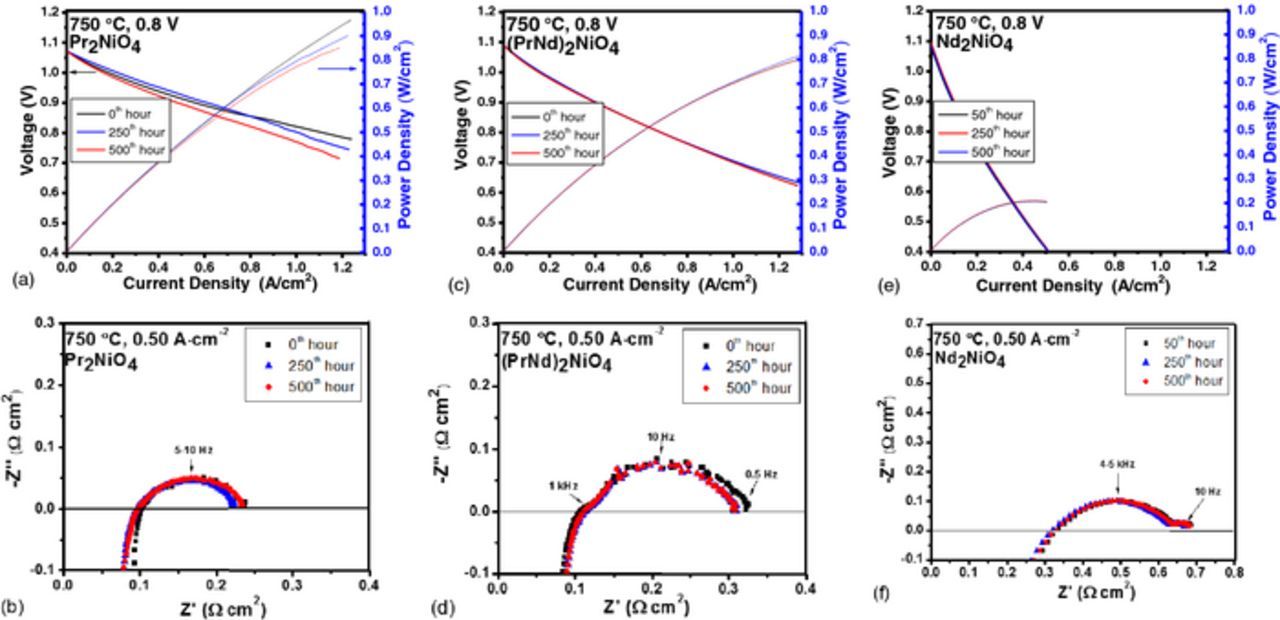
Figure 6. (a-f) Plots of i-V and power density curves for (Pr1-xNdx)2NiO4 cells as a function of time, measured at 0.8 V and 750°C along with corresponding EIS spectra measured at 0, 250th, and 500th hours.
Fig. 5b shows DRT spectra on a cell with the cathode exposed to air and oxygen environments. Since anode conditions were kept constant, the changes in DRT spectrum were dominated by the evolution of cathodic processes. The peak at low frequency (P4a) does not significantly change and is associated with the anodic polarization. With an increase in Nd content from x = 0 to x = 0.50, there is a 20% increase in P3c (10 Hz) peak area. Such changes indicate higher resistance in cathodic processes. The arcs between 5 and 100 Hz (P3c and P2c) are generally assigned to change transfer resistance and double layer capacitance in a cathode, consistent with the DRT analysis at different temperatures15 and under different oxidative environments18 in LSM and LSCF electrodes. The emergence of the low frequency arc at 0.5 Hz, as shown in Fig. 6d, is associated with slower adsorption/desorption of oxygen on the electrode surface,16,17 which is in agreement with an order of magnitude higher surface exchange coefficient for PNO (e.g. 2 × 10⁻⁶ cm s−1 vs. 4 × 10⁻⁷ cm s−1 in NNO at 750°C).6 The high frequency (1 kHz) peak also increases with an increase in Nd-content and is attributed to slower oxygen ion transport from the electrode to the cathode/electrolyte interface.18
Using the combined EIS and DRT results, a general equivalent circuit model was also constructed for PNNO cells, as shown in Fig. 5c. Based on the DRT analysis, the suppressed arcs in EIS spectra (corresponding to P2c and P3c) were fit with the neighboring equivalent circuits, with two parallel sets of resistors and constant phase elements (RCPE). Generated secondary DRT signals of a small intensity were an indication of neighboring RCPE elements. The P1c and P4a peaks were fit with corresponding RC elements. The initial resistance values were given using the DRT results, and the corresponding frequency range for each physical process was used for circuit fitting in ZView software.19 In contrast to DRT analysis, EIS has a low frequency resolution ability and can only recognize two neighboring electrode processes which have relaxation frequency difference of two or three orders of magnitude. Such a low resolution may not provide enough details while constructing the equivalent circuit model. Hence, the DRT analysis in this work shows gradual peak shifts to higher frequency with increasing Nd content followed by an increase in area of cathodic peaks, which corresponds to an increase in resistance of physical processes. Fig. 7 illustrates the resistance for each process identified via DRT. With an increase in Nd content, the resistance for each process increases. A new emerging peak for NNO electrode at ∼35 Hz carries a capacitance value of 3.9 × 10⁻⁴ F cm−2, which lies within the capacitance range for electrochemical reactions on cathodes.20,21 The R3c value also increases as expected from results obtained in Fig. 4. After 500 hours of operation, the resistance of P3c peak in PNO cells increases by 5%, while stable R values were measured in cells with NNO cathodes.
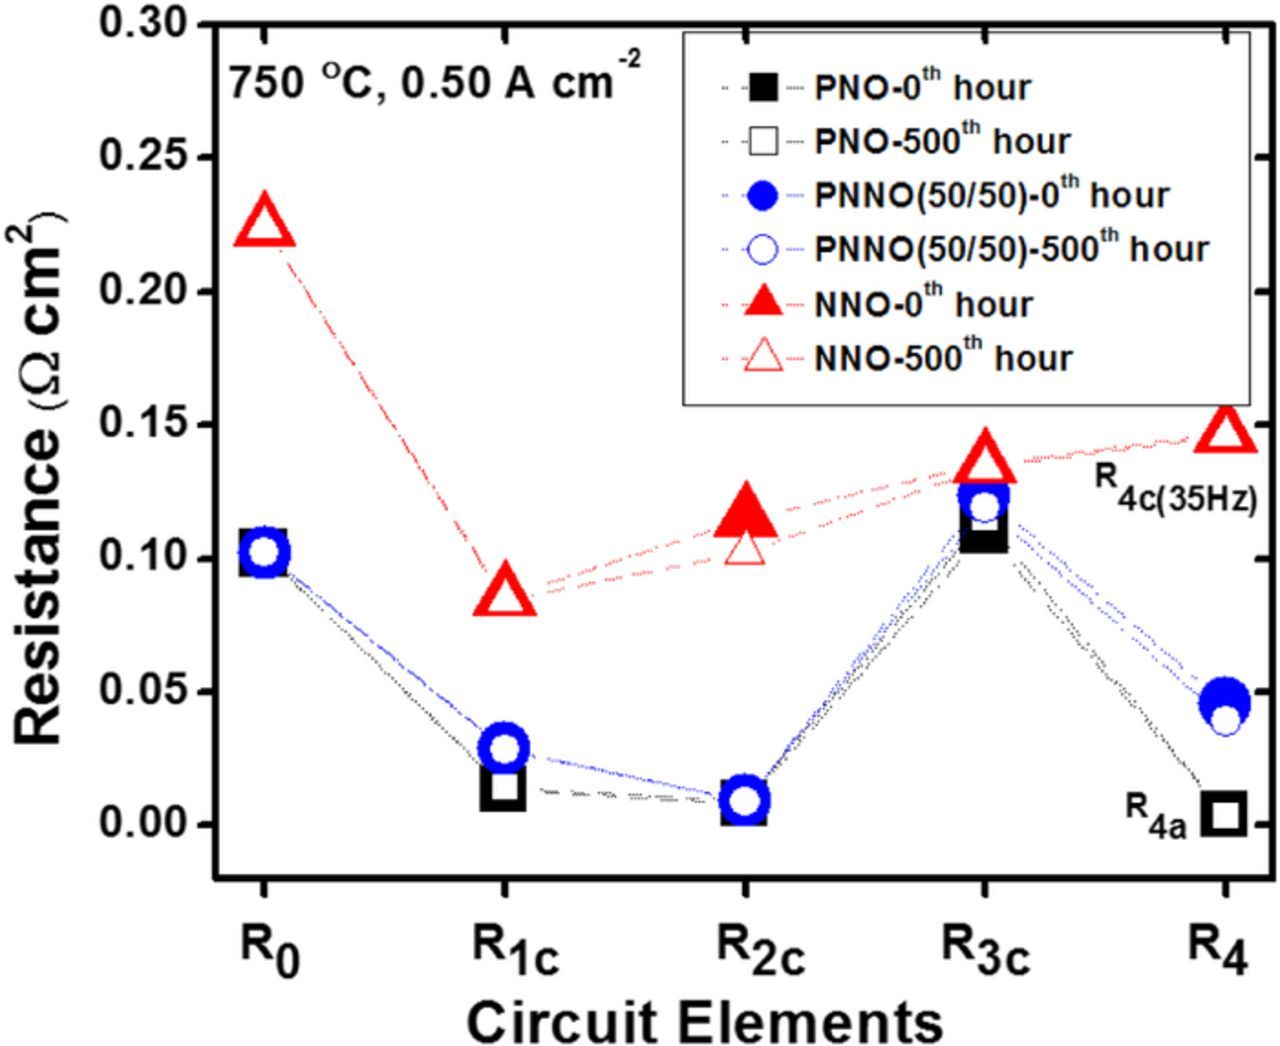
Figure 7. Resistance for each process obtained from the equivalent circuit model in Fig. 5c.
Performance stability
Fig. 6 shows i-V and EIS measurements at a function of time at 0.8 V. The performance degradation in PNO-based cells is more rapid than other compositions. The current density of PNO cathode at 0.8 V decreases from 1.12 A cm−2 to 1.03 A cm−2 after 250 hours, and to 0.90 A cm−2 after 500 hours of operation, while the Nd substituted cathodes retain stable i-V and impedance responses, as shown in Figs. 6c to 6f. With an increase in Nd content, the total cell polarization increases by 29% for x = 0.50 and by twofold for x = 1.0. Fig. 8 shows the long-term performance stability for all PNNO cathodes operated at 0.8 V and 750°C. Cell performance for each cathode composition was within 9% among multiple cells measured.
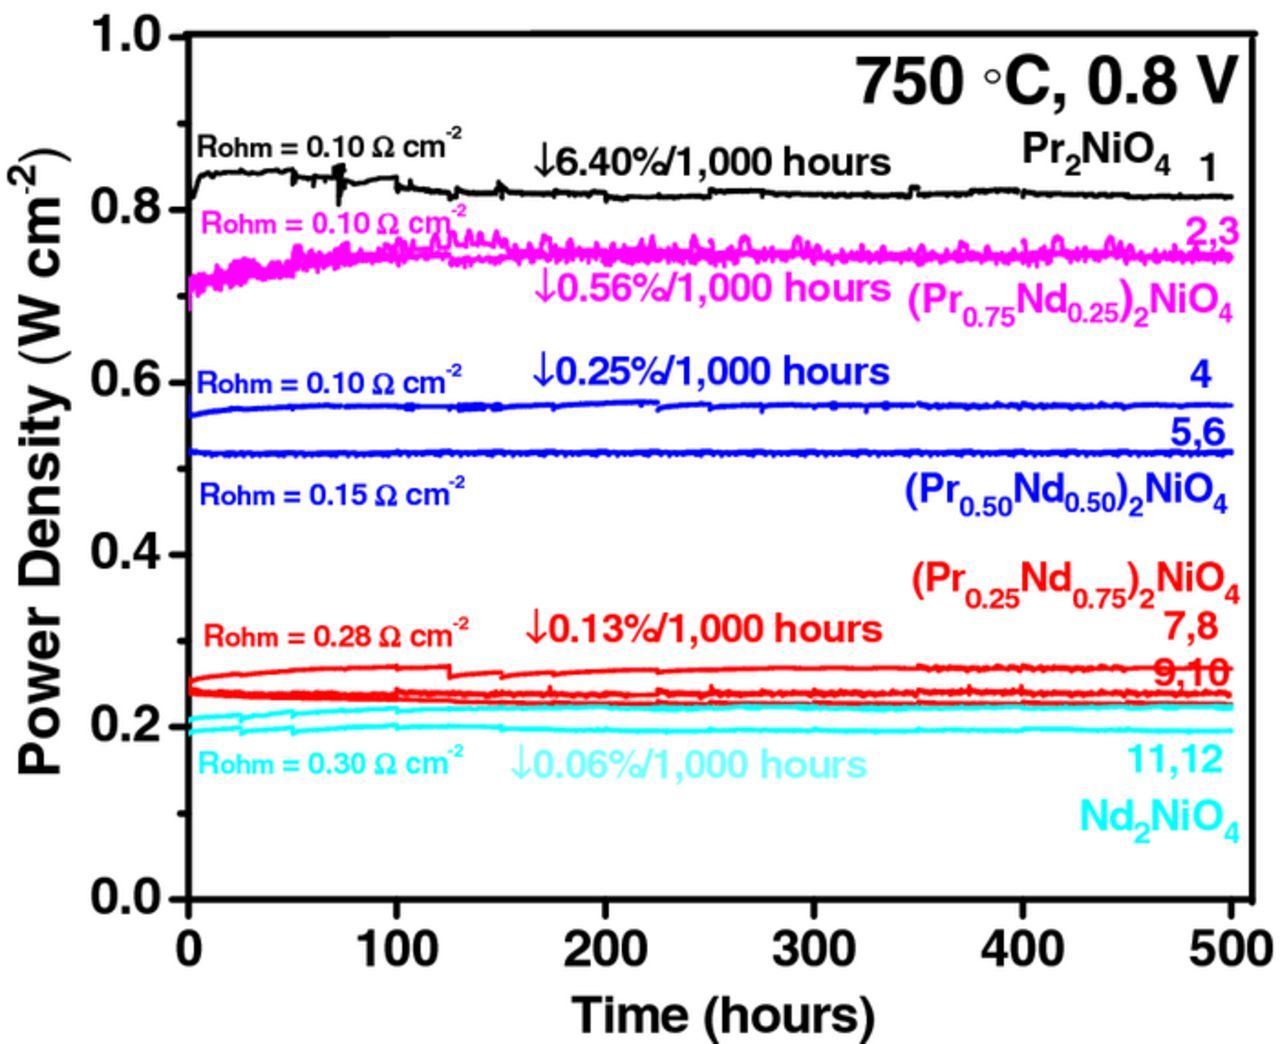
Figure 8. Performance stability for (Pr1-xNdx)2NiO4 cathodes measured at 0.8 V and 750°C.
A rapid initial degradation rate of 3.50% occurs for PNO cells within first 150 hours of operation, after which the performance remains constant. This can be attributed to relatively fast phase evolution in PNO.8 For cells with Nd substituted cathodes, the degradation rates are relatively constant. An unexpected increase in initial cell performance (2–3%) was observed within first 125 hours of operation in cells with platinum current collector. Pt current collector is known to enhance the electrode performance due to its inherent activity toward ORR.22 Indeed, the migration of Pt to the GDC/cathode interface was observed via SEM-EDS analysis. On the other hand, cells with gold current collector did not show changes in initial performance due to its excellent mechanical compatibility with cathodes. 8
Fig. 9 illustrates the evolution of electrode and ohmic resistance as a function of time. Performance degradation in PNO is accompanied by an increase in electrode resistance by 5.80%/1,000 hours (measured at 0.50 A cm−2) and by 13.5%/1,000 hours (measured at 1 A cm−2), while the ohmic resistance remained stable. The cells with Nd-substituted cathodes show remarkable improvements in performance stability accompanied with a decrease in maximum power density, as shown in Fig. 8. A 7% reduction in power density for x = 0.25 was compensated by an order of magnitude increase in performance stability (degradation of 0.56%/1,000 hours). With further Nd substitution, the degradation becomes marginal (a fraction of a percent), indicating that A-site substitution with Nd is a promising solution to stabilize the long term performance in PNO.
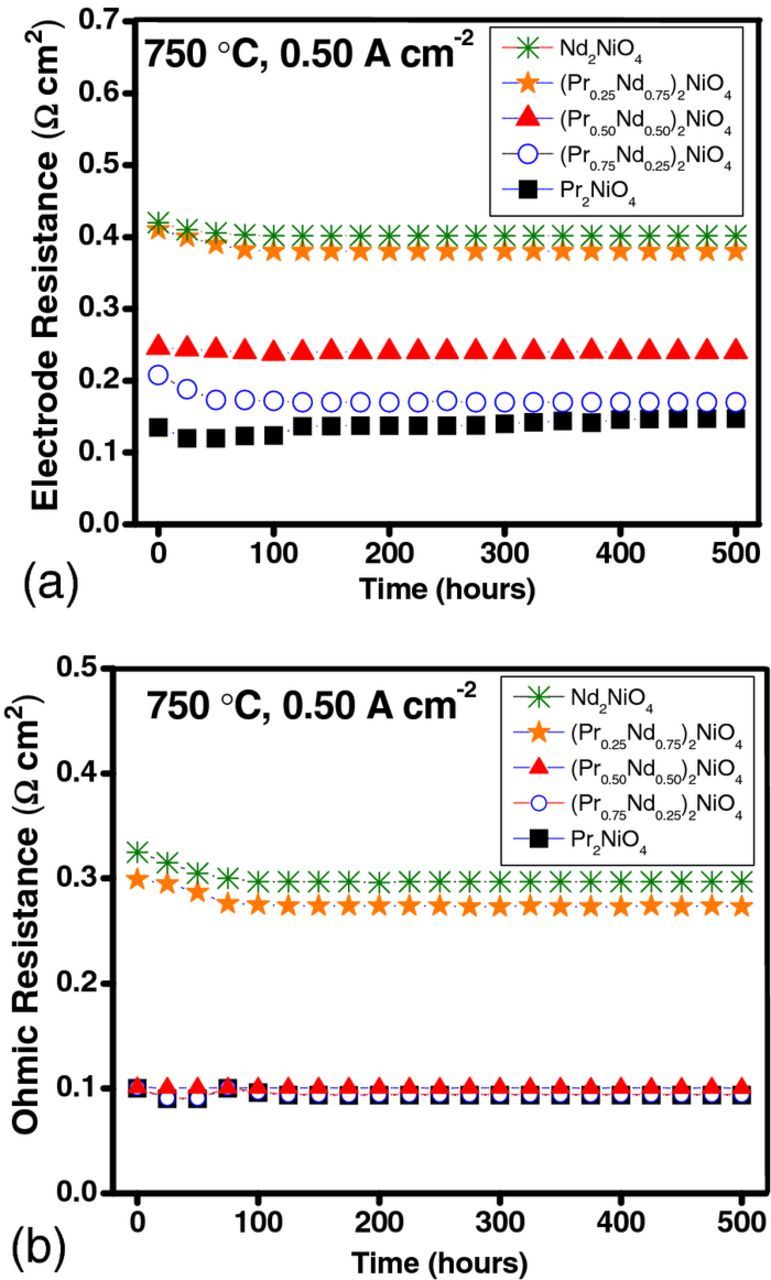
Figure 9. (a) Electrode ASR and (b) ohmic ASR of the cells measured at 0.50 A cm−2 for (Pr1-xNdx)2NiO4 cathodes at 0.8 V.
The performance stability for Nd-rich electrodes was also studied with oxide CCs. (Pr0.25Nd0.75)2NiO4 cells were measured with LaNi0.6Fe0.4O3 (LNF) and (La0.80Sr0.20)0.95CoO3-x (LSC) oxide CCs (Fig. 8, cells 9–10) and NNO cells were measured with LSC current collector (cell 12) and showed consistent power density maxima with those obtained with metal CCs (0.25 W cm−2 for PNNO2575 cells and ∼0.20 W cm−2 for NNO cells at 750°C and 0.8 V). The performance remained stable, with a degradation rate of 0.13% and 0.06%/1,000 hours for PNNO2575 and NNO, respectively.
Conclusions
Electrochemical performance and performance stability of PNNO series as the SOFC cathodes were studied. A reproducible performance, within 9% for each cathode composition, was observed. While Pr2NiO4 cells undergo degradation rate of 6.40%/1,000 hours, each Nd-substituted cathode show improved performance stability, regardless of the current collector used. EIS and DRT analysis showed that an increase in total cell ASR is governed by the increase in electrode polarization, which in turn leads to lower performance maxima. With an increase in Nd content at temperatures ≤750°C, the electrode ASR increases due to lower kinetic parameters of cathodes. At 800–850°C, a significant reduction in the electrode ASR for all Nd substituted compositions was observed, and is consistent with a higher activation energy toward oxygen reduction reaction in Nd doped compounds. Therefore, depending on the systems requirements, PNNO can operate at wide temperature regions to provide a simultaneously stable and active performance.
Acknowledgments
The authors thank the Department of Energy for their support of this project under contract #DE-FE0023475. The authors also thank the support from LG Fuel Cell Systems Inc. WG thank the support from Natural Science Foundation of China (No. 51502316).