Abstract
Lithium-rich and manganese-rich (LMR) layered transition metal (TM) oxide composites with general formula xLi2MnO3·(1-x)LiMO2 (M = Ni, Co, Mn) are promising cathode candidates for high energy density lithium ion batteries. Lithium-manganese-rich TM oxides crystallize as a nanocomposite layered phase whose structure further evolves with electrochemical cycling. Raman spectroscopy is a powerful tool to monitor the crystal chemistry and correlate phase changes with electrochemical behavior. While several groups have reported Raman spectra of lithium rich TM oxides, the data show considerable variability in terms of both the vibrational features observed and their interpretation. In this study, Raman microscopy is used to investigate lithium-rich and manganese-rich TM cathodes as a function of voltage and electrochemical cycling at various temperatures. No growth of a spinel phase is observed within the cycling conditions. However, analysis of the Raman spectra does indicate the structure of LMR-NMC deviates significantly from an ideal layered phase. The results also highlight the importance of using low laser power and large sample sizes to obtain consistent data sets.
Export citation and abstract BibTeX RIS

This is an open access article distributed under the terms of the Creative Commons Attribution Non-Commercial No Derivatives 4.0 License (CC BY-NC-ND, http://creativecommons.org/licenses/by-nc-nd/4.0/), which permits non-commercial reuse, distribution, and reproduction in any medium, provided the original work is not changed in any way and is properly cited. For permission for commercial reuse, please email: oa@electrochem.org.
Lithium-manganese-rich TM oxides form as the integrated structure of two layered phases: xLi2MnO3 with C2/m space group symmetry and (1-x)LiMO2 (M = Co, Mn, Ni, Fe, Cr) with  space group symmetry. While the exact structure of lithium-rich TM oxides has been the subject of much debate, a number of recent studies conclude that the material forms as the composite of these two distinct phases with nanoscale domains of Li2MnO3 and LiMO2 character.1–6 The intense interest in lithium excess cathodes stems from the potential to deliver very large reversible capacities (>200 mAh g−1) when charged beyond 4.5 V vs. Li0/Li+.7 Part of the capacity derives from electrochemical activation of the Li2MnO3 component at voltages beyond 4.4 V. Two mechanisms have been proposed for this activation. The dominant mechanism appears to be the simultaneous removal of lithium and oxygen to form a composition similar to MnO2.8–11 Protons from electrolyte decomposition may also exchange for lithium. This secondary mechanism becomes more significant at higher temperature.12–14 Despite the promise of lithium rich TM oxides to deliver very high capacities, one significant limitation remains the large voltage and capacity fade observed upon extended electrochemical cycling.15,16
A number of studies have attempted to link structural changes in lithium-rich TM oxides with electrochemical stability and cycling behavior.9,17–25 In particular, several groups have applied Raman microscopy to understand the structure and structural evolution of lithium-rich, manganese-rich TM oxides of nickel, manganese, and cobalt (hereafter LMR-NMC).18,19,24,26–31 Raman microscopy offers high spatial resolution (< 1μm3), large field of view, and chemical specificity, making it an ideal tool to investigate both the pristine material and composite battery electrodes.32,33 Nonetheless, there are significant differences in the spectra reported for LMR-NMC oxides, as well as ambiguity in the interpretation of the vibrational modes.18,19,24,30,31 Some of the discrepancy may arise from a failure to recognize the susceptibility of manganese oxides to laser induced phase transformations. In this contribution, we first establish the laser power dependence of the Raman spectra of LMR-NMC cathode. We then study the spectral evolution as a function of charge and electrochemical cycling at laser powers below the damage threshold. No Raman signature corresponding to spinel phase is observed after cycling at moderate currents (50 mA/g) up to 4.7 V vs. Li0/Li+. Moreover, spectra acquired at multiple locations over large electrode areas were highly reproducible for each of the different electrochemical conditions.
Experimental
Electrochemical measurements
Cathodes were prepared from LMR-NMC with composition 0.6Li[Li.33Mn.67]O2-O.4Li[Mn0.3Ni0.45Co.25]O2 (Toda Kogyo Corporation, Japan) using a standard slurry coating onto Al foil.34,35 The cathodes consisted of LMR-NMC active material, polyvinylidene fluoride (PVDF) binder (Aldrich), and carbon black (Super P) in a weight ratio of 85:7.5:7.5. The active material loading was typically 6 mg/cm2. LMR-NMC cathodes were tested in coin-type half cells (size CR2032, Hohsen Corp. Japan) with lithium metal anodes (purity 99.9%, Alfa Aesar) and polymer separators (type 2325, Celgard, Inc., USA). The electrolyte was 1.2 M LiPF6 in ethylene carbonate (EC) and dimethyl carbonate (DMC) 1:2 by weight (Selectilyte, BASF). Electrochemical cells were assembled in a glove box filled with high purity argon. Cells were cycled between 2.0 and 4.7 V at 20 mA/g for the first charge/discharge cycle and at 50 mA/g for all subsequent cycles. To investigate the initial activation step, some cells were charged at 10 mA/g to cutoff voltages of 3.9, 4.2, 4.5, 4.7, and 4.9 V and held at the cutoff voltage for 24 h before further analysis.
Raman spectroscopy
Cells were disassembled under argon atmosphere inside a glove box. LMR-NMC cathodes were rinsed in pure DMC and dried under vacuum. Most cathodes were sealed under argon between two glass slides with UHV epoxy (Torr Seal, Varian) prior to Raman analysis. As control experiments, some cathodes were analyzed in air. Raman spectra were acquired with an Alpha 300 confocal Raman microscope (WITec, GmbH) using a solid-state 532 nm excitation laser, a 20 × objective, and a 600 grooves per millimeter grating. The laser spot size is approximately 1μm. Acquisition times for each spectrum ranged from 30 s to 3 min. To improve the signal to noise, some spectra are averages of at least 5 spectra collected at different locations on the electrode. Spectral deconvolution of the Raman bands was performed using Gaussian line profiles.
Results and Discussion
First, the laser power dependence of the Raman spectra of LMR-NMC electrodes was determined. Figure 1 shows the Raman spectra of pristine cathodes and cathodes that were charged to 4.7 V vs. Li0/Li+ in half cells. The laser power dependence was evaluated for samples sealed under argon and samples exposed to ambient air for the Raman measurement. Bands between 300 and 750 cm−1 correspond to metal oxygen vibrations and bands at 1360 and 1605 cm−1 correspond to the D and G modes of the carbon black conductive additive. The spectra have been rescaled to facilitate comparison. Both laser power and atmosphere have a large impact on the spectra. The shape and relative intensity of the TM oxide modes change as the laser power is increased. Also, oxidation of the carbon can occur at high laser power in air. The spectra are typically stable at powers below 1 mW (1 μm spot size). However, spectra were sometimes observed to change at powers as low as 300 μW. Regions with lower carbon coverage are more easily damaged, likely due to the ability of the carbon coating to conduct heat and prevent thermal decomposition. The instability of manganese oxides under the laser beam is well-known.36–38 For pure manganese oxides, laser heating can result in the formation of Mn3O4 spinel, characterized by a strong peak at 650 cm−1. Differences in synthesis, stoichiometry, and experimental design (in situ vs. ex situ) likely account for some of the variability in the spectra reported so far for lithium-rich TM oxides. However, the results presented here indicate that some of the discrepancy may be due simply to the wide range of laser powers that are used. All subsequent Raman spectra were acquired at the lowest practical power of 100 μW. Electrodes were sealed under argon, although similar spectra are obtained both in air and under argon at sufficiently low laser power.
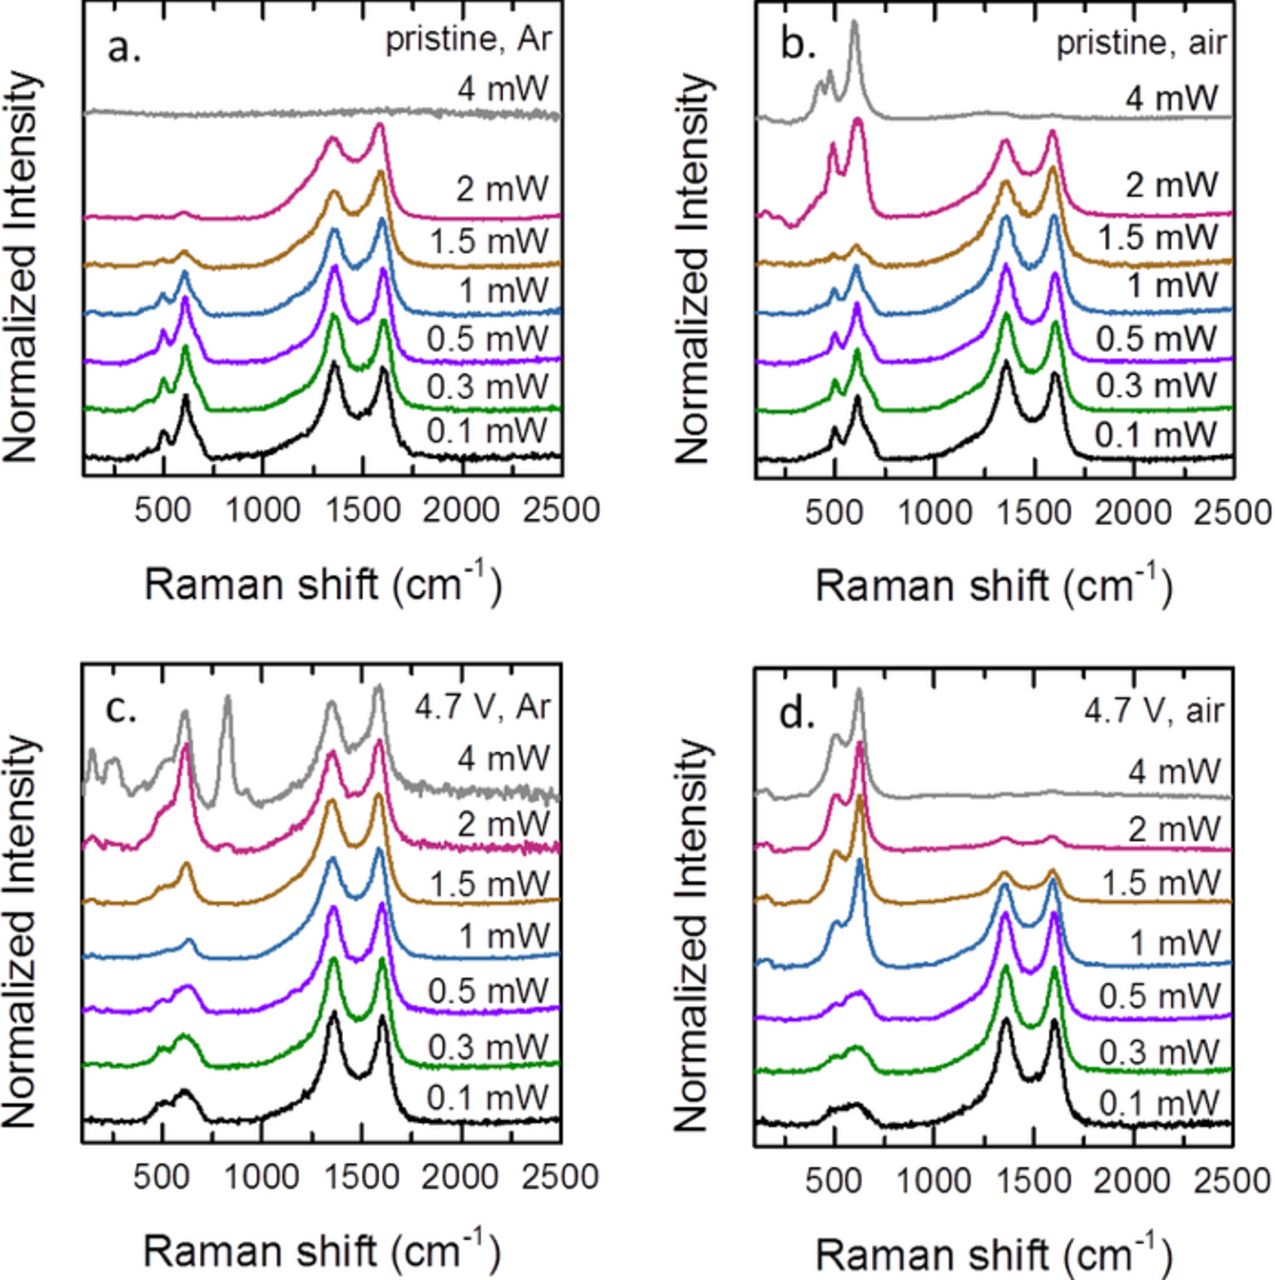
Figure 1. Raman spectra of LMR-NMC cathodes showing the laser power dependence: (a) pristine cathode measured under argon (b) pristine cathode measured in air (c) cathode charged to 4.7 V during the first cycle, measured under argon (d) cathode charged to 4.7 V during the first cycle, measured in air.
Figure 2a shows the Raman spectrum of pristine LMR-NMC along with related manganese oxide (Li2MnO3) and mixed metal oxide phases (NMC-333 and NMC-532). LMR-NMC is a composite of Li2MnO3 and NMC [Li(Ni,Mn,Co)O2] which is clearly reflected in the Raman spectrum. Li2MnO3 crystallizes in the monoclinic C2/m space group and is predicted to show six Raman active modes, although experimentally more peaks are resolved.36 In Li2MnO3, lithium occupies one third of the sites in the transition metal layer (Figure 2c). NMC can be thought of as a solid solution of LiNiO2, LiMnO2, and LiCoO2. Layered LiNiO2, LiCoO2, and high temperature LiCo1-xNixO2 crystallize in the hexagonal  space group which gives rise to only two Raman-active modes, A1g and Eg, corresponding to the out of plane M-O stretch and in plane O-M-O bend respectively.39,40,41–43 Layered LiMnO2 has lower symmetry due to a Jahn-Teller distortion and crystallizes in the monoclinic C2/m space group. Monoclinic LiMnO2 is predicted to show three Raman active modes, but experimentally more peaks are observed.36,44 The spectra of NMC in Figure 2a show primarily the two dominant A1g and Eg modes with some additional weak bands similar to monoclinic LiMnO2.
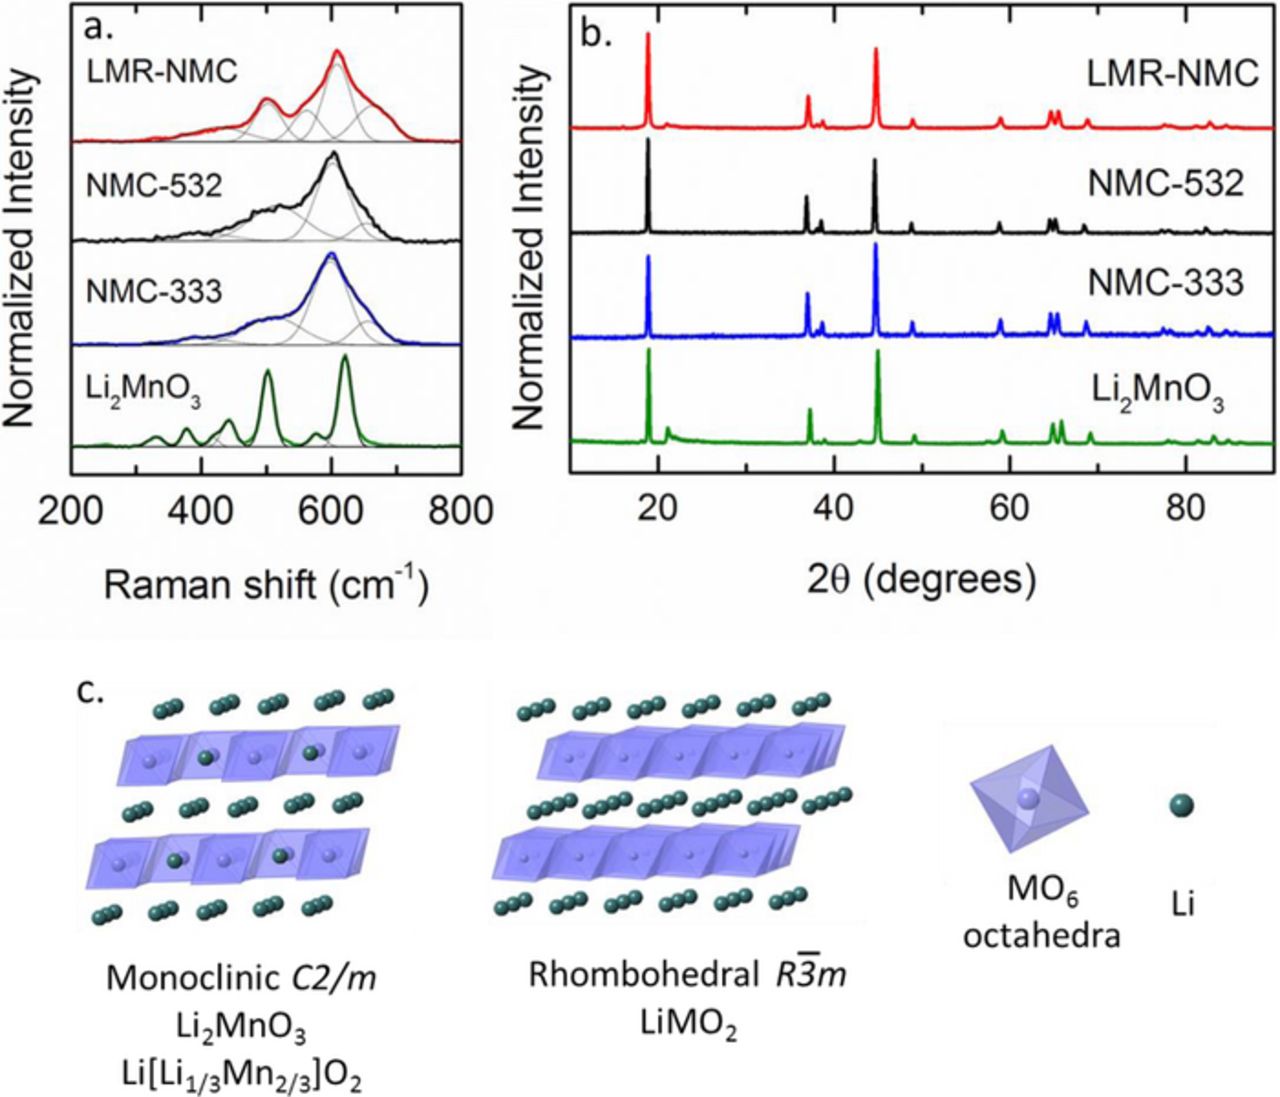
Figure 2. (a) Raman spectra and (b) X-ray diffraction patterns of different manganese oxide and mixed metal oxide phases. NMC-333 is LiNi1/3Mn1/3Co1/3O2 and NMC-532 is LiNi0.5Mn0.3Co0.2O2. (c) Crystal structure of Li2MnO3 and LiMO2.
The Raman spectrum of LMR-NMC can be resolved into four bands at 664, 609, 562, and 503 cm−1 with additional poorly resolved peaks centered near 427 cm−1. The two dominant modes at 609 and 503 cm−1 are attributed primarily to the A1g and Eg modes derived from the  space group.31,45 Bands at 562 and below 450 cm−1 should derive from the Ag and Bg modes of Li2MnO3. The shoulder at 664 cm−1 is consistent with previously reported spectra for LMR-NMC.24,27,29,31 The high frequency mode would not be predicted for an ideal layered phase with
  or C2/m symmetry, but is expected for related oxides such as cubic spinel Li1.33Mn1.67O4 and the low temperature modified spinel LiNi0.5Co0.5O2.36,42,43 Thus, the high frequency mode has been interpreted as evidence that the structure of LMR-NMC is intermediate between layered and spinel phases.29 Electron diffraction measurements of the pristine LMR-NMC by Mohanty et al. indicated the presence of some transition metal ions in the lithium layer and/or stacking faults, but not a cubic spinel phase.22 The peak assignments of LMR-NMC are summarized in Table I.
Table I. Summary of peak positions and assignments for LMR-NMC.
| Peak Position (cm−1) | Assignment | Phase |
|---|---|---|
| 664 | shorter Mn-O | Spinel-like |
| 609 | A1g, out of plane M-O stretch | LiMO2 |
| 562 | Bg, Ag | Li2MnO3 |
| 503 | Eg, in plane O-M-O bend | LiMO2 |
| 427 | Bg, Ag | Li2MnO3 |
The X-ray diffraction patterns of LMR-NMC and the parent layered phases are shown in Figure 2b. The similar structures yield similar diffraction patterns. Li2MnO3 and LMR-NMC distinguish themselves from NMC primarily by weak peaks near 21° which arise from the cation ordering of lithium and transition metal ions in the transition metal layer.46
The Raman spectrum of LMR-NMC changes considerably when the electrode is charged and lithium is removed from the lattice. Figure 3 shows spectra from electrodes which were charged to different cutoff voltages during the first cycle charging. The electrodes were held at the cutoff voltages for 24 h prior to cell disassembly. The spectra are averaged over several particles, but the spectra were found to be very reproducible across different regions of the electrode. The spectra of LMR-NMC at different states of charge show many broad overlapping bands which cannot be resolved uniquely. Nonetheless, the spectra show similar trends upon delithiation as the parent LiMO2 and Li2MnO3 phases. Up to 4.5 V, the Raman modes of LMR-NMC tend to shift toward lower energy (Figure 3b). This corresponds to oxidation of the transition metals and an increase in the c-lattice parameter.21 The Raman spectrum of LiCoO2 shows the same behavior with charging.39,47 Beyond 4.5 V, the Li2MnO3 component becomes activated and the LMR-NMC bands shift back to higher energy. This corresponds to extraction of lithium from the transition metal layers and a decrease in the c-lattice parameter.21,48–50 Similar high energy shifts are observed when Li2MnO3 is charged from 4.4 to 4.7 V.51 The LMR-NMC bands also tend to become broader with charging (Figure 3c), likely due to increasing disorder, as has been observed previously for LiCoO2 and Li2MnO3.39,47,51
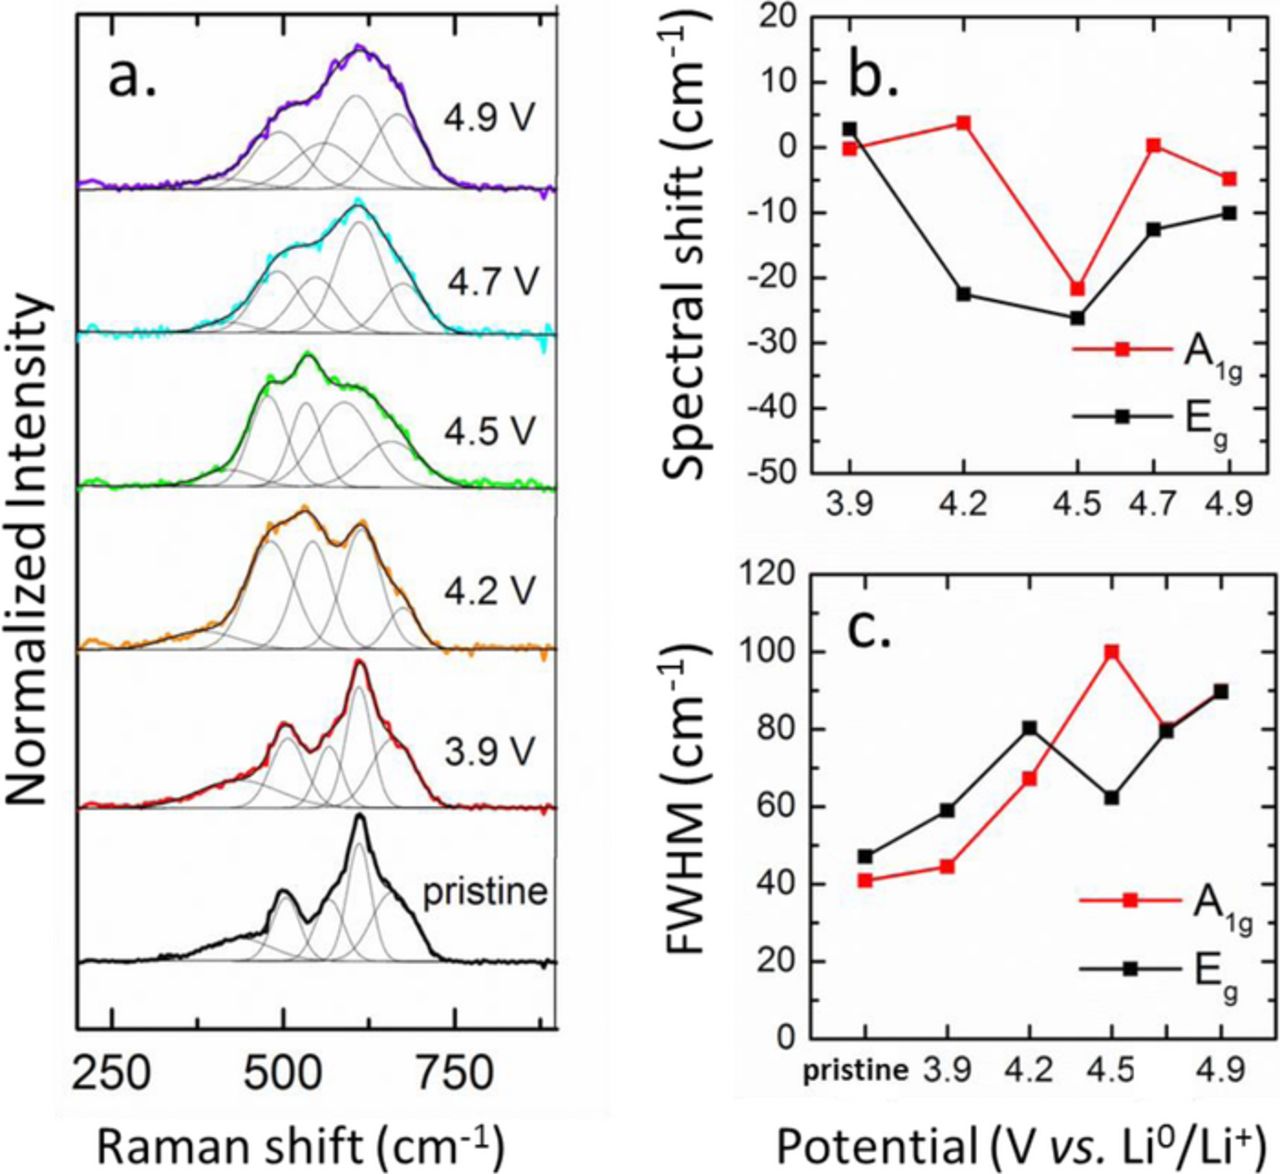
Figure 3. (a) Average Raman spectra of LMR-NMC cathodes charged to different cutoff voltages during the first cycle. (b) Shift of the A1g and Eg modes with respect to the pristine material as a function of voltage. (c) FWHM of the A1g and Eg modes as a function of voltage.
The Raman spectra of LMR-NMC also evolve with electrochemical cycling. Figure 4 shows Raman spectra taken from discharged electrodes cycled at 25°C and 60°C. Spectra were collected for up to 100 cycles for electrodes cycled at 25°C. Unfortunately, after 100 cycles at 60°C a large fluorescence background obscures the metal oxide vibrational modes and only data up to 50 cycles is shown. The spectra are averaged over several particles and regions of the electrode. The cycled samples exhibit broader peaks than the pristine electrode as would be expected from the activation of the Li2MnO3 phase. Surprisingly, the Raman spectra do not change significantly with additional cycles at a given temperature. However, the spectra for samples cycled at 25°C are significantly different from the spectra for samples cycled at 60°C. The high energy shoulder around 650 cm−1 is significantly weaker in samples cycled at 60°C. Also, the dominant mode around 600 cm−1 shows a slight redshift.
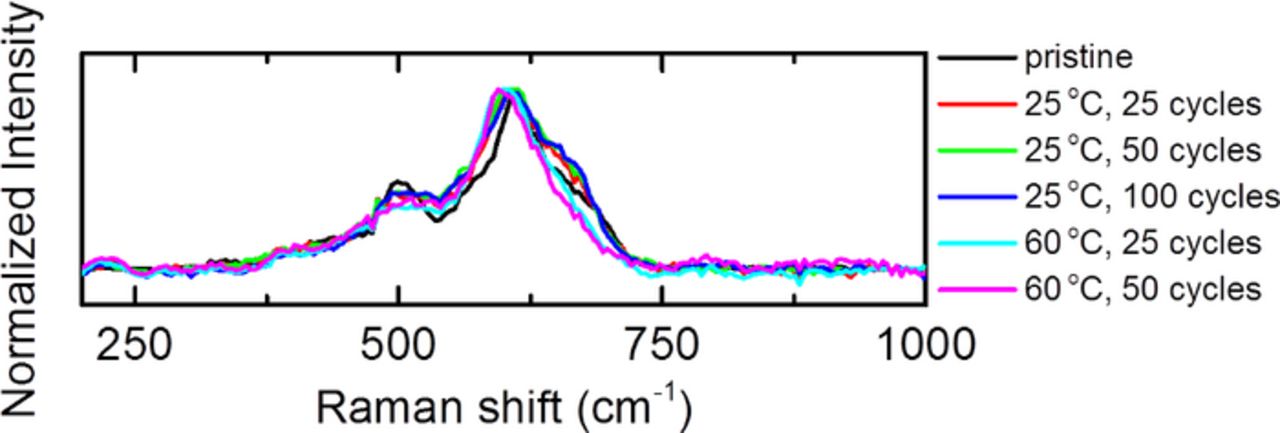
Figure 4. Average Raman spectra of LMR-NMC cycled at 25°C and 60°C between 2.0 and 4.7 V at a rate of 50 mA/g.
Figure 5 shows the charge and discharge capacity of electrodes used for the Raman study cycled at 25 and 60°C up to 100 cycles. Increased capacity at elevated temperature has been observed before and is likely due to a number of factors including better activation of the Li2MnO3 component, lower interfacial resistance, and enhanced diffusion.10,25,51 Figure 6 presents the cycling data as dQ/dV plots and charge-discharge voltage profiles at 25 and 60°C. The data has not been corrected for iR drop. The changes in the electrochemical profile are typical of LMR-NMC and support a change in crystal structure, especially after extended cycling at elevated temperature.52
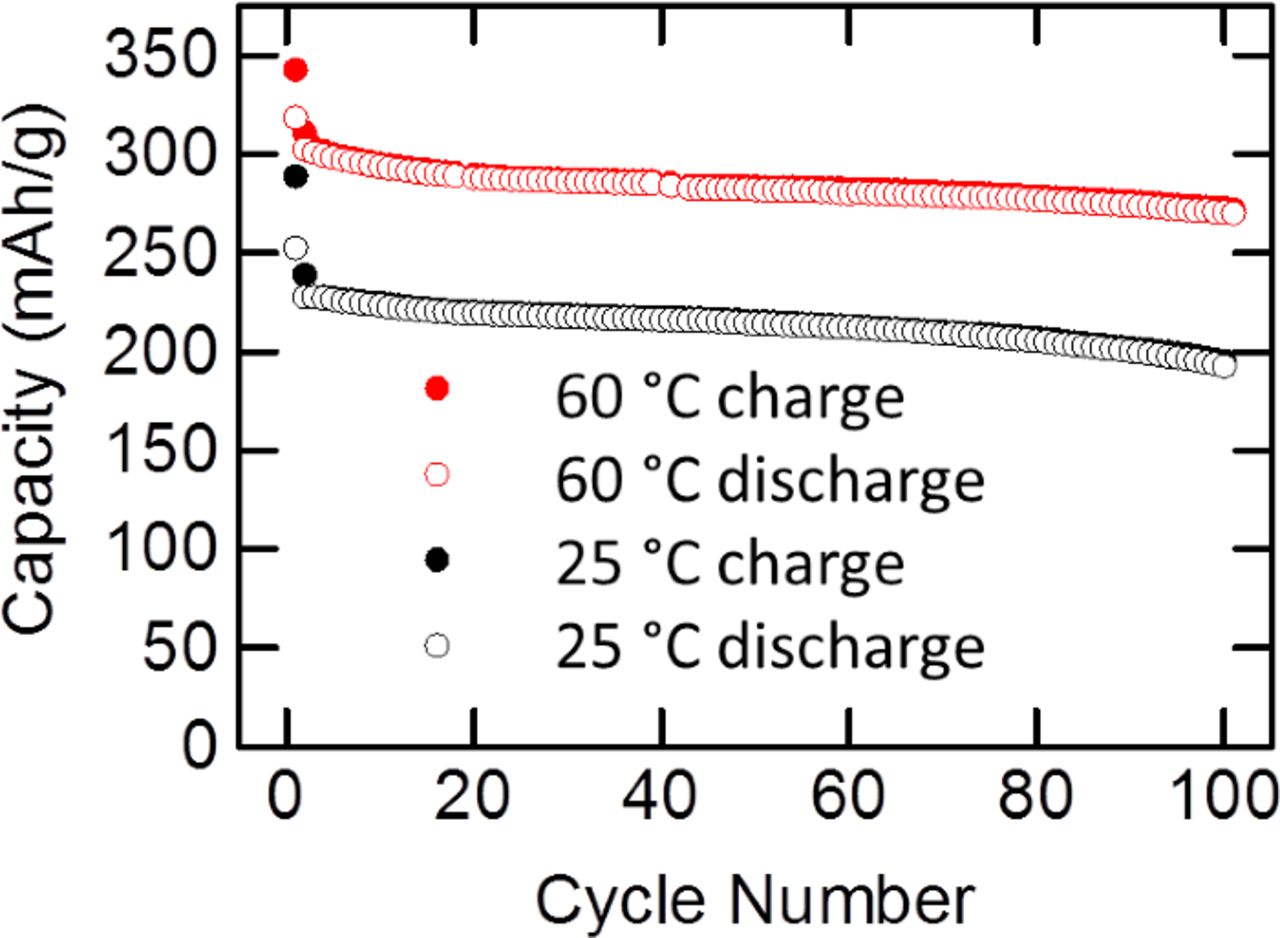
Figure 5. Charge and discharge capacities of LMR-NMC half cells for the first 100 cycles.
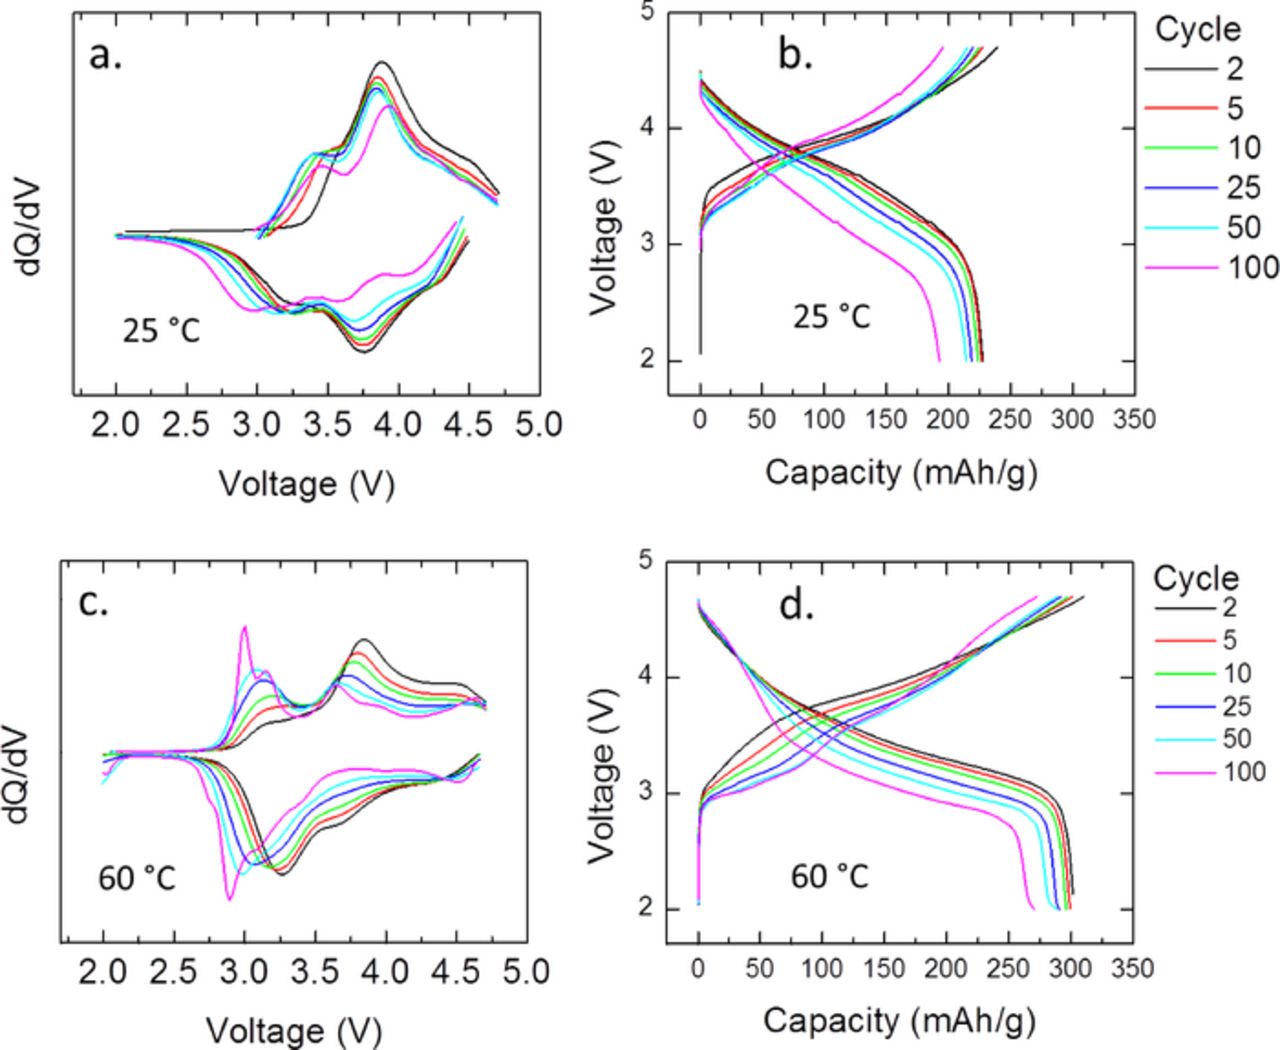
Figure 6. (a) Plots of dQ/dV and (b) charge-discharge voltage profiles for LMR-NMC half cells cycled at 25°C. (c) Plots of dQ/dV and (d) charge-discharge voltage profiles for LMR-NMC half cells cycled at 60°C. The legend is the same for all graphs.
The specific structural transformations that occur in LMR-NMC with high voltage electrochemical cycling are widely debated. Some groups observe the formation of spinel or distorted spinel phases using X-ray and electron diffraction.4,17,21–23 Other groups do not find evidence for a spinel phase with long-range order, though local migration of transition metal ions into tetrahedral sites in the lithium layers may occur.8–10,16,25,52 The transformation from layered to spinel is expected to be accelerated by cycling at elevated temperature.53–55 Interestingly enough the high frequency mode around 630 to 650 cm−1 that is the signature of spinel phases is already present in the pristine LMR-NMC material (Fig. 2a). The intensity of this mode increases somewhat after cycling at 25°C but actually decreases after cycling at 60°C. This could suggest that LMR-NMC actually adopts a more ideal layered structure with fewer defects upon cycling at elevated temperature. It is also possible that any spinel phase or other phases that form are weak Raman scatterers that are outside of our detection limits. This would be especially likely if the new phases are poorly crystalline. This interpretation is likely, since the dQ/dV plots present clear evidence for changes in the crystal chemistry. In addition to the fluorescence, the very poor signal-to-noise in the Raman spectra of electrodes cycled 100 times at 60°C could be explained by the formation of a new phase or phases which scatter very weakly. It is worth emphasizing that reliable identification of a spinel phase by Raman spectroscopy requires very low laser power, since high laser power is known to convert other phases to spinel.36–38 Moreover, the extent of the crystal structure changes in LMR-NMC also depend on the cycling voltage window and relative ratio of Li2MnO3 and LiMO2 phases.52
Cycling at elevated temperature does appear to have a deleterious effect on the carbon black conductive additive even within our limited cycling conditions (100 cycles, 50 mA/g, and 60°C). Figure 7 shows the D and G bands in the Raman spectra of cycled cathodes. Raman spectra from cathodes cycled at 60°C show a decrease in the D/G band intensity ratio, as well as some peak broadening, consistent with an increase in the number of structural defects.56 The increasing disorder has been attributed to the intercalation of PF−6 at high voltage and elevated temperature, and may have a negative impact on the electronic conductivity of LMR-NMC cathodes after prolonged cycling.57
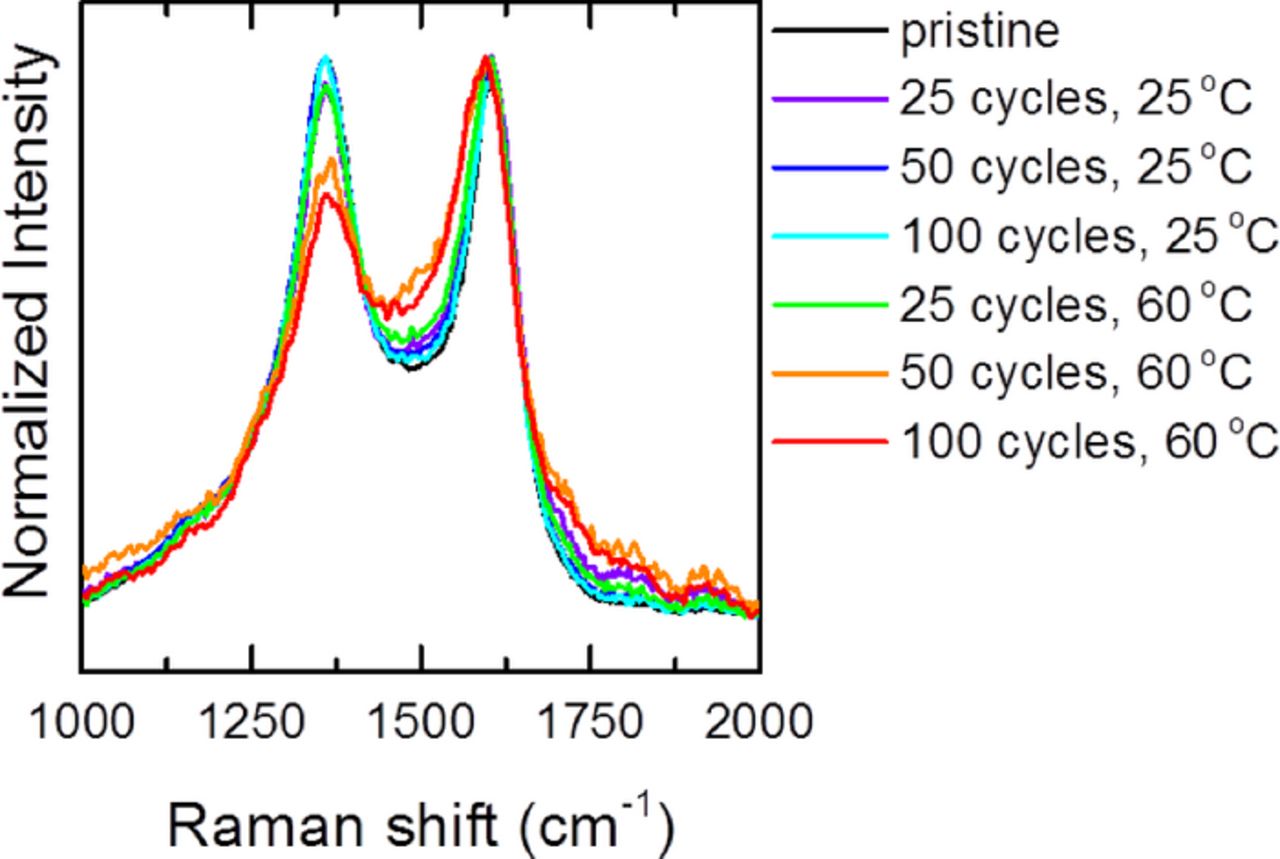
Figure 7. Averaged Raman spectra showing the carbon D and G bands (conductive additives) for LMR-NMC electrodes cycled at 25°C and 60°C.
It is important to note that the Raman spectra are found to be highly uniform across large areas of the electrode for each measurement condition. For example, Figure 8 shows an optical image of an LMR-NMC electrode that was cycled 50 times at 25°C, along with the corresponding Raman spectra acquired at the indicated locations. Each spectrum samples a volume of about 1μm3 and is identical within the noise level of the measurement. Spectra were also collected at different locations spanning each electrode (mm length scale) and found to be similarly reproducible. Therefore, while LMR-NMC exhibits significant heterogeneity at the nanoscale,4,24,25,58,59 the electrodes are remarkably uniform at the micron to millimeter scale. This could indicate possible equilibration at a macroscopic level under the ex situ conditions.

Figure 8. Optical image (left) of LMR-NMC cathode cycled 50 times. Markers indicate locations where the corresponding Raman spectra (right) were acquired.
Conclusions
Raman spectroscopy of lithium-rich NMC cathode provides unique structural information which bridges the length scales probed by X-ray and neutron diffraction (bulk) and electron diffraction (nanoscale). LMR-NMC is susceptible to thermal decomposition, and low laser power is essential to collect representative and reproducible Raman spectra. For the pristine material, the Raman spectra support a structure with lower symmetry than would be predicted for the  space group, likely with transition metal ions occupying sites in the lithium layer. Upon charging, the spectra evolve in a manner similar to the parent LiMO2 and Li2MnO3 phases with shifts in the vibrational modes that correspond to the changes in the c-lattice parameter. The structure appears to be very stable to electrochemical cycling and changes little after the initial activation cycles. Using Raman spectroscopy we could not verify the formation of a spinel-like phase within our limited cycling conditions (50 times at 60°C), although the electrochemical signature (dQ/dV) clearly shows a change in the crystal structure with cycling. If a spinel-like phase forms it is either a minor phase or a weak Raman scatterer. High resolution Raman mapping shows that the structure of LMR-NMC is highly uniform across the electrode (μm to mm length scale), even after electrochemical cycling.
Acknowledgments
This work was supported by the Assistant Secretary for Energy Efficiency and Renewable Energy, Office of Vehicle Technologies of the U.S. Department of Energy under the Batteries for Advanced Transportation Technologies (BATT) Program. Oak Ridge National Laboratory is managed by UT-Battelle, LLC, for the U.S. Department of Energy under contract no. DE-AC05 00OR22725.