Abstract
A transient, isothermal, two-dimensional model coupling cell performance and chemical membrane degradation in a polymer electrolyte membrane fuel cell (PEMFC) is developed. The model is based on the conservation of and thermodynamic equilibrium between charged and neutral species, including radicals. The model is validated against experimental polarization behavior and chemical degradation under an open circuit voltage (OCV) hold test at 368.15 K. The four-step chemical degradation of a PFSA-based membrane is assumed to start by an attack by hydroxyl radical at the terminal ether bond in the side chain. The source of the attacking hydroxyl radical is an indirect hydrogen peroxide formation and the subsequent decomposition at Fenton's reagent in the membrane. Simulation of degradation rate (defined as the loss of cell voltage with time at a fixed cell operating condition and at a point of time with a known degradation history) under an OCV-hold test agree qualitatively with the degradation rates reported in the literature.
Export citation and abstract BibTeX RIS

This is an open access article distributed under the terms of the Creative Commons Attribution Non-Commercial No Derivatives 4.0 License (CC BY-NC-ND, http://creativecommons.org/licenses/by-nc-nd/4.0/), which permits non-commercial reuse, distribution, and reproduction in any medium, provided the original work is not changed in any way and is properly cited. For permission for commercial reuse, please email: oa@electrochem.org.
Having achieved acceptable performance levels, polymer electrolyte membrane fuel cells (PEMFCs) are at a juncture where cost and durability are key priorities to achieve full scale commercialization of the technology. Degradation in PEMFCs is typically dominated by the degradation of the membrane1–3 due to various mechanisms depending on operating conditions. Degradation in the catalyst layer (CL) can also be dominant as reported for example in a recent study by Schulenburg et al.4 where a loss in performance after 1,000 start/stop cycles was attributed to reduced porosity of the CL and concomitant loss in transport properties. The membrane in this study remained virtually unaffected; Pt-coarsening was similar to a case where the PEMFC was subjected to 24,000 voltage-cycles with no notable degradation in performance. The effect of in-plane material anisotropy in gas diffusion layer (GDL) was shown to lead to mechanical instability in the membrane.5 Furthermore, catalyst layers and membrane have different mechanical properties and interactions between the two layers are known to have significant impact on the fatigue properties of the composite catalyst coated membrane (CCM) materials with an adverse effect on durability.6 A literature survey on long-term durability by de Bruijn et al.7 noted that two of the most frequently observed manifestations of degradation are i) loss of water removal efficiency and ii) loss of platinum surface area at the cathode.
Despite the observation of degradation processes away from the membrane, the life-limiting failure of a PEMFC system is mainly due to membrane failures in the form of membrane-thinning, cracks, tears, punctures or pinholes.1,8–10 Although membrane degradation in an operating fuel cell is generally caused by a combination of chemical, mechanical and thermal stressors, it is the chemical degradation of the membrane which is at play under open circuit voltage (OCV) when crossover of gaseous reactants is the highest. Fundamentally, an atomistic level understanding of chemical reactions and processes is required to describe the mechanism of the chemical degradation; however, for practical purposes a macroscopic description is more expedient and can be adequate to represent the mechanical and thermal degradation mechanisms.11 Ideally, multiscale models, i.e. macroscopic models informed by microscopic details, can provide a more general and complete representation than simple macroscopic models because they can transfer understanding of atomistic chemical degradation and microscopic physical details to the macroscale.12 Multiscale simulations still present challenges and remain computationally expensive.13
Progress in understanding ionomer chemical degradation in PEMFCs has been gained from experimental ex-/in-situ testing, monitoring and post-mortem analysis of degraded membranes. In-situ testing aimed at simulating chemical-only degradation of the membrane is carried out at OCV where the reactant gases permeation from one electrode to another is higher than when a net cell current is drawn. A reaction between the crossing over gases leads to the formation of radicals, or a precursor of radicals, such as hydrogen peroxide. Although a typical operating temperature of a PEMFC is 353 K, the presence of ·H, ·OH and ·OOH radicals at the electrodes have been detected at temperatures as low as 300 K in an operating fuel cell monitored under an electron spin resonator (ESR).14 In addition, carbon centered radicals, a product of Nafion degradation, has also been detected after closed circuit operation—with the cathode giving stronger signal than anode. Higher temperatures will exacerbate the concentration and activity of these radicals.
Chemical degradation of the membrane is normally measured by the fluoride emission rate (FER) at each electrode. In-situ OCV testing and modeling has been carried out by several researchers. The relative amount of FER at the electrodes is influenced by factors such as gas stream composition, gas permeation coefficients in the membrane and the location of Pt band formation in the membrane.15 OCV hold tests by Ohma et al.15 found that the Pt band formed where the electrode potential inside the membrane in the thickness direction changed abruptly; close to 0 V between anode and the Pt band and close to cathode potential in the rest of the membrane region. The FER from the electrode nearer to the Pt band was found higher leading to the conclusion that membrane degradation is enhanced at the Pt band. In cases where Pt band could not be observed, the total FER over the duration of the test was over 6 times lower with cathode exhibiting about 10% higher FER over anode. Conversely, Macauley et al.16 recently provided experimental evidence for the beneficial effects platinum has on reducing overall membrane degradation rates and enhancing the lifetime of a stack under accelerated stress tests.
To date, a few 1D models of membrane degradation that do not resolve the impact of the current collector/channel geometry have been reported in the open literature, and most model the membrane degradation process as a one step process.17–20 A limited number of multiscale models have been reported, e.g.,21 which combined 3D-resolved Coarse-Grained Molecular Dynamics simulating PEM ageing, with 2D kinetic Monte Carlo models resolving the H2O2 formation in the PEMFC electrodes and 1D modeling of the species transport along the MEA. Considering the very large molecular size as well as the long side chain in Nafion, its chemical degradation cannot possibly be completed in a single step. In fact, recent ex-situ degradation of Nafion under controlled conditions22–24 have clearly shown that degradation is a long multi-step process.
The scope of this paper is limited to membrane chemical degradation and its effect on PEMFC performance. A transient chemical degradation model is developed and implemented in a finite element based modeling software, COMSOL Multiphysics 4.3a. The 2D model uses a dynamic mesh to allow accurate representation of membrane thinning due to material loss and of hygrothermal swelling. The 2-D formulation accounts for spatial variations of key variables such as species concentration and current densities, and provides a basis for coupling with ongoing mechanical degradation modeling work where the membrane is subjected to different stresses between the land and channel areas. The details of the chemical degradation pathway is based on a recent experimental study on degradation of a "chemically stabilized" perfluorinated sulfonic acid (PFSA) based polymer membrane in ex-situ Fenton's test.24 The role of platinum in the membrane is disregarded; however, an initial uniform iron (II) concentration in the membrane acting as a Fenton's reagent, is assumed. The effect of degradation on steady state performance characteristics of a PEMFC and, vice versa, the influence of an OCV-hold on transient chemical degradation is discussed. The model couples a steady state performance module to a transient chemical degradation module; the coupling is achieved by sharing time/degradation-dependent variables between the modules. Finally, the approach is validated against the experimental OCV hold-test data for chemical degradation as well as polarization behavior of a PEMFC.25 The present model builds on the 1D models of Shah et al.,26,27 by extending the approach to 2D and representing membrane chemical degradation with a multi-step kinetic model.
Performance and Crossover-Led Chemical Degradation Models
The modeling work presented here is comprised of two, macroscopic 2D, isothermal sub-models; 1) a steady-state PEMFC performance and 2) a transient chemical degradation model of the membrane. The former is developed to study the effect of the latter on the fuel cell operating characteristics whereas; the latter along with the former is used to model the chemical degradation as a function of an arbitrary cell operating protocol. PFSA-based polymer membrane such as Nafion is used for the purpose of model development. The molecular structure of Nafion consists of a backbone of polytetrafluroethylene (PTFE) and a pendant ether ketone group with sulfonic acid (―SO3H) end group, attached to the backbone (Fig. 1). Thus, Nafion is a copolymer with comonomers constituted by the perfluorinated vinyl ether and tetrafluoroethylene. Equivalent weight (EW) of Nafion is defined as the dry polymer weight per mole of sulfonic acid. It exhibits a range of 0.80 to 1.50 kg/mol. The proton conductivity of Nafion arises from the deprotonation of the acid group in the presence of water in vapor or liquid form.28
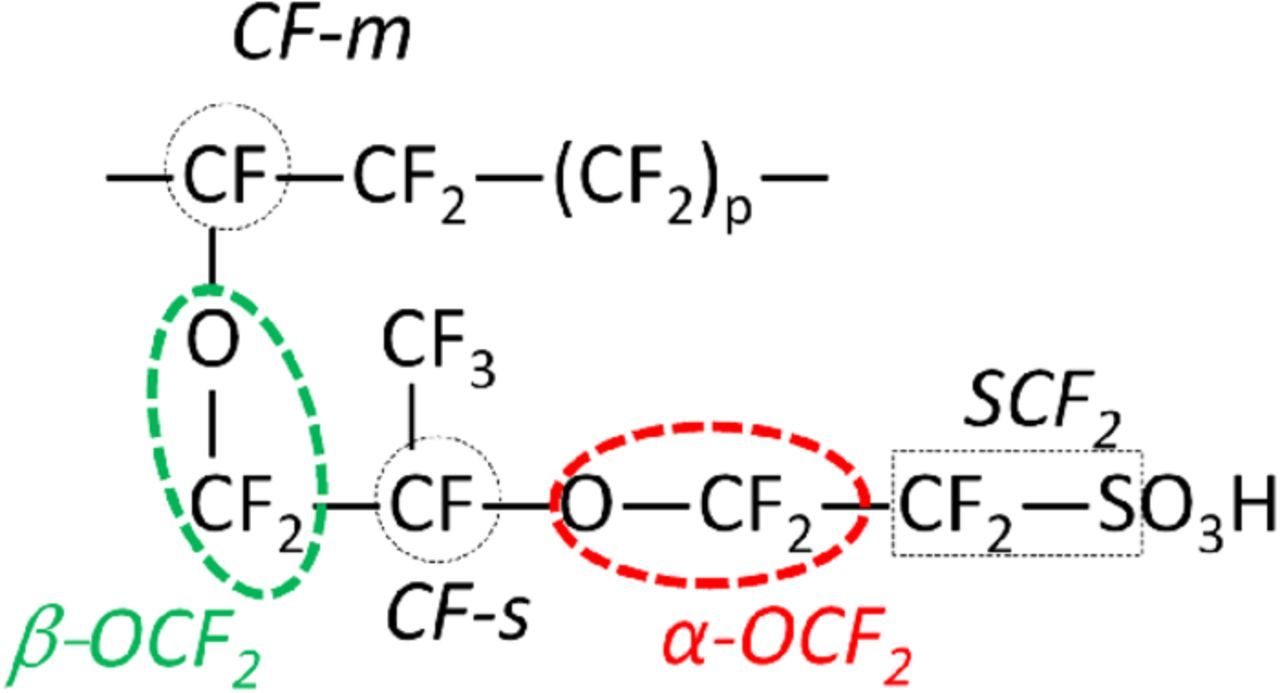
Figure 1. Chemical structure of the PFSA-based membrane Nafion. Structural groups in Nafion enclosed by dotted shapes are identified with a keyword. The model tracks the composition of these groups as a function of degradation. The EW of the polymer can be expressed as EW = 50p+444. For p = 13, EW = 1094; approximate wt% of the constituent elements are: F (68), C (22), O (7), S(3) and H (0.1).
The chemical degradation of the membrane is enabled by 1) the crossover of H2 and O2, 2) the reaction between the crossover species generating radical(s) and 3) attack of the radicals on polymer. The details of the performance and chemical degradation models are presented next.
2D performance model
The steady state, MEA-level performance is based on the conservation of mass, charge and momentum wherever applicable.29 Figure 2 shows the geometry of the modeled domain which includes gas diffusion layer (GDL), micro-porous layer (MPL), and CL on each side of the polymer membrane. The left half of the domain is under the land region and experiences a compressive stress of 1.5 MPa. The cell is assumed to operate under high stoichiometry so that the gas concentration along the channel remains approximately the same as at the inlet. In the porous regions encompassing the electrodes, MPLs and the GDLs, the Maxwell-Stefan gas diffusion equations—binary diffusion (H2-H2O) in the anode-side and ternary (O2-N2-H2O) in the cathode-side—were solved. The governing equations in various cell components are listed in Table I. The binary diffusivities were calculated using the expression in Table II and corrected in the porous regions using the Bruggeman relation.
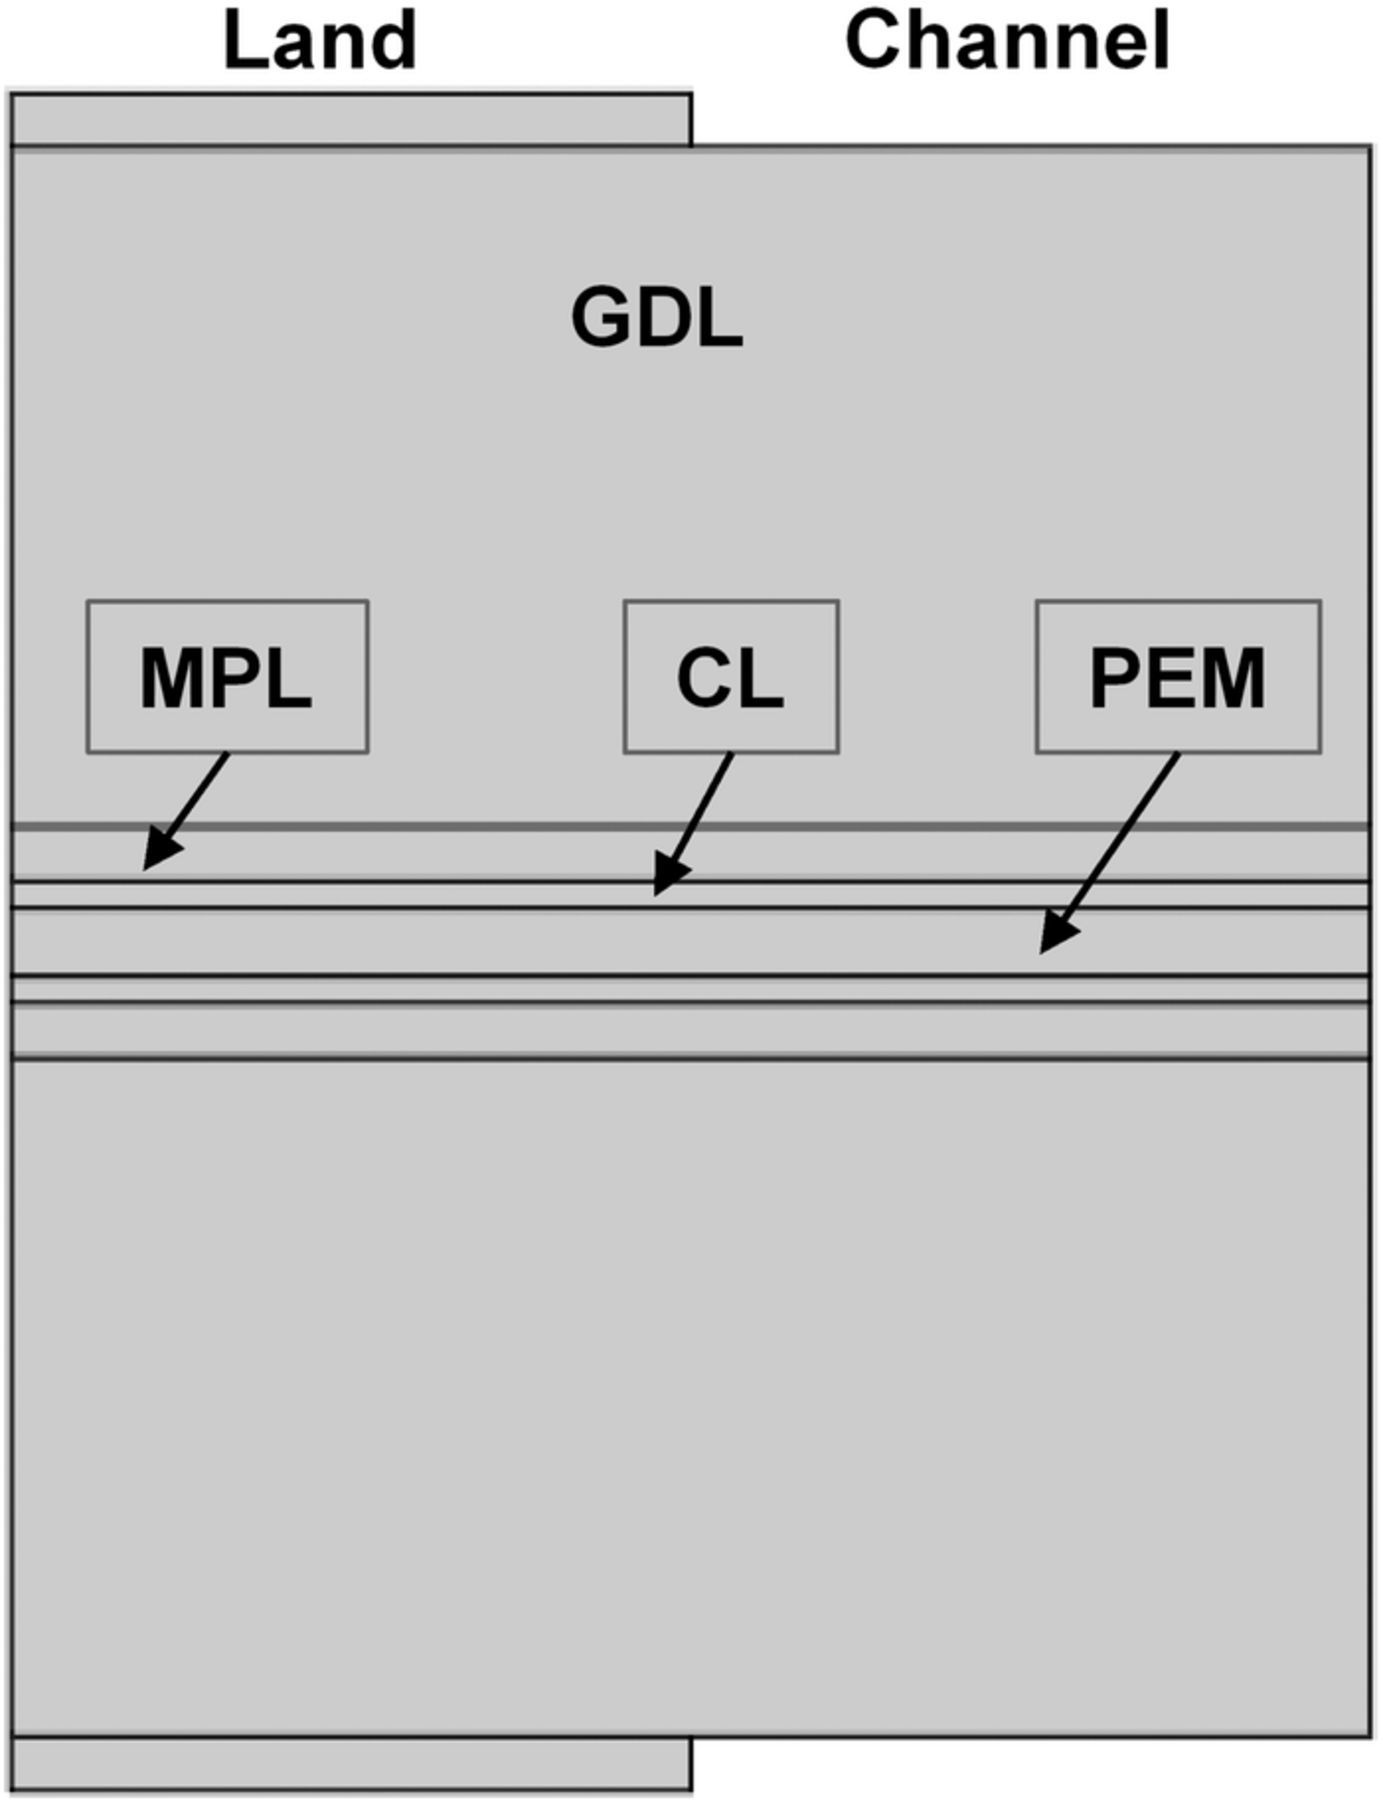
Figure 2. Geometry of the modeled domain. Layered sandwich structure constituted by the CL, MPL and the GDL is symmetric to either side of the membrane.
Table I. Transport equations modeled in various computational domains.
| Equation | Note | |
|---|---|---|
| MPL / GDL | ||
∇ · ( −  1.5sσs∇φs) = 0 1.5sσs∇φs) = 0 |
s, σs and φs are respectively the phase fraction, conductivity and the electric potential of the electron-conducting phase in the respective domain. |
|
 |
i = H2 and H2O (anode-side MPL / GDL) i = O2, H2O and N2 (cathode-side MPL / GDL) is the gas phase porosity in the respective domain |
|
| CL (anode) | ||
| ∇ · ( − 1.5−, sσs∇φs) = Sφ, 1 |
 η = φs − φe − Eref− η = φs − φe − Eref− |
|
| ∇ · ( − 1.5−, eσe∇φe) = −Sφ, 1 |
||
 |
i = H2 or H2O | |
 |
 η = φs − φe − Eref+, 2e η = φs − φe − Eref+, 2e |
|
| CL (cathode) | ||
| ∇ · ( − 1.5+, sσs∇φs) = Sφ, 3 |
 η = φs − φe − Eref+ η = φs − φe − Eref+ |
|
| ∇ · ( − 1.5+, eσe∇φe) = −Sφ, 3 |
||
 |
i = O2, and H2O | |
 |
 η = φs − φe − Eref+, 2e η = φs − φe − Eref+, 2e |
|
| Membrane | ||
| ∇.( − σe∇φe) = 0 | ||
 |
 η = φs, theoretical − φe − Eref+, 2e φs, theoretical = 0.14l V; l = relative distance from anode − membrane interface(0 at anode − membrane interface; 1 at anode − membrane interface) η = φs, theoretical − φe − Eref+, 2e φs, theoretical = 0.14l V; l = relative distance from anode − membrane interface(0 at anode − membrane interface; 1 at anode − membrane interface) |
|
 |
i = HF and H2O2 | |
 |
i = SO3, COOH, CF2, OH, calpha and cbeta |
Table II. Expression of binary gas diffusivity and parameters associated with its calculation.
| Variable/Parameter | Symbol | Expression/Value |
|---|---|---|
| Empirical expression of binary diffusivities50 | Di, j |  |
| Molar mass of: | ||
| Hydrogen |  |
0.002 (kg mol− 1) |
| Oxygen |  |
0.032 (kg mol− 1) |
| Nitrogen |  |
0.028 (kg mol− 1) |
| Water vapor |  |
0.018 (kg mol− 1) |
| Diffusion volume of (Fuller et al.50): | ||
| Hydrogen |  |
7.07 |
| Oxygen |  |
16.6 |
| Nitrogen |  |
17.9 |
| Water vapor |  |
12.7 |
The electrochemical reactions considered are (75°C):
Anode and Cathode:
![Equation ([1])](https://content.cld.iop.org/journals/1945-7111/165/6/F3328/revision1/d0001.gif)
![Equation ([2])](https://content.cld.iop.org/journals/1945-7111/165/6/F3328/revision1/d0002.gif)
Anode-only:
![Equation ([3])](https://content.cld.iop.org/journals/1945-7111/165/6/F3328/revision1/d0003.gif)
Cathode-only:
![Equation ([4])](https://content.cld.iop.org/journals/1945-7111/165/6/F3328/revision1/d0004.gif)
The kinetic expressions for Reactions 1–4 are given in Table I. The parasitic reactions, electrochemical reduction at anode and oxidation at the cathode, require consideration of the crossover of the reactant gases through the membrane, H2 from anode to cathode and O2 from cathode to anode which is discussed next.
H2 and O2 gas crossover through the membrane
The transport of H2 across the membrane occurs under the gradient of the hydrogen partial pressure ( ) and the gradient of total pressure across the membrane (P).30 Under pure partial pressure gradient (i.e., ∇P = 0), the permeability (
 ) seems to be different than the permeability under total pressure gradient (
 ), indicating either a separate mechanism of H2 gas crossover operating under each condition or, alternatively, dominance of one of the two mechanisms proposed by Mittelsteadt and Liu.31 The permeation rate constant of each mechanism is governed by a unique Arrhenius Equation. The two types of permeability based on experimental observation30,32 are further assumed to be independent of relative humidity above 75°C. Thus, the permeation rate of H2 across the membrane,
 (A.m−2) can be described as follows:
![Equation ([5])](https://content.cld.iop.org/journals/1945-7111/165/6/F3328/revision1/d0005.gif)
The H2 crossover fluxes induced by the two driving forces are assumed not to influence each other. The local concentration of the dissolved H2,  in the membrane is given by Henry's law and is equal to
  .
.
Likewise the permeation kinetics of oxygen is governed by:
![Equation ([6])](https://content.cld.iop.org/journals/1945-7111/165/6/F3328/revision1/d0006.gif)
where,  (m2V−1s−1) is the permeability coefficient given by the expression 1.54 × 10⁻⁵ × e−2755/T.33 The oxygen permeation under a gradient of total pressure across the membrane is assumed zero (
 ). An RH-dependent model for the oxygen permeation was used by Sethuraman et al.34 However, like the case for the hydrogen permeation, we assume that the effect of humidity on the oxygen permeability is minimum and we shall use the recent data by Zhang et al.33
Radical generation and chemical degradation of PFSA
The presence of H2O2 in the fuel cell membrane has been experimentally confirmed.35 H2O2 can be generated by the chemical reaction of the crossover species or by the electro-chemical 2e− reduction of cross-over oxygen at the anode. The anode potential, as discussed in the preceding section, favors the electrochemical route of H2O2 production which especially dominates under open circuit voltage conditions due to the high crossover rate. The H2O2 produced at the anode has a boiling point (150.2°C) higher than water and joins the dissolved water in the polymer and diffuses through the membrane. The diffusing H2O2 decomposes at Fenton reagents such as iron,36 which are apparently present in the membrane in the range of [mol/m3], and generate hydroxyl radicals as:
![Equation ([7])](https://content.cld.iop.org/journals/1945-7111/165/6/F3328/revision1/d0007.gif)
Iron in the oxidation state three does not catalyze peroxide decomposition. Under a reducing environment Fe2+ is regenerated from Fe3+ as follows:
![Equation ([8])](https://content.cld.iop.org/journals/1945-7111/165/6/F3328/revision1/d0008.gif)
A dynamic equilibrium between Fe2+ and Fe3+ exists. The highly oxidative hydroxyl (·OH) radical is generally believed to attack the oxygen containing weak links such as the oxygen linking the side group to the main chain or the ―COOH end group on the main chain. Chemically stabilized grade of the PFSA-based membranes such as Nafion 211 possesses negligibly small quantity of oxygen containing main chain terminal group/s. Thus the chemical degradation of such membranes is initiated at the weakest ether link on the side chain, as evidenced in a recent ex-situ Fenton's test24 and is assumed as such in this paper. The study by Ghassemzadeh & Holdcroft24 on Nafion 211 further indicates that the α-OCF2 is the first chemical group under attack by the hydroxyl radical. This is likely followed by the attack on the β-OCF2 which was reported to occur after a time lag of over 24 h, while the concentrations of either of the main chain groups, CF-m and CF2, remained unchanged even after 48 h of test signifying little or no degradation of the main chain.
Based on the above, the pathway for the chemical degradation of the membrane in an operating fuel cell is defined by the four sequential irreversible chemical reactions,37 shown in Fig. 3. The rate constants and reaction rates for reactions (i) to (iv) in Fig. 3 and for the reaction in Eq. 7 are listed in Table III. The longer the ―(CF2)pCOOH molecule (i.e., higher value of p) in reaction (iv) in Fig. 3, the more susceptible it could be to attack by •OH radical.38 In this work the rate constant for all the sequential reactions in Fig. 3 will be assumed constant and independent of the chain length. The chemical species SCF2, α-OCF2, β-OCF2, CF2, and COOH are always part of the polymer chain which is modeled as rigid. The species COOH refer to the ―COOH group attached to the main chain, cf. Eq. (iii) and (iv) in Fig. 3, and does not represent the (―(CF2)x―) group. Relative position of various functional groups with respect to the repeating unit of Nafion is depicted in Fig 1.
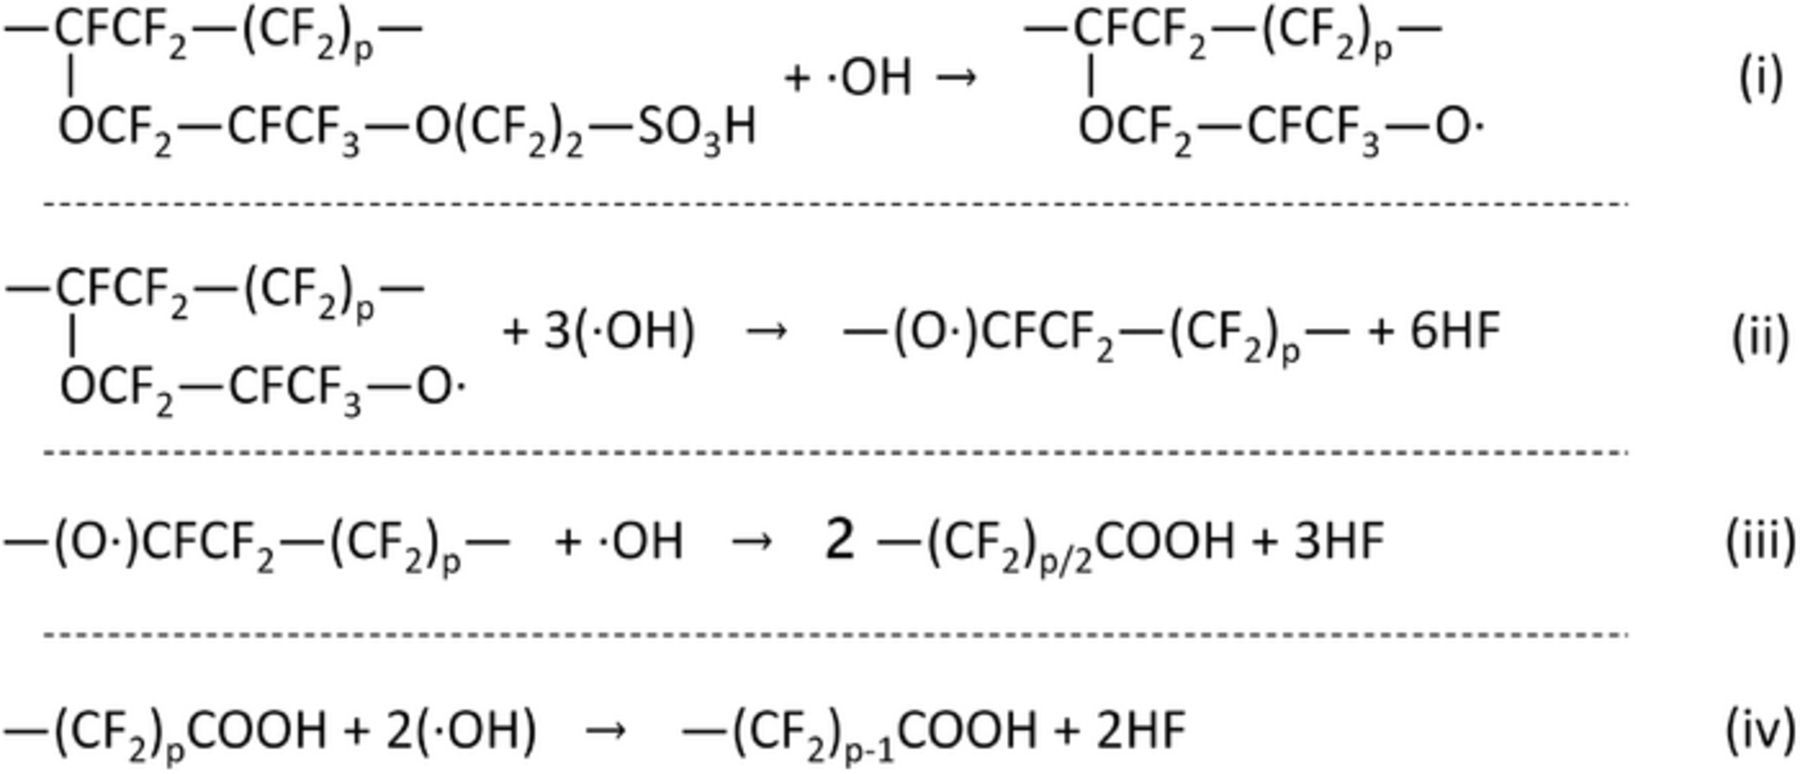
Figure 3. Pathway for the ·OH-mediated irreversible chemical degradation of PFSA membrane.
Table III. Reaction rates and reaction constants for reactions (i) to (iv) in Fig. 3 and Fenton reactions.
| Reaction | Rate constant (identifier) | Reaction rate (identifier) |
|---|---|---|
| (i) in Fig. 3 | 2.35 × 10³ m3/mol/s (k1)51 |  |
| (ii) in Fig. 3 | 9.04 × 10³ m3/mol/s (k2) |  |
| (iii) in Fig. 3 | 8.5 × 10⁴ m3/mol/s (k3) |  |
| (iv) in Fig. 3 | 1.0 × 10³ m3/mol/s (k4)52 1.02 × 10⁵ m3/mol/s38 | k4.cCOOH.cOH (r4) |
| Eq. 7 | 1.05 × 10⁵exp(−35397/R/T) m3/mol/s (k5) |  |
| Eq. 8 | 0.3 s−1 (k6) | k6. ; ;  is the concentration of iron (III) in the membrane is the concentration of iron (III) in the membrane |
The dry density, ρdry, and the EW of Nafion are related as:37
![Equation ([9])](https://content.cld.iop.org/journals/1945-7111/165/6/F3328/revision1/d0009.gif)
where ci and Mi are respectively the concentration and molecular weight of species i (i = SCF2, α-OCF2, β-OCF2, CF2, and COOH).
Incorporation of the preceding elements in the degradation model requires the following assumptions:
- (1)There is no oxygen containing end groups on the main chain at beginning of life (BOL). Hydrogen ion concentration or the pH of the membrane does not change with the degradation.
- (2)
- (3)The chemical species SCF2, α-OCF2, β-OCF2, CF2, and COOH are always part of the polymer chain. These species participate in degradation reactions but do not diffuse as they are chemically bonded to the main chain. Hydroxyl radical is another of the species for which diffusion is not considered due to its highly reactive and unstable nature. Its composition is determined by its production via Fenton reaction and its reaction in degradation reactions (Fig 3). All of the fluorine leaves the system as HF species. The remaining chemical species (containing C and S) are washed out and their effect is accounted for in characteristics such as EW, of degraded Nafion.
- (4)The loss of species COOH (reaction (iv) in Fig. 3) is not allowed when
 is greater than cCOOH.
 - (5)The water uptake and associated swelling characteristics of the membrane is unchanged by the degradation.
- (6)There is no degradation in PEMFC components other than the membrane.

The process of chemical degradation alters the material characteristics of Nafion slowly but continuously. A relation between these material characteristics and the polymer composition is needed to study the effect of chemical degradation of the membrane on cell performance.
The porosity of the membrane, ϕw, is calculated as volume fraction of the membrane occupied by the liquid water, given by:
![Equation ([10])](https://content.cld.iop.org/journals/1945-7111/165/6/F3328/revision1/d0010.gif)
where λ is the membrane water content defined as the number of water molecules per mole of charge site concentration and Vw and Vm are the molar volume of the water and the membrane respectively. The material loss originating from the degradation effects a dimensional change modeled as an equivalent volumetric strain, d:
![Equation ([11])](https://content.cld.iop.org/journals/1945-7111/165/6/F3328/revision1/d0011.gif)
where V0m and  are the molar volume and the charge site concentration of the membrane at BOL. In addition, the membrane experiences a volumetric strain, 0.0256λ, induced by the liquid water uptake.
The time-dependent mass conservation of non-diffusing species, i, (i = SCF2, α-OCF2, β-OCF2, CF2, OH and COOH) is governed by:
![Equation ([12])](https://content.cld.iop.org/journals/1945-7111/165/6/F3328/revision1/d0012.gif)
where Ri is the source term of species i, expressed in terms of reaction rates and stoichiometry of reactions in Table IV. The second term on the RHS of Eq. 12 takes into account the diluting/concentrating effects arising from membrane swelling and material loss.
Table IV. Source terms for the chemical species SCF2, α-OCF2, β-OCF2, CF2, OH and COOH in the membrane.
| Chemical species (i) | SCF2 | α-OCF2 | β-OCF2 | CF2 | OH | COOH | H2O2 |
|---|---|---|---|---|---|---|---|
Source term ( ) ) |
-r1 | r1 − r2 | r2 − r3 | 14r3 − r4 | − r1 − 3r2 − r3 − 2r4 + r5 |  * * |
− r5 |
*H(x) is Heaviside function taking a value of 0 for x < 0 and 1 for x > 0.
Coupling transient chemical degradation and the 2D performance models
The performance characteristics of a PEMFC under normal operating conditions are fairly stable and, within limits, independent of cell degradation processes at a short time scale of an hour. Thus, the performance of the cell is modeled assuming steady state operation of the cell. However, we note that transient effects arising from chemical degradation of the membrane can influence the performance characteristics by altering the degradation dependent parameters such as membrane porosity and conductivity which are inputs to the performance model. In Ref. 21, a feedback between the degradation mechanisms and the performance was taken into account, allowing the model to predict the cell voltage decay, including the OCV one. The present approach is consistent with concepts presented in Refs. 19,39.
The ageing processes linked to chemical degradation of the membrane are considered to be a function of time and field variables relevant to steady-state performance. The coupling of the performance and the chemical degradation models is relatively straightforward wherein the transient physico-chemical processes governing chemical degradation of the membrane are solved together with the steady state processes. The models and their coupling is validated against recently published experimental accelerated stress test data (chemical degradation and performance).25
Boundary and initial conditions
The boundary conditions are summarized in Table VI. The inlet hydrogen, oxygen, and water vapor concentrations are calculated according to the operating conditions presented in Lim et al.25 Hydrogen peroxide and hydrogen fluoride concentrations are assumed to be zero at the CL and MPL interfaces. For the remaining ionomer species that participate in the membrane degradation, no boundary conditions but initial conditions are required, given these species are fixed inside the membrane. The initial concentrations are:
![Equation ([13])](https://content.cld.iop.org/journals/1945-7111/165/6/F3328/revision1/d0013.gif)
Table VI. Summary of the boundary conditions applied in the simulations.
| Cathode | Cathode | Cathode | Cathode CL|Membrane | Anode | Anode | Anode | |
|---|---|---|---|---|---|---|---|
| Variables | GC|GDL | GDL|MPL | MPL|CL | & Membrane|Anode CL | MPL|CL | GDL|MPL | GC|GDL |
| cO2, g | continuous | continuous | continuous | No Flux | continuous | continuous | continuous |
| cH2, g | continuous | continuous | continuous | No Flux | continuous | continuous | continuous |
| cw, g | continuous | continuous | continuous | No Flux | continuous | continuous | continuous |
| λ | No flux | continuous | No flux | ||||
 |
No flux | continuous | No flux | ||||
| cHF | No flux | continuous | No flux | ||||
| Vs | No flux | continuous | continuous | continuous | continuous | 0 |
Mesh sensitivity simulations performed with both an extremely fine mesh (24,346 elements) and a fine mesh (6,438 elements) yielded virtually identical results. The results presented here were obtained with the extremely fine mesh. A Massively Parallel Sparse direct Solver (MUMPS) was employed to solve the set of fully coupled equations. Initial conditions for the domains were set as shown in Table Vt6, and initial concentrations were prescribed for all gas species. Typical computational time on a workstation with AMD FX 8-core processors ranged from 15 to 60 min depending on the operating conditions.
Table V. The cell operating parameters to simulate the degradation under OCV hold test.
| Parameter | Value |
|---|---|
| Cell current | 0 A (open circuit) |
| Relative humidity | 56% |
| Inlet O2 mass fraction | 40% |
| Inlet anode pressure | 2.28 atm |
| Inlet cathode pressure | 2.07 atm |
| Cell temperature | 368.15 K |
Results and Discussion
Validation
The beginning of life (BOL) average polarization behavior over a five-cell stack is compared with the simulated polarization curve in Fig. 4. The simulated open circuit voltage (OCV) of 0.98 V was lower than the theoretical OCV of 1.16 V at a cell temperature of 348.15K. The drop in the OCV was fully accounted for by the hydrogen crossover from anode to cathode which results in parasitic hydrogen oxidation and oxygen reduction reaction at the cathode. Overall, the BOL polarization behavior of the cell is captured quite well by the steady state performance model which contains only two adjustable parameter (exchange current density and transfer coefficient).
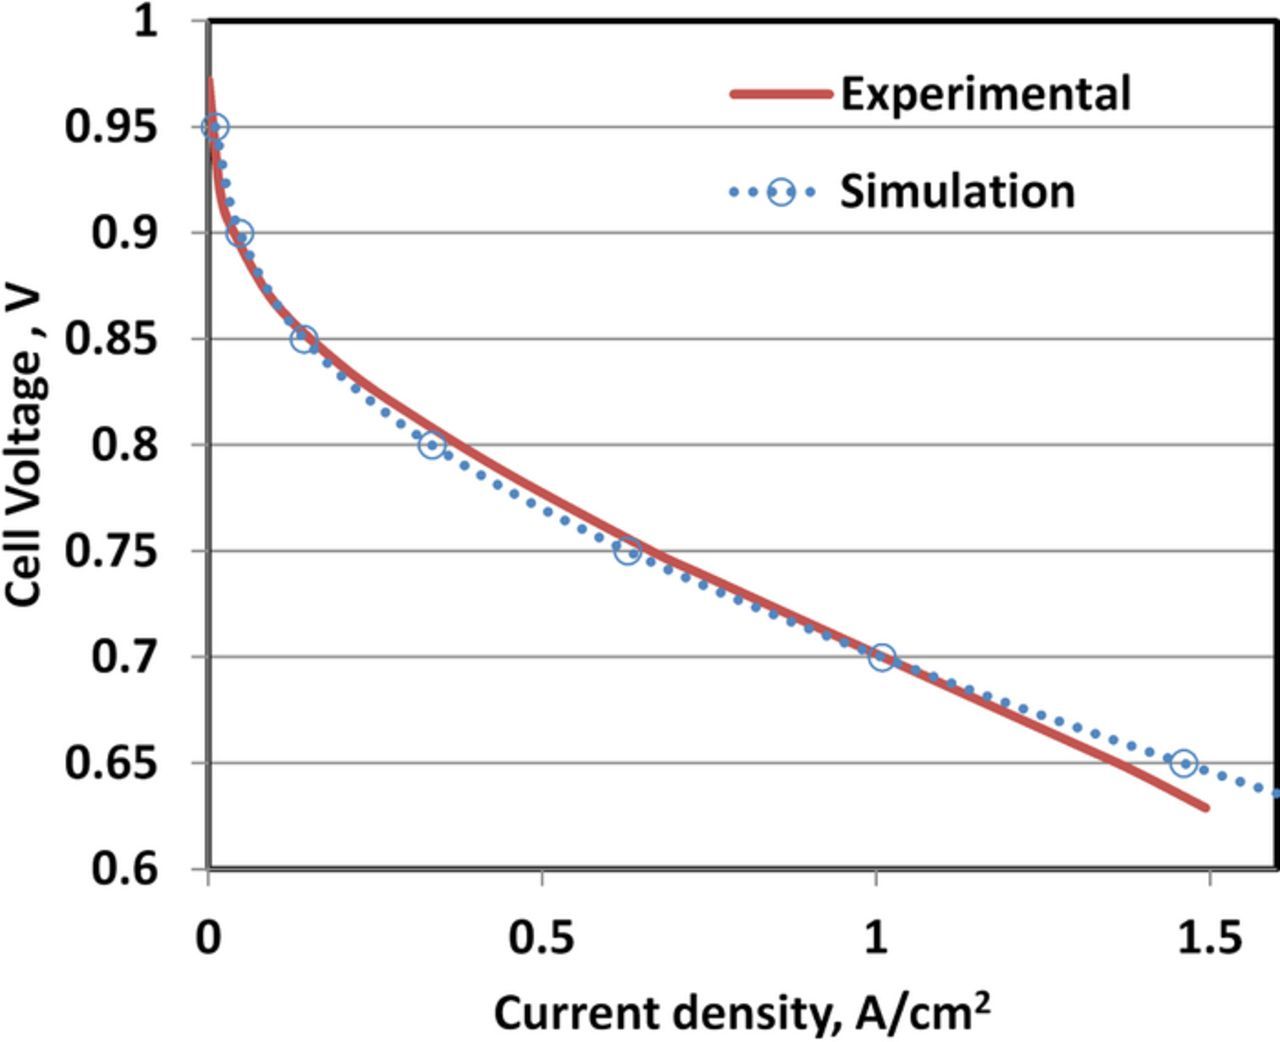
Figure 4. Validation of the steady-state performance model against the average polarization behavior measured over a five-cell stack. The cell temperature, total gas pressure and R.H. at both electrodes were 348.15 K, 2 atm and 100%.
Apart from the steady-state performance the transient degradation model was validated against the membrane degradation measured by the fluoride emission rate under an OCV hold test described in Lim et al.25 The cell operating parameters for the 10h OCV hold test as well as the simulation are listed in Table V. The simulated FER reproduces the experimental trend well, but as shown in Figure 5 the experimental FER lags behind the simulation; this is attributed to the extra diffusion path from the membrane-CL interface, where the simulated FER were calculated, to the fluoride detector located downstream along the exhaust stream.
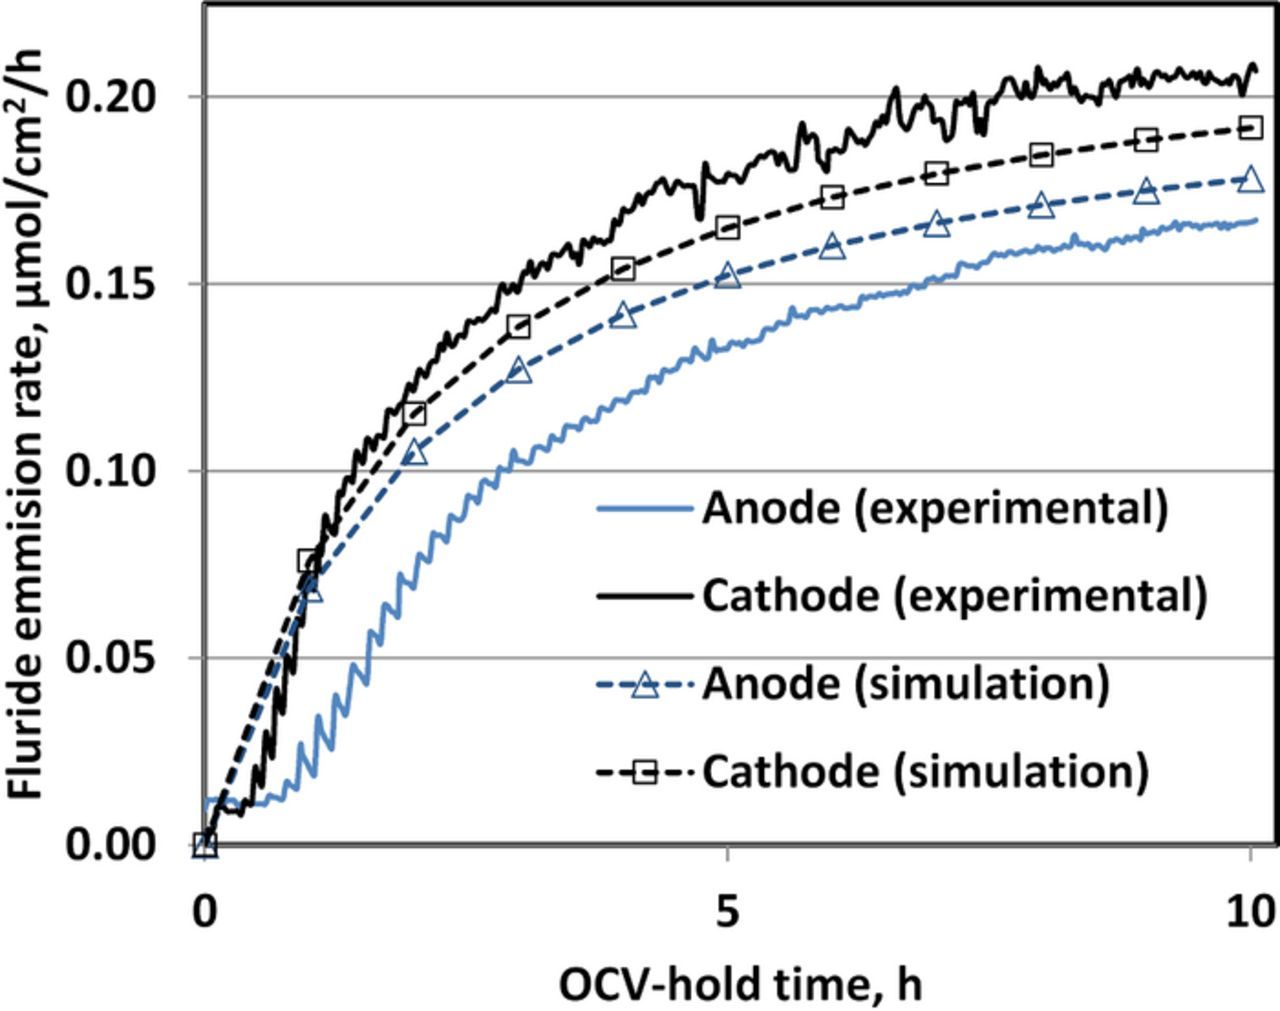
Figure 5. Fluoride emission rate at each electrode during an OCV hold condition (see Table V).
Degradation mechanism
The ratio of the cathode to anode FER was 1.075 in the simulation vs. 1.15 in the experiment. The simulated ratio of the FER increases with a decrease in the gradient of the theoretical electrode potential in the membrane which was increased linearly from 5 mV at anode-membrane interface to 20 mV at the cathode-membrane interface. Although a further reduction of the gradient in the theoretical electrode potential in the membrane would have resulted in a larger FER ratio, the resulting potential profile would become inconsistent with the experimental profiles observed by Liu & Zuckerbrod.35
The theoretical electrode potential in the membrane is influenced by the size of Pt particles which gets dissolved at the cathode, transported and re-deposited in the membrane.40 The measured and model potential profile varied approximately linearly from anode up to about 80% of the membrane thickness. To keep the model complexity in check and ensure tractable simulations, the potential was assumed to vary linearly inside the membrane. The potential profile and the gas composition in the membrane determine the rate of the two-electron reduction of dissolved oxygen to hydrogen peroxide by controlling the overpotential for the electrochemical reactions. The selectivity of peroxide formation over water generation is taken as unity, although it has been shown to generally vary as a function of the electrode potential and humidity.34
Formation of radicals from H2O2 decomposition is not a dominant membrane degradation mechanism in PEMFCs, rather membrane-degrading species appear to form in a reaction between molecular H2 and O2 on a catalytic site.41 Although a potential dependent H2O2-mediated indirect route of radical formation at Fenton's regents in the membrane was assumed here, the direct formation of membrane-attacking species cannot be ruled out. Thus, there is a need to delineate the role and selectivity of a potential-independent direct and a potential-dependent indirect route of radical formation.
Manifestations of degradation
Two of the consequences of membrane degradation are membrane thinning and OCV decay (Fig. 6). The OCV decrease resulting from the chemical membrane degradation induced by the OCV-hold test, is more rapidly in the experiments than in the simulation. Although not shown here, most of the decrease in the OCV was recoverable. A similar behavior was observed in another study where a voltage decay during 100 h of OCV hold was fully recoverable42 after treatment to remove contaminating species at electrodes. Hence the rapid and reversible decay in the experimentally-measured OCV can be traced to electrode contamination. The small OCV decay in the simulation is irreversible and due to high gas crossover associated with membrane thinning. A further source of voltage decay is loss of electrochemical surface area which is outside the scope of this study. The high frequency impedance yields an almost constant conductivity value (∼0.2 Ω⋅cm2) in the steady OCV phase from BOL to EOL, likely due to counteracting effects of reduced proton conductivity and membrane thinning.
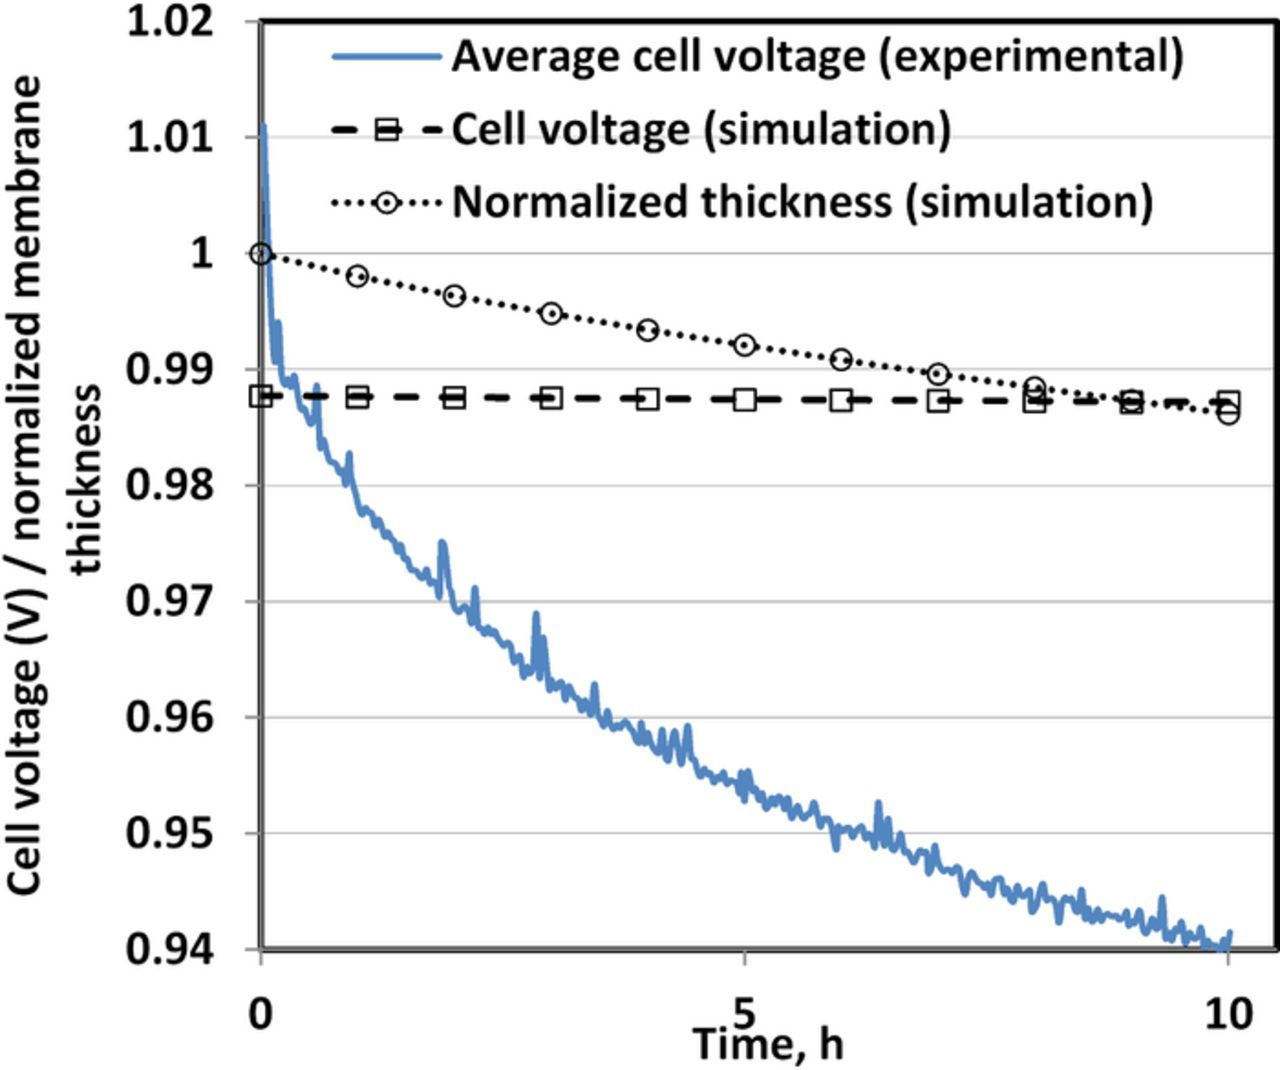
Figure 6. Open circuit voltage and normalized membrane thickness during the OCV-hold test for 10 h.
Without the addition of radical scavengers or additives such as ceria,43,44 PFSA based membrane does not seem to stabilize chemically and structurally. When subjected to harsh conditions such as high temperature OCV-hold, these membranes start to degrade chemically. Figure 7 shows the evolution of the simulated concentration of various functional groups of Nafion during the 10 h OCV-hold test. The most notable observation is the fact that 15.66% of sulfonic acid head groups are lost over the 10 h period of OCV-hold test with only 1.4% reduction in thickness; whereas as noted above protonic conductivity remains essentially constant. Lim et al. surmised this is due to a counteracting effect of membrane thinning and a decrease in the membrane conductivity due to the loss of the sulfonic acid head groups. Conversely, considering negligible membrane thinning, it could be argued that some side chain fragments are not actually washed away and stay inside the membrane with intact sulfonic acid head groups. This is especially plausible given that the C-S bond in the sulfonic acid group is not the weakest group to be attacked by the radicals, whereas the two C-O-C ether bonds on the side chain are more susceptible to radical attack.
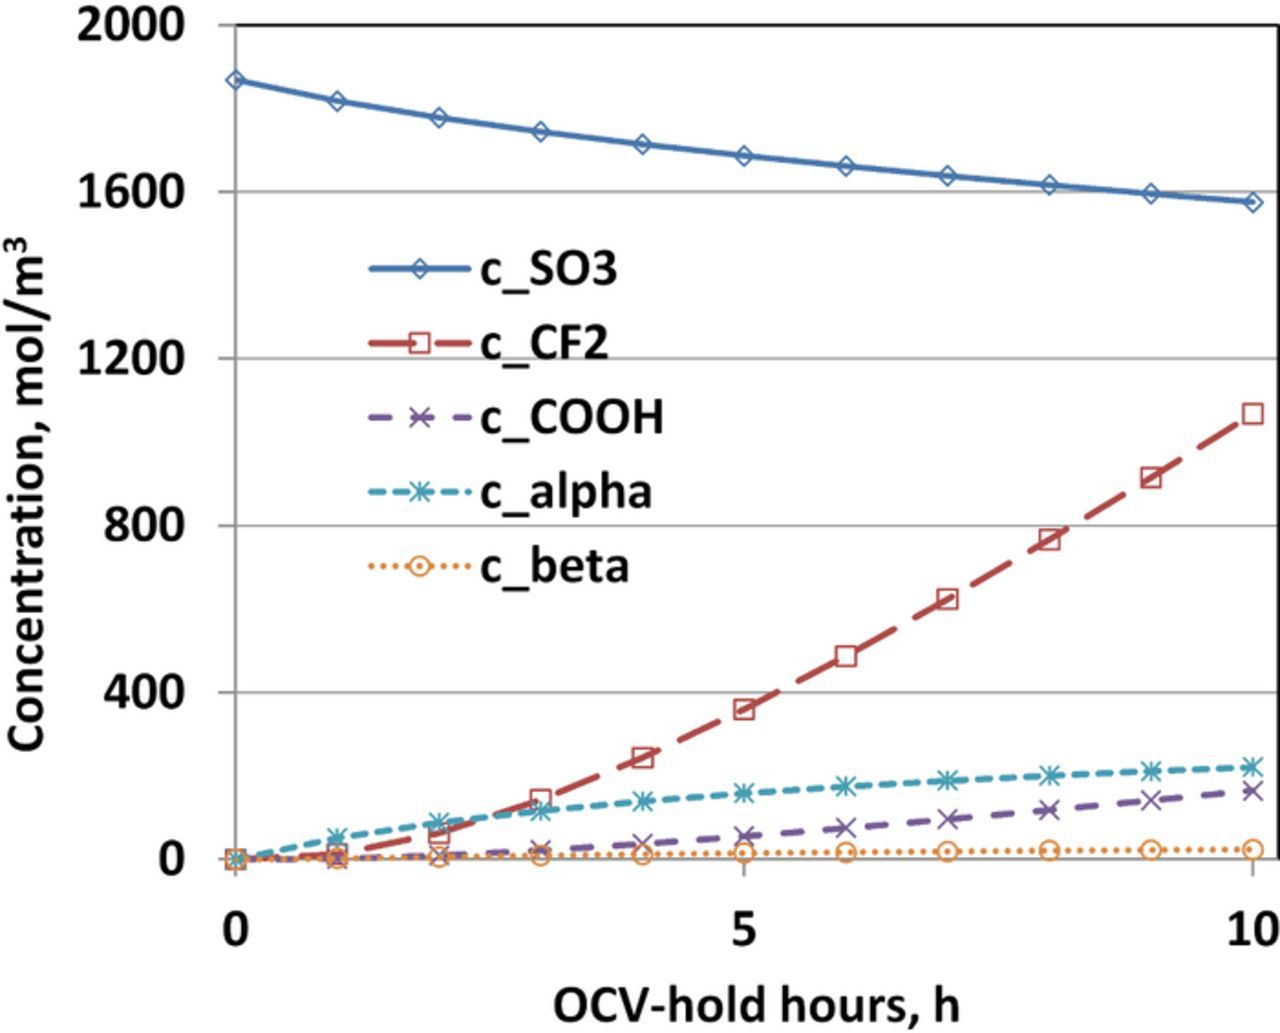
Figure 7. Evolution of the concentration of various chemical groups during the OCV-hold test for 10 h.
After OCV-hold for 10 h, the measured cell polarization behavior shows a marked decrease especially in the activation regime (Fig. 8). The trend is captured in the simulated polarization behavior; however, the small loss in cell performance in the activation regime is not reproduced by the simulation. The activation loss in the measured cell polarization behavior could be due to loss of cathode catalytic activity. The present model does not account for any CL degradation such as possible CL poisoning by the product of the degradation (e.g., the (bi-) sulfate ion) or for loss in catalytic activity due to Pt coarsening, dissolution and re-deposition in the membrane. Ongoing work is aimed at incorporating CL degradation in the model.
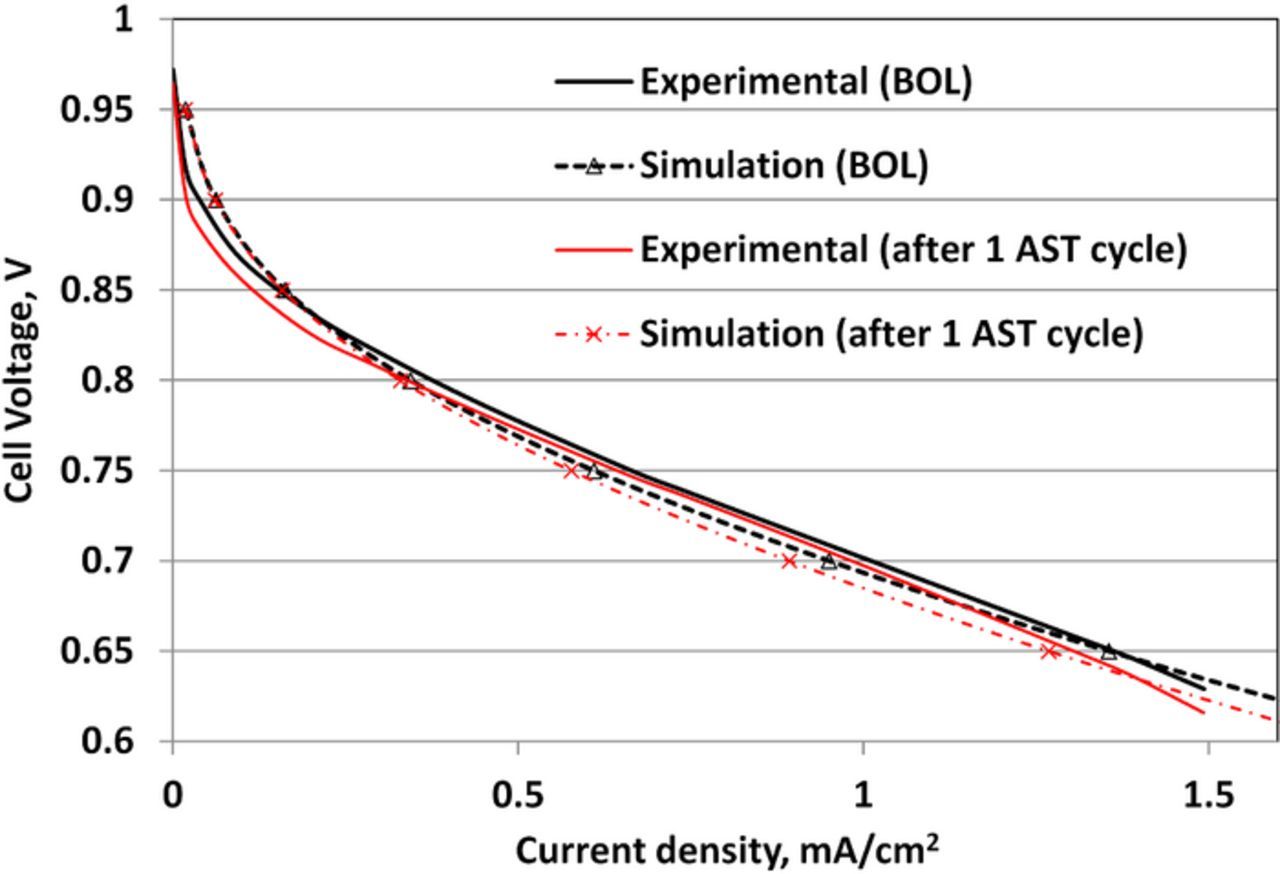
Figure 8. The polarization behavior of the cell (experimental data is the mean over a five cell stack) at 348.15 K and 100% relative humidity at beginning of life and after an OCV-hold of 10h.
Experimental observations point to the complex interplay and equilibrium among various radicals (•H, •OH, •OOH etc.) and this should also be considered in further model developments. The chemical degradation mechanism appears to be a function of the dominant radical in the membrane. Recent observations of ex-situ exposure of Nafion to selective •H and •OH radicals created by β–irradiation indicate that the radical •H attacks both main and side chain CF bonds, whereas •OH radical only attacks the oxygen containing ether bond in the side chain of Nafion.23 The former mechanism (attack of •H on the CF group) results in lower fluoride emission, however, attack by the •OH radical results in higher fluoride emission rate. Irrespective of the above mechanism the decrease in conductivity and ion exchange capacity are commensurate with the loss of sulfonic acid group. The deterioration in mechanical properties such as a decrease in strain-to-failure, increase in Young's modulus and a decrease in the ultimate tensile strength are linked to structure of Nafion. In order to predict the performance degradation under combined chemical and mechanical stressors, the gaps in understanding of the interplay between chemical composition, Nafion morphology and mechanical properties need to be bridged.45,46
Summary and Outlook
A transient, isothermal, 2D model of chemical degradation of a polymeric membrane in a PEMFC is developed. Membrane degradation was modeled to proceed in two stages: 1) indirect formation of hydroxyl radical and 2) a four-step attack of hydroxyl radical at the terminal ether bond on the side chain, the ether bond close to the main chain, chain scission at the side chain and chain unzipping. The MEA-level model was validated against the polarization behavior of a five-cell stack at beginning of life as well as after degradation of the stack over 10h of OCV-hold testing. The fluoride emission rate, voltage decay and change in membrane thickness under OCV hold test agree qualitatively with the degradation rates recently reported in the literature. The salient insights are:
- (1)The lower OCV of 0.985 V compared to the value of 1.16 V is due to the parasitic electrochemical reactions happening at the cathode, enabled by the hydrogen crossover from anode to cathode.
- (2)A four-step chemical degradation of the membrane set off by a peroxide-cum-hydroxyl radical formation at the electrode and in the membrane under the presence of a Fenton's reagent suffices to predict the qualitative trend observed in ex-situ Fenton tests and the OCV-hold test in an accelerated stress test.
- (3)A dynamic equilibrium seems to exist between various radicals such as •H, •OH and •OOH in a fuel cell. Efforts to further elucidate the degradation scheme for the chemical degradation and the complex equilibrium and interaction with Nafion are highly warranted. In this respect, recent ex-situ durability tests23 subjecting Nafion selectively to a particular radical could prove very valuable.
The reliability of degradation predictions requires more definitive determination of the exact mechanisms governing degradation. One way forward is the use of ab-initio simulations to determine the likelihood or not of various reaction steps. Further developments to improve quantitative fit to experimental degradation rate should also focus on 1) extending the current model to non-isothermal case, 2) implementing recent advances in rapidly evolving pore scale modeling to compute the effective transport parameters of the catalyst layer, MPL and diffusion media,47–49 3) incorporating the effect of mechanical stressors on the degradation especially its coupling with the chemical degradation, and 4) accounting for the coupling of membrane degradation with other cell components, the CL in particular.
Acknowledgment
Funding for this research provided by Ballard Power Systems, Automotive Partnership Canada (APC), and the University of Victoria is gratefully acknowledged. PCS acknowledges the financial support, in part, from National Natural Science Foundation of China (2017YFB0102700, 21776226), Hubei 100 Talents Plan, China, and the Hanse-Wissenschaftskolleg, Germany. The authors thank Dr Lim Chan of Simon Fraser University and colleagues at Ballard for valuable discussions and advice.
ORCID
E. Kjeang 0000-0002-1373-5212
N. Djilali 0000-0002-9047-0289