Abstract
In this work, synthesis and characterization of an anode supported tubular solid oxide fuel cell based on Ba0.5Sr0.5Ce0.6Zr0.2Gd0.1Y0.1O3-δ (BSCZGY) electrolyte has been investigated. Anode-supported Ni - yttria-stabilized zirconia (YSZ) anode was fabricated via slip casting; BSCZGY electrolyte and BSCZGY - La0.6Sr0.4Co0.2Fe0.8O3 (LSCF) composite cathode were coated on support using dip coating, respectively. The chemical compatibility of fuel cell components at sintering temperatures has been investigated by powder X-ray diffraction, and no severe reactions were detected. Electrochemical examination under air/H2 + 3 vol. % H2O showed superior performance achieving a maximum power density of 1 W/cm2 at 850°C, among the best compared to tubular – geometry oxygen conductor solid oxide fuel cells reported earlier and one of the highest reported for a proton conductor electrolyte in literature. Electrochemical impedance spectroscopy was used to examine the electrochemical performance of the full cell at different temperatures, and a detailed analysis was done to distinguish the contribution of ohmic and polarization resistances of the cell. ASR values were 3.47 Ω.cm2, 1.81 Ω.cm2, 1.23 Ω.cm2, and 1.05 Ω.cm2 at 600, 700, 800, and 850°C, respectively. Analysis of activation energy associated with charge and mass transfer based on fitting of impedances revealed that concentration polarization is the major contributor to the total resistance. The long-term stability for more than 96 hours of operation under load showed no significant degradation, which demonstrated the steady behavior of the cell.
Export citation and abstract BibTeX RIS

This is an open access article distributed under the terms of the Creative Commons Attribution 4.0 License (CC BY, http://creativecommons.org/licenses/by/4.0/), which permits unrestricted reuse of the work in any medium, provided the original work is properly cited.
A solid oxide fuel cell (SOFC) is a solid-state electrochemical device which converts the chemical energy stored in the fuel directly into electrical energy resulting in high efficiency which along with low environmental impact, quiet operation, and low maintenance makes SOFC highly suitable for stationary power generation applications.1 Traditional SOFCs employ Ni-YSZ cermet, oxide-ion conducting yttria-stabilized zirconia (YSZ), and lanthanum strontium manganite as the anode, electrolyte and cathode, respectively.2 To reduce the overpotentials associated with these materials, the cell needs to run at elevated temperatures near 1000°C.3 This negatively affects the choice of available materials mostly for interconnects and sealants and their long-term stability.4 To reduce the operating temperature of SOFC, one of the alternative is to develop new materials for cell components. Oxide ion conducting electrolytes La0.9Sr0.1Ga0.8Mg0.2O3-δ, Ce0.8Gd0.2O2-δ, and Ce0.8Sm0.2O1.9, and mixed ionic and electronic conductor cathodes Ba0.5Sr0.5Co0.8Fe0.2O3-δ, La0.99Ca0.01NbO4 and nickelates are some examples. These materials have their own drawbacks mostly related to chemical compatibility and cost resulting in limited large-scale usage.5 Unlike YSZ which conducts oxygen ions, there has recently been a new trend in developing electrolytes that conduct protons as shown by following equation with Kröger Vink notation:6
![Equation ([1])](https://content.cld.iop.org/journals/1945-7111/165/10/F764/revision1/d0001.gif)
where V••O indicates vacancy of oxide ion with effective two positive charges, andOH•O indicates proton attached to the regular oxygen ion site with positive relative charge.
Proton conducting electrolytes (PCEs) have two main advantages, first, they do not dilute the fuel which lowers the performance based on the Nernst equation.7 Also, due to their relatively low activation energy of conduction due to smaller size of H+, they can achieve high conductivity at lower temperatures.8–10 Iwahara et al. first reported high proton conductivity (σ ∼ 10−2 S cm−1 at 600°C) in perovskite type-doped-SrCeO3 and BaCeO3 ceramics under humid atmospheres in the early and late 1980s.11,12 But cerate based perovskites face the problem of poor chemical stability in the presence of moisture and CO2, which is a major hindrance for commercial realization.13,14 As humidity is present in every fuel cell, and CO2 is produced when hydrocarbons are used as fuel, this is an important issue for researchers to solve. On the other hand, Zirconate based perovskites are stable, both mechanically and chemically.15 However, Zirconate based perovskites such as BaZrO3 show lower electrical conductivity than cerate based oxides, due to large grain boundary resistance, which arises due to low sinterability and hence is also rather hard to sinter a leak-free PCE usually needing temperatures exceeding 1600°C, hampering its actual usage.16–18 Thus researchers have worked toward the solid solutions between BaCeO3 and BaZrO3 in order to achieve good chemical stability and high proton conductivity.17,19
Tubular SOFC has two main advantages over planar design. First, ease of sealing especially if the tube has only one open ending which greatly reduce the chance of cell failure due to the sealant degradation and enable to run the cell under high pressure operation.20 Second, it has more resistance toward thermal shocks which improve the start-up times.21 The main drawback of this design would be its lower performance compare to its counterpart mainly due to the longer path current must take to the current collector.22
Power density of the tubular SOFC is inversely related to the diameter.23 Zhang et al.24 reported high peak power density of 513 mW/cm2 at 850°C for a tube with outer diameter of 1.3 mm and 1.03 V for the open circuit voltage (OCV) with a YSZ electrolyte. Duan et al.25 achieved 522 mW/cm2 at at 850°C. With the help of PdO impregnation, this result jumped to 1220 mW/cm2 at the same temperature. The outer cell diameter was 10.5 mm and the electrolyte was YSZ. Hanifi et al.14 reported maximum performance of 416 mW/cm2 at 700°C using BaZr0.1Ce0.7Y0.1Yb0.1O3-δ but saw rapid degradation under CO-H2 mixtures.
In the previous work, we have developed and reported a PCE based on Ba0.5Sr0.5Ce0.6Zr0.2Gd0.1Y0.1O3-δ (BSCZGY) with excellent chemical stability under humidity and carbon dioxide.26 For improving chemical stability, Sr at the A-site and Zr at the B-site were doped in BaCeO3.26 And for increasing ionic conductivity, aliovalent Gd and Y were doped at B-site of BaCeO3.26 In the subsequent report, mechanically mixed Ni-BSCZGY (50:50 vol. %) anode composite exhibited area specific resistance (ASR) of 0.8 Ω.cm2 at 710°C under H2+3 vol.% H2O.27 By the same analogy to oxygen conductor SOFCs, if we use a PCE/Ni cermet as support, we face some challenges as well. Cerates have large thermal expansion coefficients due to the reduction of Ce4+ to Ce3+ which results in cell degradation in long-term operation.28 Zirconates have poor sinterability and thus do not have ideal mechanical properties as the support.26 Ni/YSZ can still be used as support instead to provide sufficient rigidity and electron conductivity of the cell without performance penalty but extra caution need to be taken to match the shrinkage of the support and the electrolyte.29 Bae et al.30 successfully used Ni/YSZ both for support and anode functioning layer to make a thin film proton conductor fuel cell with heterogenous structure to mitigate sintering shrinkage mismatch, achieving more than 1 V in open circuit. This study is aimed at using stable proton conductor BSCZGY as the electrolyte in a complete cell consisting of both an anode and cathode to evaluate its electrochemical performance.
Experimental
PCE synthesis
Proton conducting electrolyte with following nominal chemical composition Ba0.5Sr0.5Ce0.6Zr0.2Gd0.1Y0.1O3-δ (BSCZGY) was synthesized via conventional solid-state synthesis method, as reported in the previous report.26 Stoichiometric ratios of BaCO3, SrCO3, CeO2, ZrO2, Gd2O3, and Y2O3 (∼99.9%, Alfa Aesar) were first mixed and ball-milled with 10 mm zirconia balls and iso-propanol as solvent in 50 ml zirconia ball mill jars (Fritsch planetary ball mill, Pulverisette 5) for 6 h. Iso-propanol from milled powders was evaporated at 90°C and then powders were pre-treated at 1050°C for 24 h under air in an alumina crucible, followed by second milling for 6 h. After second milling, powders were uni-axially pressed at 200 kN pressure into cylindrical discs (∼2 cm thickness, ∼1 cm diameter). Cylindrical discs were then calcined twice at 1450°C for 24 h under air in an alumina crucible, with milling and pelletization step in between. In order to avoid reaction with alumina crucible and Ba evaporation, cylindrical discs were kept on and covered by parent powders. Resulting pellets after final sintering were ground to fine powders in mortar and pestle for powder-X ray diffraction (PXRD), chemical compatibility and electrochemical analyses.
Support fabrication
As-received YSZ (Tosoh TZ-8Y) and NiO (Aldrich, < 50 nm particle size) was mechanically ball-milled together with 35:65 weight ratio in water medium (1:1 ratio) for 24 h. To create enough porosity, 30 volume % graphite (Sigma Aldrich <325 mesh) was added to the mixture followed by final pH adjustment to 4. Slip casting in plaster mold was used to make the support. By controlling the time, a suitable thickness of support can be cast, and the excess slurry removed. The supports were pre-sintered at 1000°C for 3 h to gain sufficient strength and remove pore-former and water.
Anode functional layer (AFL) fabrication
NiO, PCE, ethanol and binder (6 wt% ethyl cellulose in terpineol) with appropriate ratio were mixed together and ultrasonicated to remove any undesirable agglomeration or air bubbles. The AFL was dip coated and pre-sintered at 1000°C for 3 h.
Electrolyte coating
Electrolyte suspension was a mixture of PCE, ethanol and binder. Similar to AFL coating, the coating continued until desirable electrolyte thickness of 10 micron was reached. Sintering was done at 1450°C for a leakage-free electrolyte.
Cathode coating
A mixture of La0.6Sr0.4Co0.2Fe0.8O3 (LSCF, Fuel Cell Materials)-BZCZGY, azeotrope solvent, polyvinyl butyral as binder, Menhaden fish oil as the dispersant and 30 vol.% graphite was used for cathode ink. The resulting mixture was dip coated on top of electrolyte followed by sintering at 1000°C to form LSCF-BZCZGY composite cathode. The top and base diameter of the cell was 5.5 mm and 5.23 mm, respectively, with a length of 33 mm and total area of 1.79 cm2 for the cathode.
Chemical compatibility between PCE and electrodes
The chemical compatibility of the PCE electrolyte with the LSCF (synthesized through sol-gel route) and NiO (Alfa Aesar) powders, was investigated by co-firing the powders at 1000°C and 1450°C, respectively, and analyzing the fired powders through PXRD. LSCF and BSCZGY powders (50:50 and 70:30 wt%) were mixed and milled for 6 h with iso-proponol, and were fired at 1000°C for 3 h with the heating rate of 5°/minute and cooling rate of 10°/minute. Similarly, NiO and BSCZGY powders (50:50 wt%) were ball milled for 6 h with iso-propanol followed by co-firing at 1450°C for 3 h with the heating rate of 5°/minute and cooling rate of 10°/minute. Bruker D8 powder X-ray diffractometer with CuKα was used to analyze the phase purity of co-fired electrolyte and electrode powders.
Electrochemical characterization
An Agilent electronic load (model # N3301A) was used to measure the OCV and I-V curves. An Agilent scanner (model # E4970A) monitored the thermocouples, while LabView software was used for automated measurements and data collection. Electrochemical impedance spectroscopy (EIS) measurements were used to measure the area specific resistance (ASR) of the cell with a four-probe configuration using a Solartron 1255 frequency response analyzer in combination with a Solartron 1287 electrochemical interface. The frequency range of measurement was between 0.01 Hz - 1 MHz with 12 points per decade. The data were recorded with 50°C interval in a temperature range of 600°C – 850°C using a four-probe setup with H2+3 vol.% H2O as fuel and air as the oxidant
Microstructure characterization
The study on the microstructure of the prepared cell was conducted on the fractured samples using a Zeiss Sigma 300 field-emission scanning electrode microscope (SEM). Carbon coating of the samples was done using a Leica EM SCD005 evaporative carbon coater.
Results and Discussion
Chemical compatibility
Figures 1a and 2b shows the PXRD patterns of mechanically mixed NiO and BSCZGY powders (50:50 wt%) at room temperature, and the co-fired powders at 1450°C. Figure 1a only shows the diffraction peaks of NiO and BSCZGY phases, and no additional diffraction peak of second-phase impurities such as BaNiOx, BaY2NiO5. As in the previous report,31 it has been shown that there is a possibility that Ni might substitute Zr site during mechanical mixing or firing at high temperatures owing to their similar ionic radii (rZr4+ = 0.72 Å, rNi2+ = 0.69 Å). Figure 1b shows the magnified PXRD pattern where it can be seen that there is very slight shift of BSCZGY (110) peak to high 2θ after firing, which indicates slight or no substitution of Ni in the Zr/Ce site of BSCZGY, indicating no change in stoichiometry of BSCZGY electrolyte.
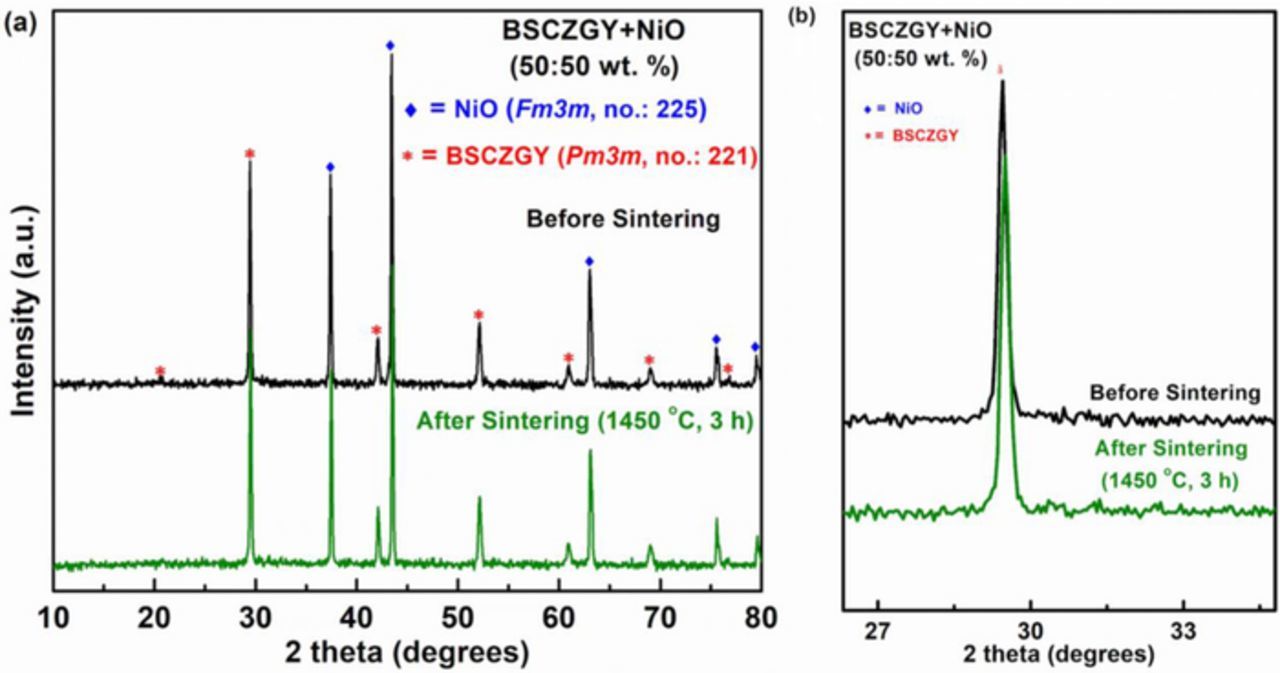
Figure 1. (a) XRD patterns of the fresh mixed and fired mixed powders containing NiO, and BSCZGY with a weight % ratio of 50:50. (b) Magnified XRD patterns for (a) showing very slight shift of BSCZGY (110) peak to high 2θ after firing, indicating slight or no subs.

Figure 2. XRD patterns of the fresh mixed and fired mixed powders containing LSCF, and BSCZGY with a weight % ratio of 50:50 and 70:30. Where fired powders show probable impurity (111) peak of CeO2 (marked as x).
Similarly, Figure 2 shows the room temperature PXRD patterns of mechanically mixed LSCF and BSCZGY (50:50 and 70:30 wt%) powders, and the co-fired mixtures at 1000°C. Even though the main cubic (Pm3m) perovskite phases for both BSCZGY and LSCF remained the same as the mechanically mixed powders at room temperature, the (111) peak of CeO2 appeared after firing at 1000°C. When compare this result to NiO and BSCZGY compatibility result, tendency of LSCF to react with electrolyte at firing temperature above 800°C might be responsible for some secondary reactions that occur at the interface between cathode and BSCZGY, resulting in appearance of CeO2 as a impurity phase.32,33
Electrochemical performance
Figure 3 shows the I–V and power density output curves of the cell measured under air/H2+3 vol.% H2O. The optimum temperature for operating the cell was found to be above 800°C with the maximum performance of 1 W/cm2 achieved at 850°C, making this cell a high temperature SOFC. The almost linear behavior of I–V data especially at higher temperature indicated ohmic behavior, the majority of the loss coming from the electrolyte and the connections. At higher currents, especially for 800°C and 850°C, the end of the curves which belongs to fuel starvation, becomes more significant. By increasing the temperature, OCV decreases and the values get closer to theoretical expectation based on the Nernst equation, suggesting a dense electrolyte that prevents charge transfer or gas diffusion directly between the two electrodes.
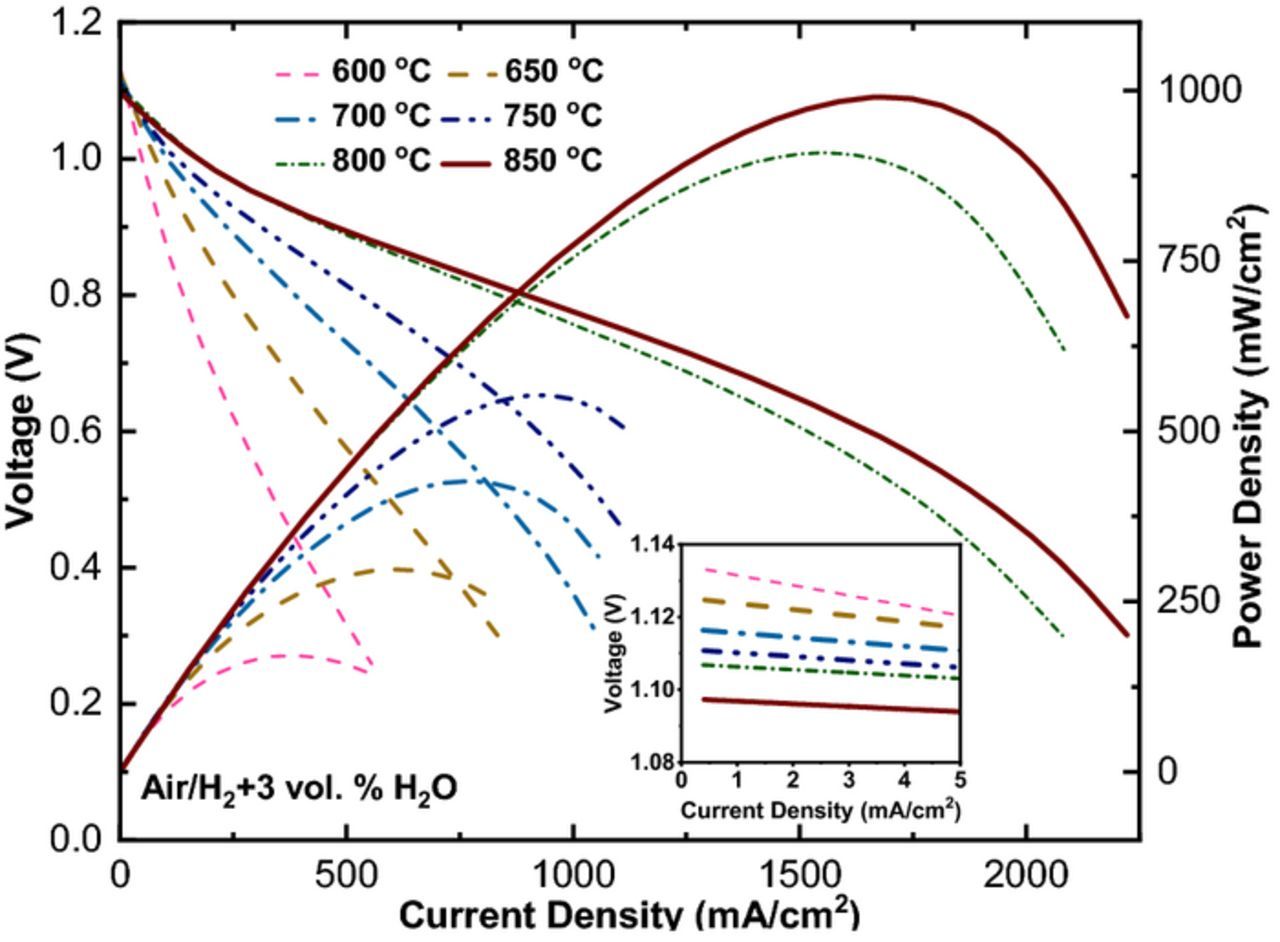
Figure 3. Electrochemical performance of the cell air / H2 + 3 vol. % H2O as a function of temperature.
Nyquists plots of the cell are shown in Figure 4a under open-circuit conditions. The R0-(CPE1-R1)-(CPE2-R2)-(CPE3-R3) equivalent circuit was used to fit the impedance spectrum similar to previous work.26 As expected, increase in temperature reduces both ohmic and polarization contribution to overall cell resistance. Figure 4b shows that at both 800°C and 850°C, similar ohmic contributions is observed, indicating that electrolyte conductivity appears to have increased slightly after 800°C. This can be ascribed to progressive dehydration at elevated temperatures and increase in oxide ion or electronic conductivity, leading to decrease in proton conductivity due to lower proton concentration.17,34
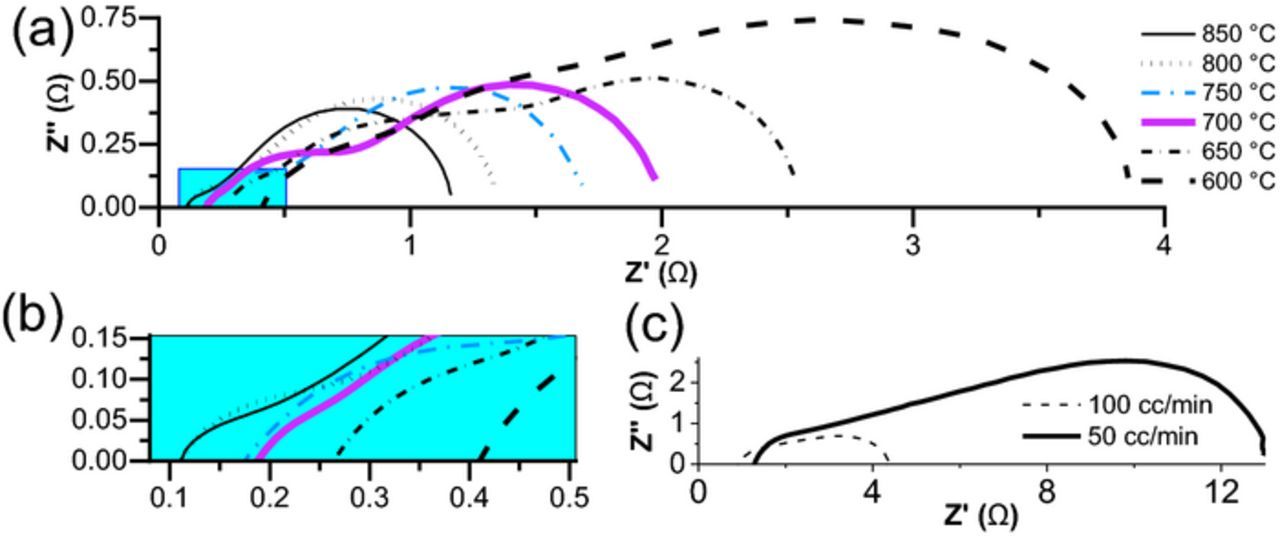
Figure 4. (a) Nyquist plots (not normalized) of cell at different operating temperatures (b) zoomed near origin (c) effect of oxidant flow on impedance spectrum at T = 600°C.
The far-right polarization arc belongs to a mass transfer occurring at the electrodes35 with ωmax = 6 − 8Hz and capacitance in the range of 0.1 F; it has arisen both from the cathode contribution36 and surface electrochemical reactions at the anode.27 Our results also show that this portion is extremely dependent on the flow of oxidant as shown in Figure 4c. Fuel flow has similar outcomes, but its effect was hampered due to the non-preheating fuel injection and deteriorating effect of cooling of the cell which both lowers the performance and becomes problematic in the long run.
Ohmic and polarization contribution and activation energy
Since proton conduction is a thermally activated process, the proton can be pictured as a trapped charge in an elastic crystal field and thus satisfies the definition of a polaron and resembles a polaron-type conductivity with Arrhenius behavior.37 LSCF follows a polaron conduction regime as well.38 Activation energy Ea depends on the concentration of charge carriers and can be related to electrical conductivity as shown in following equation:39
![Equation ([2])](https://content.cld.iop.org/journals/1945-7111/165/10/F764/revision1/d0002.gif)
In Equation 2, kB is the Boltzmann constant, T is absolute temperature and σ○ is the pre-exponential factor mostly involving the carrier concentration in the material.40 Using the data obtained from the fitting of impedance curves, the activation energy can be calculated from the slope of ln (T/resistivity) versus 1000/T plots, as can be seen in Figure 5 for both the polarization and ohmic parts. This figure also shows total resistance at each temperature point. The approximately linear slope indicates that conduction mechanism remains same in the temperature range of 600–850°C.41 If we consider the electrolyte contribution to be entirely from the ohmic part, then the activation energy is estimated to be around 0.53 eV similar to the value reported previously.42 Since 30% of the cathode is PCE, the activation energy of 0.39 eV seems logical knowing that the value for pure LSCF is 0.21 eV.38

Figure 5. Arrhenius plots of resistivity as a function of temperature and activation energy values calculated from ohmic and polarization part of impedance. The lines passing through symbols are only guide for the eyes. Where, Eao = Activation energy due to ohmic contribution, and Eap = Activation energy due to polarization contribution.
Long-term degradation
Figure 6 shows the long-term run of the cell under the load for four consecutive days. The voltage is kept constant at 0.7 V and the current is measured over time. Fluctuations in current are mainly due to imperfect current collector attachment especially at the anode side and coarsening of the electrode particles.43 After four days, some slight variation was observed but there was no significant decrease in the performance compared to the start of the test.
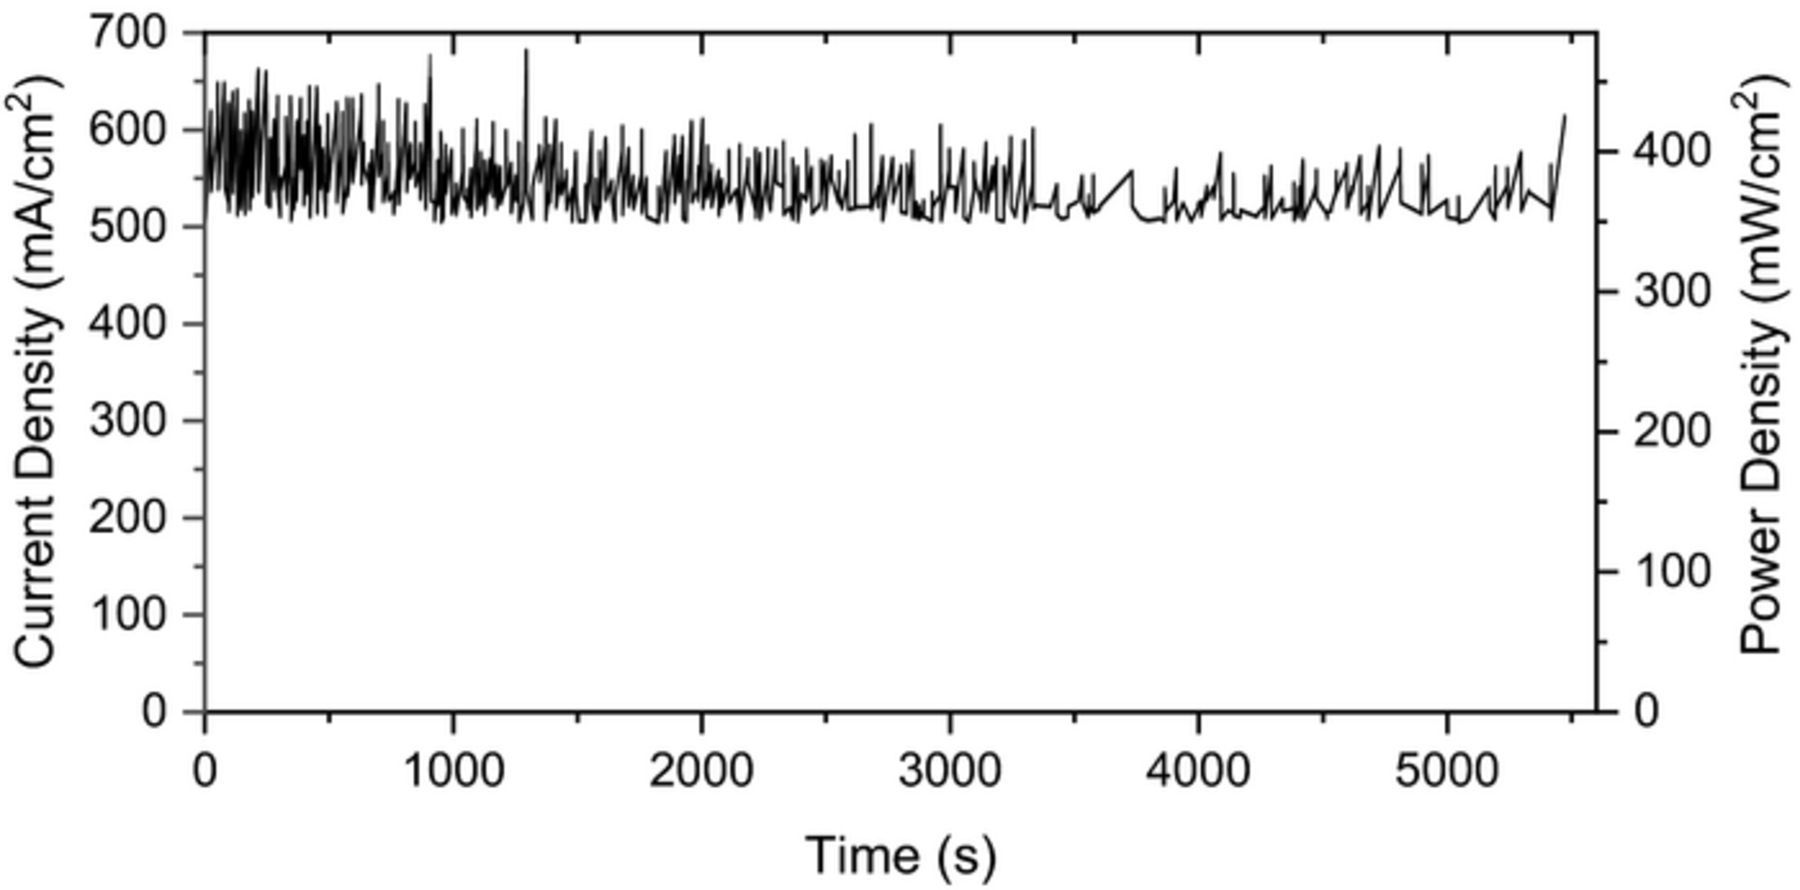
Figure 6. Long-term performance of cell under load of 0.7 V.
Figure 7 shows the impedance spectrum initially, after 18 hours, and at the end of the test after four days, verifying no major degradation during the test. The ohmic contribution shows a slight increase in magnitude mainly due to imperfect attachment of mesh on the anode side. The activation portion of the polarization sees a hike which is mainly due to coarsening and lowering of the number of active sites. Polarization resistance is the main mechanism for degradation of the cell in agreement with other reported results.44–46
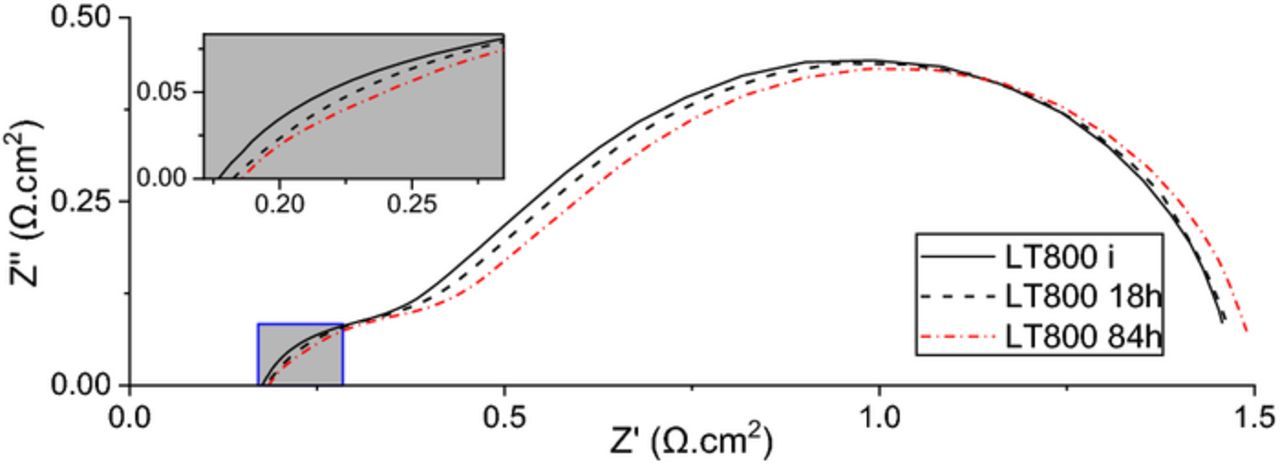
Figure 7. Long-term run impedance spectrum.
Cell microstructure after electrochemical tests
Figure 8 shows the cross-section micrograph of a broken cell. The total thickness of the cell is estimated to be around 410 microns with the AFL and electrolyte about 8 and 10 microns, respectively. The cathode is estimated to be 25 microns in thickness. The far right side of Figure 8a shows the gold current collector. To achieve superior performance, it has been suggested to design a dual layer microstructure comprising an outer layer having coarser particles that act as a conduction layer while the second one near the electrolyte consists of fine particles known as the AFL that has a high electrocatalytic activity which results in a decrease in activation polarization.47 Based on Figures 8a and 8b, the support is evenly distributed, although the high sintering temperature results in lower overall porosity and causes higher concentration polarization as previously observed. More tailoring of the microstructure seems essential, allowing the fuel to reach the functional layer more easily. The density of the AFL seems satisfactory, having enough active sites to convert hydrogen atoms to ion species. The electrolyte in Figure 8c shows fully dense electrolyte, which was achieved due to nano-grain precursors that were made using the sol-gel method. Adherence looks satisfactory with no gaps in between and a smooth transition from the support to the AFL and to the electrolyte. The composite cathode in Figure 8d consists of a BSCZGY matrix with LSCF particles dispersed in it. BSCZGY guarantees good bonding and ionic pathways for reactants and LSCF contributes electronic conductivity and is an excellent catalyst for the oxygen reduction reaction at the cathode generating a volumetric active region rather than a thin film one.
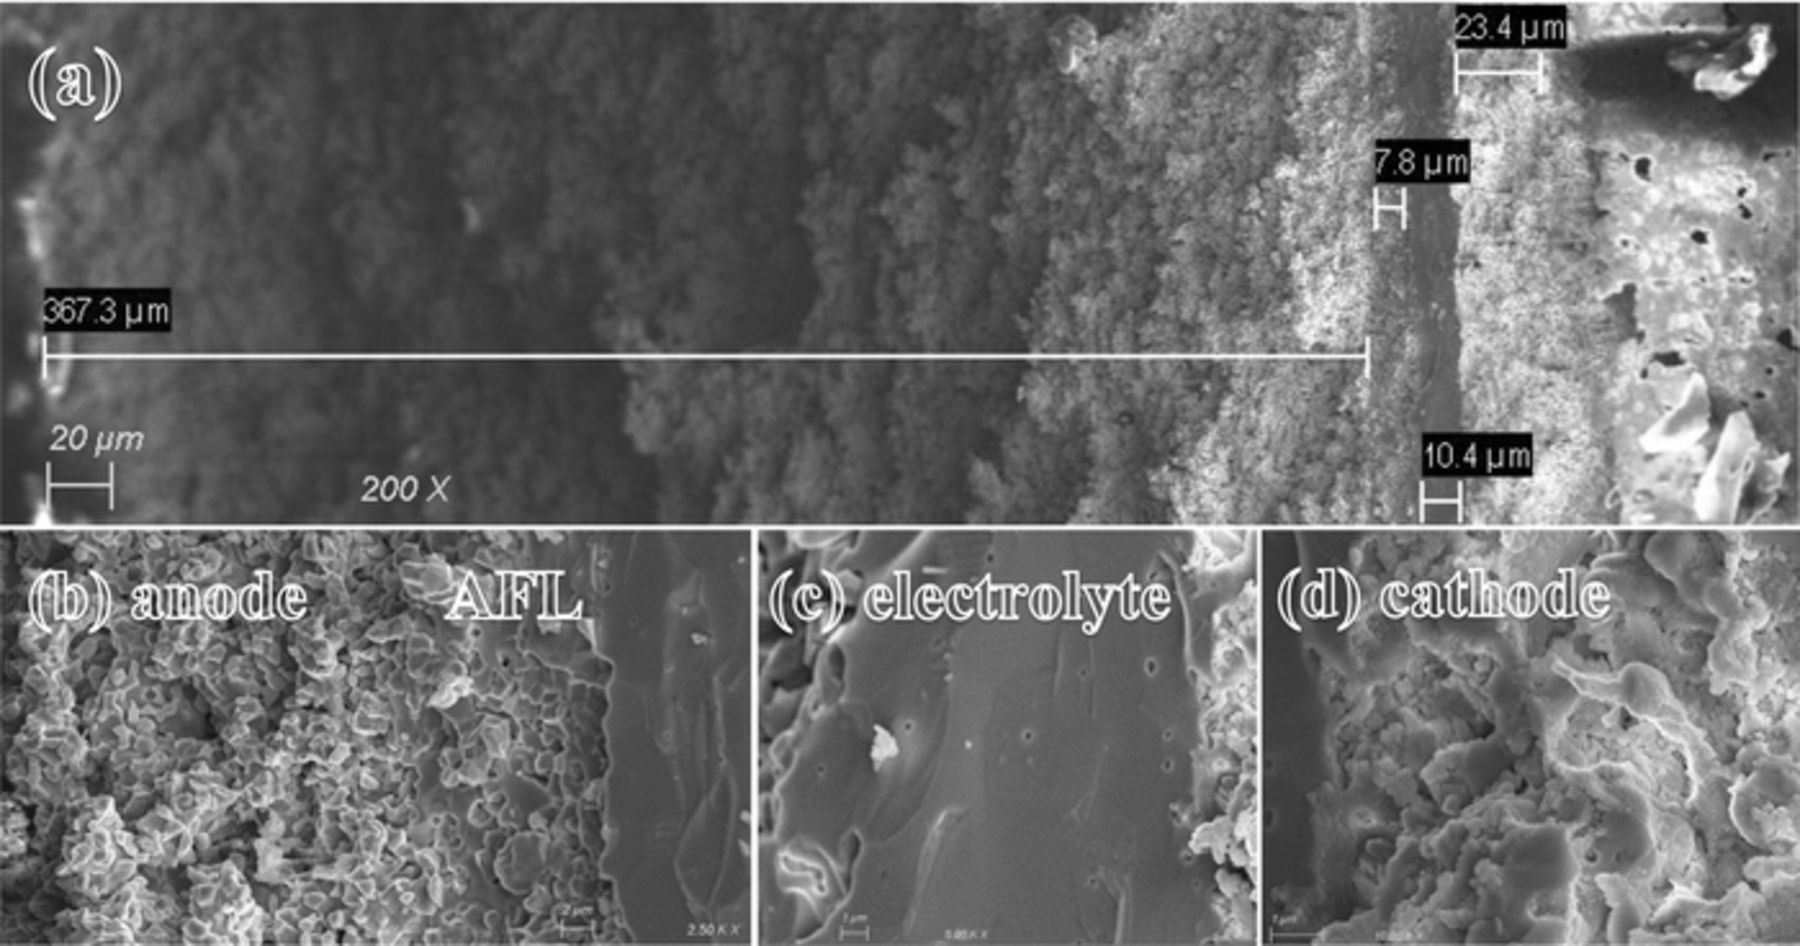
Figure 8. SEM images of cross-section view of the (a) whole cell, (b) from left to right, anode, AFL, electrolyte, (c) electrolyte, and (d) cathode after electrochemical testing in the air/H2 + 3 vol.% H2O.
Conclusions
A tubular SOFC based on a BSCZGY electrolyte was prepared using slip casting and dip coating. Investigations on chemical compatibility of the anode-electrolyte and electrolyte-cathode combinations revealed no major obstructive secondary phases due to the sintering process. The dependence of performance on temperature was studied, achieving maximum power density of 1 W/cm2 at 850°C, one of the highest powers reported so far on tubular proton conductor SOFCs. The conductivity of the electrolyte changes only slightly above 800°C. Impedance analysis revealed the major part of the resistance comes from polarization, dominated by bulk diffusion, which is the bottleneck of performance and makes it essential to optimize cell microstructure. The micrograph also confirms this understanding. Satisfactory long-term results seen for four day run under load and impedance confirms negligible degradation. Detailed investigation of activation energies calculated both for the electrodes and electrolyte shows similar activation energies as reported in the literature. Therefore, this SOFC based on BSCZGY would be a suitable candidate for practical applications, especially in power generation and solid membrane reactors.
Acknowledgment
Special thanks to the Natural Sciences and Engineering Research Council of Canada (NSERC) and InnoTech Alberta for funding this project. This research was supported from the Canada First Research Excellence Fund (CFREF) (to V. T. & K. S.) at the University of Calgary. V. T. also thanks the NSERC and Alberta Innovates for the support.
ORCID
Taghi Amiri 0000-0001-6986-8164
Jing-Li Luo 0000-0002-2465-7280
Venkataraman Thangadurai 0000-0001-6256-6307