Abstract
In this paper, we aim to understand the interrelationships between current, voltage, radiant power, and eventually, the power efficiency (PE) of InGaN-based blue light-emitting diodes (LEDs) at high injection currents. For this purpose, we first summarize the terms and definitions of various LED efficiencies. It is essential to measure each efficiency to understand the physics behind the LED operation and improve the device performance further. Here, we show how to measure various LED efficiencies with physically measurable quantities of the radiant power, current, voltage, and spectrum of the LED device. Both the internal quantum efficiency (IQE) and the voltage efficiency (VE) are interrelated with the carrier recombination processes. The newly introduced active efficiency (AE) captures the effects of the active-layer quality on the IQE and the VE simultaneously. A novel method of measuring the IQE just at room temperature, so-called the room-temperature reference-point method, enables the measurement of the IQEs of many LED chips, highlighting the importance of the AE. Using the experimental IQE curve, it is possible to separate the total injection current into the radiative and nonradiative recombination currents. A trade-off relationship between the IQE and the VE and its common origins are revealed by this approach.
Export citation and abstract BibTeX RIS

This is an open access article distributed under the terms of the Creative Commons Attribution 4.0 License (CC BY, http://creativecommons.org/licenses/by/4.0/), which permits unrestricted reuse of the work in any medium, provided the original work is properly cited.
A major challenge for III-nitride LEDs is delivering the highest efficiency performance at the current density and temperature relevant to the operation. The overall performance of a light-emitting diode (LED) is characterized by the power efficiency (PE), which is defined as the ratio of the output radiant (or optical) power to the input electrical power.1,2 The PE is an ultimate measure that shows how efficiently the electrical power is converted to the radiant power. To improve the device performance further, one needs to know more details constituting the PE.
The PE can be decomposed into its constituent factors, namely, the voltage efficiency (VE) and the external quantum efficiency (EQE). Subsequently, the EQE can be decomposed into the light-extraction efficiency (LEE) and the internal quantum efficiency (IQE). The PE, the VE, and the EQE are experimentally determined from the data of the current, voltage, radiant power, and spectrum of a device. The LEE and the IQE can be separately known from the measured EQE once one of them is determined. The LEE is known as almost constant independent of the operating current, while the IQE varies with the injection current and is linearly proportional to the EQE.3 In practice, a trade-off between the IQE and the VE are often observed with only slight changes in active-layer growth conditions, which makes it difficult to improve the PE further. Nonetheless, in previous studies, the IQE and the VE have been treated as if they were governed by independent physical mechanisms.
So far, only the IQE has been used for the quality evaluation of the active region. Theoretically, however, the IQE and the VE are interactively affected by various carrier recombination processes so that they must be closely interrelated. In order to evaluate the active-layer quality from the viewpoint of the PE, it is required to introduce a new performance parameter that takes both the IQE and the VE into account.
In this paper, we aim to understand the physical interrelationships between the current, voltage, radiant power, and eventually, the PE of the InGaN-based blue LEDs especially at high injection currents. Definitions of various LED efficiencies and their measuring procedures are given. Instead of the IQE as a single quality parameter of the active region, the active efficiency (AE) is introduced as the product of the IQE and the VE. As reliable and accurate measurement methods of the IQE, the temperature-dependent electroluminescence (TDEL) and the room-temperature reference-point method (RTRM) are reviewed and compared in detail. To investigate the correlation between the IQE and the forward voltage, InGaN/GaN blue LED chips are utilized with the total current expressed as the sum of the radiative and nonradiative recombination currents. This approach reveals a trade-off relationship between the IQE and the forward voltage and their common origins. In the next section, we first summarize the various LED efficiencies.
Various LED Efficiencies
Definitions
For a LED chip electrically driven by a power source producing the forward voltage VF and the forward current IF, the total electrical power supplied is VFIF. The LED operation is more clearly understood when we express VFIF as (qVF)(IF/q), where q is the elementary charge. qVF is the mean electrical potential energy of each electron delivered by the forward voltage VF and IF/q is the number of electrons injected into a LED per second. In the ideal case, each electron energized by the power source should create a photon of energy qVF without any loss in energy. In the real case, however, there are many loss mechanisms in electrical and optical energies during the electrical-to-optical energy conversion process. Figure 1 shows a schematic diagram illustrating the transport and recombination of carriers in an InGaN/GaN multiple-quantum-well (MQW) blue LED. Electrons injected from an external power source into the active region lose their potential energies inside and outside the active MQW region radiatively and nonradiatively.

Figure 1. Schematic band diagram illustrating the transport and recombination of carriers in an InGaN/GaN MQW blue LED.
For LEDs, various efficiencies can be defined as a measure of different conversion processes.1,2 The PE characterizes the overall efficiency of a LED device. Using the radiant power (coupled to the free space), Φe, the PE, ηPE, is expressed as
![Equation ([1])](https://content.cld.iop.org/journals/2162-8777/9/1/015013/revision1/d0001.gif)
Since the PE represents how efficiently a LED device converts the electrical energy to the optical energy, it is the most important efficiency parameter. The electrical energy that is not converted to the optical energy is wasted as heat. There are various factors that affect the PE and these factors are characterized by various other efficiency parameters. From now on, we review the efficiency parameters that constitute the PE.
The VE, ηVE, represents the ratio of the mean photon energy emitted from the LED to the mean electron energy supplied by the power source:
![Equation ([2])](https://content.cld.iop.org/journals/2162-8777/9/1/015013/revision1/d0002.gif)
where  is the mean photon energy. The VE is a measure of the loss in electrical potential energy during the electron transport from the power source to the active region of the LED. The loss in electrical potential energy mainly results from the ohmic loss occurring at the metal and semiconductor interfaces, bulk semiconductor materials, and semiconductor heterointerfaces.
The mean photon energy  is defined as follows:
![Equation ([3])](https://content.cld.iop.org/journals/2162-8777/9/1/015013/revision1/d0003.gif)
where h is the Planck constant, c is the speed of light in vacuum, and λ is the free-space wavelength. Note that the integral  represents the number of photons emitted from the LED per second. The mean photon energy is approximately equal to the bandgap energy of the active region of the LED.
The EQE, ηEQE, defined as the ratio of the number of photons emitted into the free space per second to the number of electrons injected into the LED per second, i.e.,
![Equation ([4])](https://content.cld.iop.org/journals/2162-8777/9/1/015013/revision1/d0004.gif)
Note from Eqs. 2 and 4 that the multiplication of the VE and the EQE gives the PE, i.e.,
![Equation ([5])](https://content.cld.iop.org/journals/2162-8777/9/1/015013/revision1/d0005.gif)
The IQE, ηIQE, is defined as the ratio of the number of photons emitted from the active region per second to the number of electrons injected into the LED per second:
![Equation ([6])](https://content.cld.iop.org/journals/2162-8777/9/1/015013/revision1/d0006.gif)
where Φe,active is the radiant power emitted from the active region. The IQE is greatly dependent on the crystal growth and the epitaxial layer structure. The IQE is one of the key performance parameters of the LED.
The ratio of the number of photons emitted into the free space per second to the number of photons emitted from the active region per second is defined as the LEE, ηLEE:
![Equation ([7])](https://content.cld.iop.org/journals/2162-8777/9/1/015013/revision1/d0007.gif)
The LEE is a measure of the photon loss during the propagation from the active region into the free space. In an ideal LED, all photons emitted by the active region should escape from the LED chip. However, in a real LED, not all the radiant power emitted from the active region is emitted into the free space due to such factors as the total internal reflection. The trapped photons inside the LED chip are eventually absorbed by the device, generating heat. Increasing the LEE is one of the main endeavors many chip manufactures are dedicated to so that they could improve the PE. Using the EQE and the IQE expressed by Eqs. 4 and 6, the LEE can be expressed as
![Equation ([8])](https://content.cld.iop.org/journals/2162-8777/9/1/015013/revision1/d0008.gif)
The injection efficiency (IE), ηIE, characterizes the ratio of the number of electrons injected into the active region per second to the number of electrons injected into the LED per second:
![Equation ([9])](https://content.cld.iop.org/journals/2162-8777/9/1/015013/revision1/d0009.gif)
where IF,active is the forward current injected into the active region, excluding the overflown part. The IE generally depends on the current level as well as the LED structure itself.
With respect to IF,active, one can define the radiative efficiency (RE), ηRE:
![Equation ([10])](https://content.cld.iop.org/journals/2162-8777/9/1/015013/revision1/d0010.gif)
which is different from the IQE by the factor IE:
![Equation ([11])](https://content.cld.iop.org/journals/2162-8777/9/1/015013/revision1/d0011.gif)
Finally, the AE, ηAE, is defined as ηAE = ηVE · ηIQE:
![Equation ([12])](https://content.cld.iop.org/journals/2162-8777/9/1/015013/revision1/d0012.gif)
In photodiodes, the generation processes are represented by two performance parameters of the IQE (defined inversely to the definition above) and the responsivity, which are utilized to indicate the quality of the absorption layer.4 On the other hand, only the IQE has been utilized to quantify the quality of the active layer in the LED. There has been no performance parameter for a LED corresponding to the responsivity. Here, we take the AE of the LED as a performance parameter similar to the responsivity of a photodiode. The physical meaning of the AE is discussed later in more detail.
In summary, the PE of a LED can be rewritten as follows:
![Equation ([13])](https://content.cld.iop.org/journals/2162-8777/9/1/015013/revision1/d0013.gif)
Separate measurement of various LED efficiencies
As individual efficiencies represent different physical processes, measuring various efficiencies is very crucial in identifying any problem and enhancing the LED performance further. Figure 2 is a flowchart for measuring the various LED efficiencies separately. The PE defined in Eq. 1 can be obtained straight-forwardly by measuring the radiant power Φe and the electrical parameters VF and IF. In order to define the EQE, one needs to find the mean photon energy  , using Eq. 3. Once the mean photon energy is defined, the EQE can be obtained from Eq. 4. Using the obtained PE and EQE, the VE can now be calculated by using Eq. 5:
  . To separate the efficiencies further, the IQE is required. Methods of obtaining the IQE are discussed in the following section. Once the IQE is determined by methods such as the RTRM, the LEE can now be obtained by using Eq. 8:
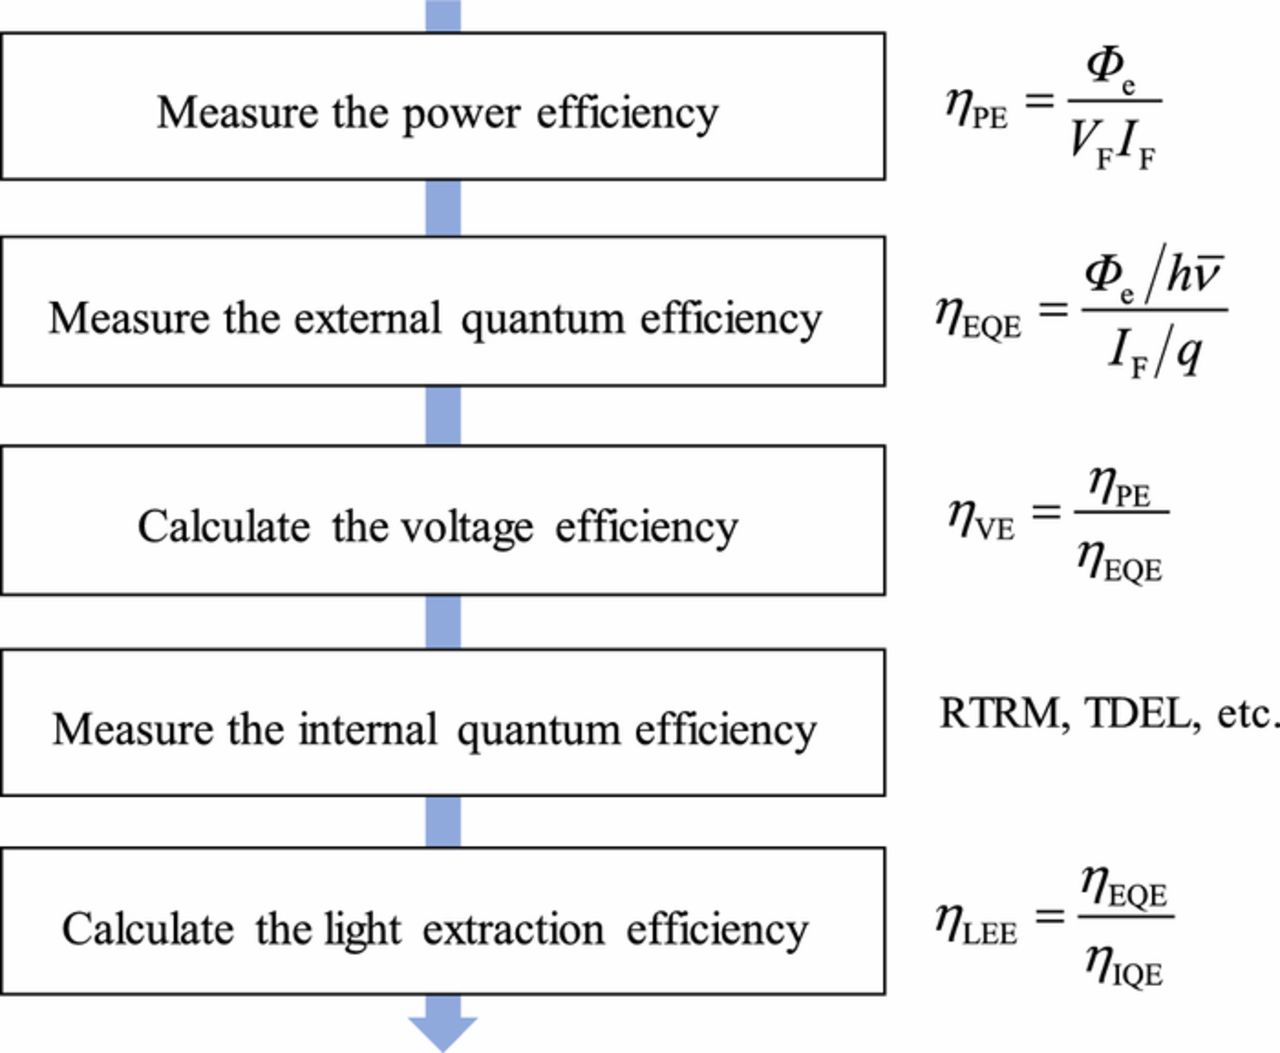
Figure 2. Flowchart of efficiency measurements.
Radiative and nonradiative recombination currents
The injection current vs. applied voltage (I-V) curve of a pn-junction diode is typically described by the Shockley equation.5 The Shockley equation was originally developed for a pn homojunction diode based on Si or Ge, where most of the carriers under forward bias are transported and diffused to the pn-junction and recombine there.6 Such carrier transport and recombination processes in the Shockley equation are simply represented by a single exponential function with a diode ideality factor, the reverse saturation current, and the junction potential drop. Contrary to the Si pn diode, the injection current IF in the LED can be divided into two distinct current components representing different carrier recombination processes, namely, the radiative recombination current, Irad, and the nonradiative recombination current, Inonrad, i.e., IF = Irad + Inonrad.7 In this sense, the conventional Shockley equation is not adequate to describe the I-V characteristics of the LEDs accurately. While there have been frequent investigations on the injection current I vs. applied voltage V by the Shockley equation, the data of Irad and Inonrad vs. V still require a deeper analysis for the LED device.
The separation of IF into Irad and Inonrad can be achieved by utilizing the experimental IQE curve. Then, each current can be carefully investigated as a function of applied voltage. This approach is to reveal that the IQE and the operating voltage at high injection currents are closely related physically with the phase-space filling and the carrier overflow by the accumulated carriers in the active MQW region.
Using the radiative and nonradiative currents, the IQE can be re-expressed as follows:
![Equation ([14])](https://content.cld.iop.org/journals/2162-8777/9/1/015013/revision1/d0014.gif)
With Eq. 14, the radiative and nonradiative currents can be obtained as
![Equation ([15])](https://content.cld.iop.org/journals/2162-8777/9/1/015013/revision1/d0015.gif)
![Equation ([16])](https://content.cld.iop.org/journals/2162-8777/9/1/015013/revision1/d0016.gif)
IQE Measurements by the Reference-Point Method: TDEL and RTRM
Requirements for accurate and reliable IQE measurement
The IQE of a LED is a key parameter that represents the quality of epitaxial layers. The IQE contains essential information on operational mechanisms such as the electron-hole recombination rate, the defect density, and the carrier transport. In general, the IQE varies with the operating conditions of injection current I and temperature T as expressed below:
![Equation ([17])](https://content.cld.iop.org/journals/2162-8777/9/1/015013/revision1/d0017.gif)
For accurate estimation of the IQE, it is necessary to consider the IE and the RE separately and quantitatively.
In view of accuracy, simplicity, reproducibility, and experimental system cost, the IQE measurement methods satisfying the following requirements are very desirable: (i) use only experimentally measurable quantities such as the current and the radiant power without assuming any physical parameters such as chip sizes, epitaxial layer structures, carrier recombination rates, and complex refractive indices; (ii) measure the relative radiant power rather than the absolute one for minimizing measurement errors; (iii) use measurement conditions of the operational temperature and pumping scheme: the electroluminescence (EL) at room temperature is the most preferable combination; and finally, (iv) use the CW pumping and its steady-state response of the spontaneous emission, which eliminates the need for complicated and expensive experimental setups such as a short-pulse current driver, a high-speed photodetector, and an impedance matching circuit for good RF signal integrity.
Two methods of measuring the IQE as a function of DC injection current satisfying the aforementioned requirements are introduced next. The first is the TDEL and the second is the RTRM. Their IQE measurement approaches are similar in that they first find an exact IQE value at one operating condition called the reference point and then use the relative EQE curve to obtain the IQE values at other operating points.
TDEL
This method has been most popularly utilized in the LED community and recognized as a standard method for determining the LED IQE.8–10 This is partly due to the fact that it only needs a set of experimental data, the relative radiant power vs. current (Φe − I) at various temperatures including cryogenic temperatures. Figure 3 schematically demonstrates how one can estimate the IQE at room temperature by measuring the relative EQE curves at various operating temperatures from room to cryogenic, based on the TDEL method.
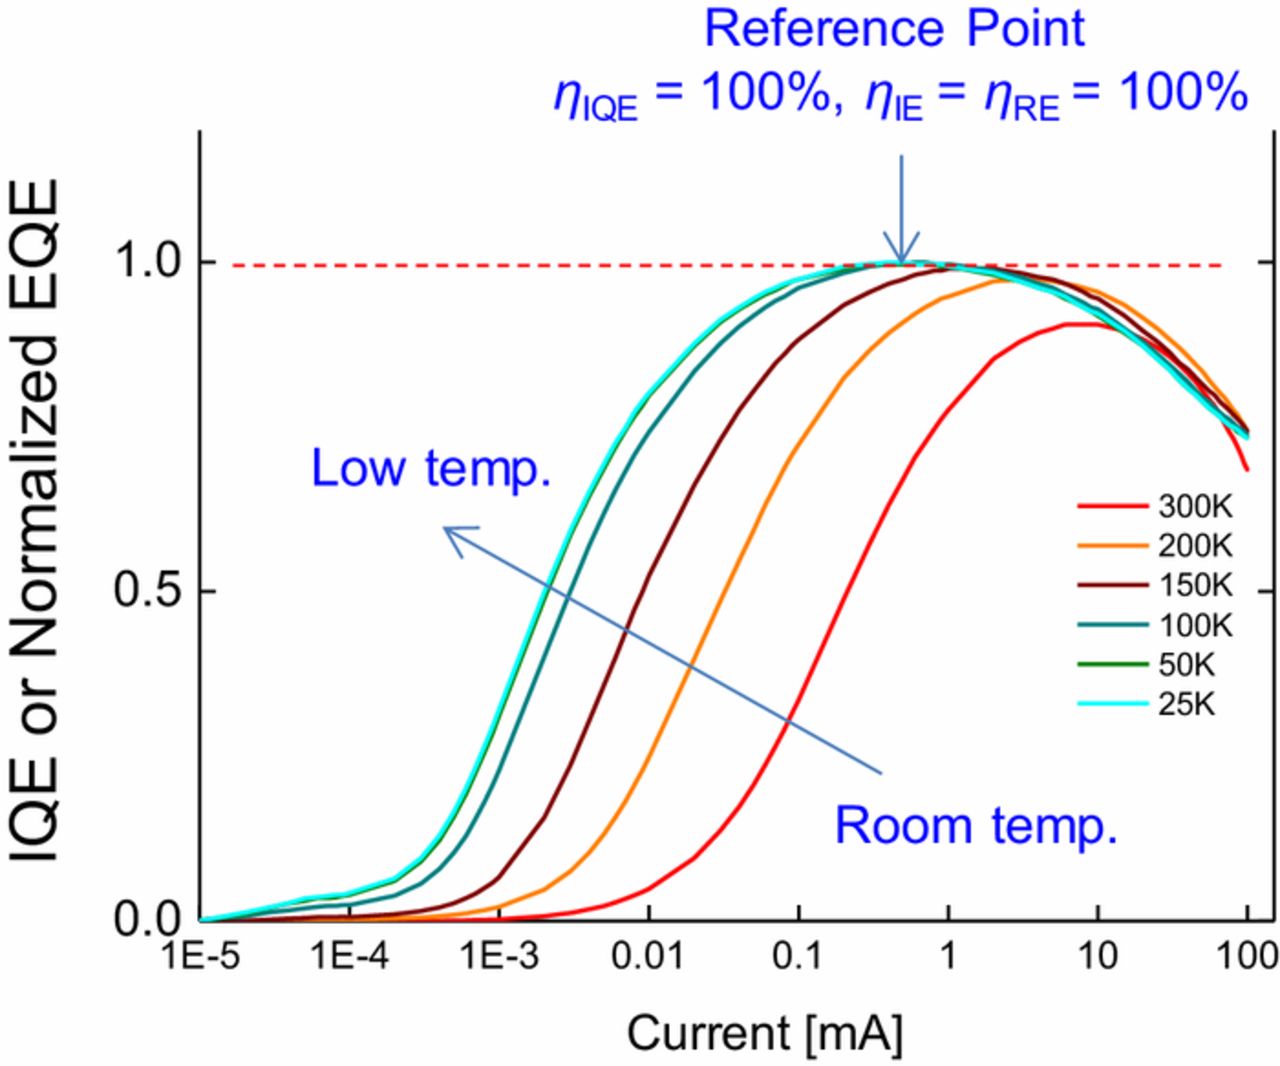
Figure 3. The IQE as a function of current at various operating temperatures from room to cryogenic, measured by the TDEL method.
Two important assumptions are introduced in the TDEL method. The first is that the LEE is constant, independent of current and temperature, so that the EQE should be linearly proportional to the IQE for any I and T. This assumption enables finding the IQE at any I and T only by comparing the EQE in question with the EQE at a reference current and temperature, Iref and Tref, at which the IQE is exactly known as ηIQE,ref. In general, the reference point of Iref and Tref is selected for ηIQE,ref = 1 such that both the RE and the IE must be 100% there.
To find the reference point satisfying ηRE = ηIE = 1, the second assumption is used. At cryogenic temperatures, the nonradiative recombination centers in the active layer, which induce the Shockley-Read-Hall (SRH) recombination, become frozen and inactive. By assuming that the SRH recombination is negligibly small at the lowest cryogenic temperature, the RE is treated as 100%.11,12 This assumption of ηRE = 1 is experimentally verified by observing that the peak EQEs at the lowest and the next lowest cryogenic temperatures do not increase anymore and maintain the maximum value. When the RE is 100%, the EQE is linearly proportional to the IE. As a result, the IE is the highest at the peak of the EQE. In general, the IE is also taken as 100% if the peak value of the EQE does not vary with current for a limited range. After finding the reference point where ηIQE = 1, i.e., ηRE = ηIE = 1, the IQEs at other operating conditions are determined by taking the ratio as shown below:
![Equation ([18])](https://content.cld.iop.org/journals/2162-8777/9/1/015013/revision1/d0018.gif)
For this reason, the TDEL can also be called the low-temperature reference-point method (LTRM): its reference point is selected so that ηIQE = 1 considering that the peak EQE value is saturated with cryogenic temperatures and currents.
Although the TDEL is a generally accepted method of measuring the IQE as a function of current only from the experimental EQE curves measured at different temperatures ranging from room to cryogenic, it is very time- and labor-consuming. Cooling down to cryogenic temperatures as low as 25 K takes several hours using a helium closed-cycle system. Including preparation and actual measurements, the total testing would take a few hours. Moreover, one should be careful of the fundamental assumptions used in the TDEL that the LEE is independent of temperature from room to cryogenic. Sometimes, the LEE seems very dependent on temperature especially for narrow-bandgap semiconductors such as GaAs- or InP-based material systems. For these reasons, the TDEL is more suitable for academia rather than industry. Thus, there exist definite needs for a method that can measure the IQE just at room temperature.
RTRM
The simplest and the most popular method of the IQE measurement satisfying all conditions of (i)–(iv) mentioned previously is the constant ABC-model.13–15 The model is based on the carrier rate equation for the LED (thus the name "ABC-model"). Assumptions behind this model are as follows: (1) All carriers are injected into the active layers and recombine there. Thus, the IE is implicitly assumed as 100% with a well-defined active volume. In this case, the IQE becomes identical to the RE. (2) Nonequilibrium concentrations of electrons and holes in the active layers are nearly equal to each other. (3) Three recombination processes, i.e., the nonradiative SRH, radiative band-to-band, and nonradiative Auger recombinations, are considered and their recombination rates are expressed with the recombination coefficients A, B, and C, respectively, and the carrier concentration n. Note that the A, B, and C coefficients are considered as certain constants. (4) Again, the LEE is independent of the injection current. Thus, the IQE has the same shape as the EQE as a function of current.
There have been many different reports on the procedures of fitting the experimental EQE curves around the maximum EQE using constant recombination coefficients A, B, and C.13 However, the curve fitting based on the ABC-model often shows significant deviation from the measured EQE at low and/or high currents away from the maximum EQE.16,17 We believe that these discrepancies mainly result from the assumption of ηIE = 1 and the constancy of the recombination coefficients A, B, and C for the entire current range.18,19
Recently, we have proposed a LED IQE measurement method as a function of current at a fixed operating temperature without assuming ηIE = 1 and the constancy of the recombination coefficients for a wide current range, different from the conventional ABC-model. This approach is called the RTRM.20,21 This improved model includes the following elements: (1) The recombination coefficients A, B, and C are not constant but depends on the carrier concentration n. (2) The nonradiative Auger recombination is negligibly small at low currents far from the peak EQE current, Ipeak. In this current range, the AB-model instead of the ABC-model is possible. (3) The IE is a function of current I or carrier concentration n so that there is a certain current, called the reference current Iref, where the IE is maximized. (4) The LEE is assumed as a constant so that the shape of an experimentally observed EQE curve is the same as that of the IQE curve. Thus, the IQE dependence on current can be obtained once an IQE value is exactly known at the reference current Iref. This approach is very similar to the TDEL where operating conditions of cryogenic temperature and current are searched for the IQE that can be assumed as 100%. 5 Finally, the IE at Iref is considered as high as 100% if any special attention is not required.
Figure 4 shows the illustration for measuring the IQEs following the proposed RTRM. The proposed IQE measurement procedure is similar to the TDEL in that the IQEs at other operating points are obtained by relatively comparing the EQE to the one at the reference point where ηIQE,ref is exactly known. Unlike the TDEL, however, a reference point satisfying ηRE = ηIE = 1 cannot be sought because the experimental temperature is not cryogenic but a higher operating temperature. Thus, it is necessary to develop a unique strategy to overcome such a hurdle. In the RTRM, the reference current Iref at which the IE is considered as 100% is first selected. Then, the RE at Iref is calculated by using the experimental EQE curve normalized at the peak EQE value. This makes it possible to find an exact IQE value at the reference current, i.e., ηIQE, ref = ηIQE(Iref) = ηRE(Iref). Once we know ηIQE,ref, we can calculate ηIQE(I) at any other current I from
![Equation ([19])](https://content.cld.iop.org/journals/2162-8777/9/1/015013/revision1/d0019.gif)

Figure 4. The calculation procedure from a relative EQE curve to an IQE curve following the RTRM.
The theoretical background and the experimental accuracy of the RTRM is described in detail in Refs. 20 and 21.
The AE: Interrelation between the IQE and the Forward Voltage
Although the performance of InGaN-based LEDs have improved significantly, a higher PE is still desired. Improving the PE of a LED requires enhancing the EQE and reducing the forward voltage (or increasing the VE) simultaneously. While it has been recognized experimentally that both the EQE and the forward voltage are interactively dependent on epitaxial growth conditions in some cases, they have so far been studied independently as the so-called efficiency droop and the ohmic problem.
To have a higher EQE, one needs to optimize the epitaxial layer structure, especially the active layers. However, the variation in LEE can mask the actual changes in active layers and confuses the trends in EQE experiments. In order to avoid the confusion caused by the LEE variation and focus only on the active-layer properties, one needs to use the IQE, not the EQE. At the same time, the changes in forward voltage with epitaxial-structure modifications should also be tracked.
The forward voltage VF supplied by the power source is equal to the sum of the voltage drops outside and inside the active region. Each voltage drop occurs in transport and recombination processes of carriers.22,23 In order to improve VF, researches have so far focused on the reduction of the ohmic potential drop during the carrier transport outside the active region.24,25 On the other hand, the relationship between the voltage at an operating current density and the recombination mechanism has not yet been thoroughly investigated.
In a strict sense, two parameters of the IQE and the VE are related to the carrier recombination processes in the LED. Electrons and holes have different spatial carrier injection and recombination rates and therefore do not distribute equally and/or uniformly around the active region. An internal electric field due to such built-in spatial charges can influence the forward voltage additionally. In order to quantify both the IQE and VF as the active-layer characteristics, a new performance parameter of the AE can be used as defined in Eq. 12. The AE is a more informative parameter than the IQE, the EQE, or the VE in view of evaluating the active-layer quality.
Thirty-one InGaN/GaN MQW blue LEDs, which had the identical structures except slightly different growth conditions for the active layers, were tested to confirm the interrelation between the IQE and VF. All chips had the same device geometry (960 × 620 μm2 in size) subjected to the identical fabrication processes. The LEDs were driven under pulsed-current condition (pulse period: 1 ms, duty cycle: 1%) and their IQEs were obtained by the RTRM.20,21
Figure 5 shows the distribution of IQEs and VF's at 25 A/cm2 as a target operating current density for the 31 blue LEDs. An overall trend that VF decreases as the IQE increases is observed. Dashed lines represent constant AE values and provide criteria for the active-layer quality. Over a constant AE line, the IQE and VF increase or decrease simultaneously, i.e., the IQE and the VE show a trade-off relationship. In the case of an increasing AE, the IQE increases and VF decreases so that the PE can be further improved, which is the direction the optimization of the epitaxial-layer growth should follow. Since all samples went through identical fabrication processes except for active-layer growth conditions, it is reasonable to infer that the variations in VF and IQE are caused by the carrier recombination processes rather than the transport factors such as the current spreading, ohmic contact, and series resistance.
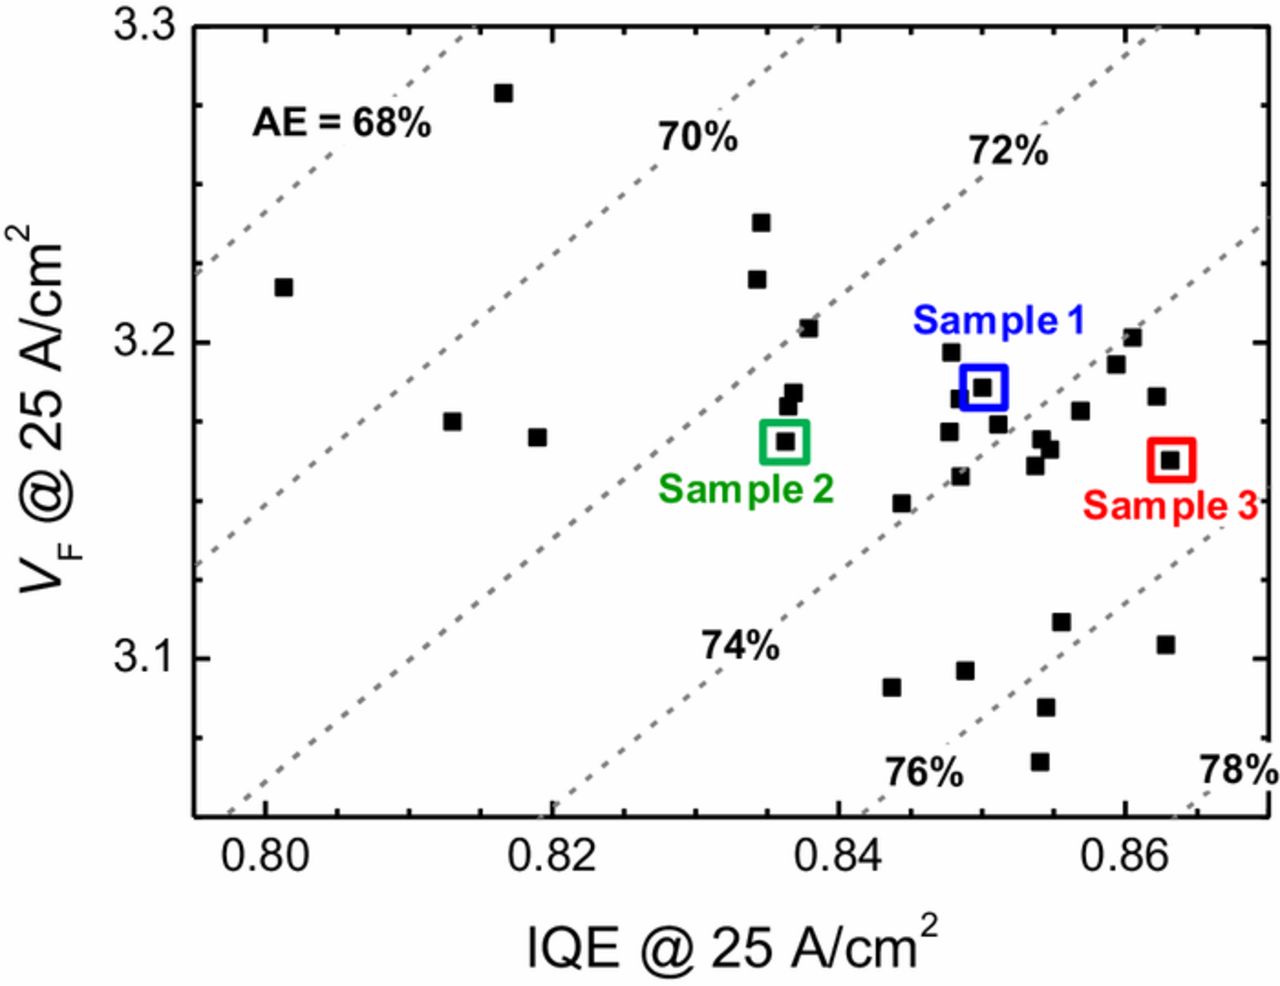
Figure 5. Distribution of the IQEs and VF's for 31 InGaN/GaN blue LEDs. Dashed lines represent constant AE values. Three samples are selected and compared in detail.
The total carrier recombination rate, Rtotal, is the sum of the radiative recombination rate, Rrad, and the nonradiative recombination rate, Rnonrad, i.e., Rtotal = Rrad +Rnonrad. The radiative recombination takes place inside the MQW active layers but the nonradiative recombination rate can occur both inside and outside the active layers. Thus, Rnonrad is the sum of the nonradiative recombination rate in the MQW active layers (Rnonrad,MQW) and the same in the clad layers (Rnonrad,clad), i.e., Rnonrad = Rnonrad,MQW + Rnonrad,clad. While Rnonrad,clad due to the carrier overflow is dominant above the peak IQE, the dominant recombination mechanism for Rnonrad,MQW is still controversial as the SRH recombination below the IQE peak and the Auger recombination above the IQE peak are debated.
The IQE can also be represented by the ratio of recombination rates as shown below:
![Equation ([20])](https://content.cld.iop.org/journals/2162-8777/9/1/015013/revision1/d0020.gif)
On the other hand, the forward voltage in the I-V curve limited by the carrier recombination rate is inversely proportional to the total carrier recombination rate:
![Equation ([21])](https://content.cld.iop.org/journals/2162-8777/9/1/015013/revision1/d0021.gif)
As the IQE and VF are interrelated through the carrier recombination processes, it is necessary to examine both characteristics in order to identify the carrier recombination processes. Moreover, separating the radiative current using Eq. 15 and the nonradiative current using Eq. 16 depending on the applied voltage can be utilized as a useful tool to quantify the carrier recombination mechanisms in the MQWs and also in the cladding layers.
In order to analyze the carrier recombination mechanisms for the cases of constant and different AEs, three samples (samples 1, 2, 3) are selected. In the case of sample 1 and sample 2, which represents the case of a similar AE, sample 2 has both smaller IQE and VF at 25 A/cm2. On the other hand, in the case of sample 1 and sample 3, which is the case of an increasing AE, sample 3 has a larger IQE and a smaller VF.
Figures 6a and 6b compare the IQE vs. the current density JF (IQE-JF) and JF vs. the forward voltage (JF-V) for samples 1 and 2 (case of a similar AE), respectively. First, when comparing samples 1 and 2, the IQE characteristics in Fig. 6a are different while the voltage characteristics in Fig. 6b are almost similar. Sample 2 has a larger peak IQE value than sample 1, but the IQE reduction at high currents, i.e. the IQE droop is much larger. As a result, the IQE at 25 A/cm2 becomes smaller. Figs. 6c and 6d show the radiative and nonradiative currents as a function of voltage. It can be seen that the radiative current characteristics are nearly the same, but the nonradiative current characteristics are much different between the two samples. Therefore, it is understood that different IQE and VF characteristics between samples 1 and 2 are mainly caused by the difference in the nonradiative recombination rate, not the radiative recombination rate. Recall that Rnonrad can be separated into Rnonrad,MQW and Rnonrad,clad. It is noted that Rnonrad,MQW is dominated by the SRH recombination in MQW layers below the peak IQE. Compared to sample 1, sample 2 shows a higher IQE peak value than sample 1, which means less amount of SRH recombination via defects in sample 2. Since the radiative recombination rates are almost the same beyond the current at the IQE peak, the decrease of the IQE at high currents, called the IQE droop, is due to the rapid increase of the nonradiative recombination rate Rnonrad inside or outside the MQW layers.
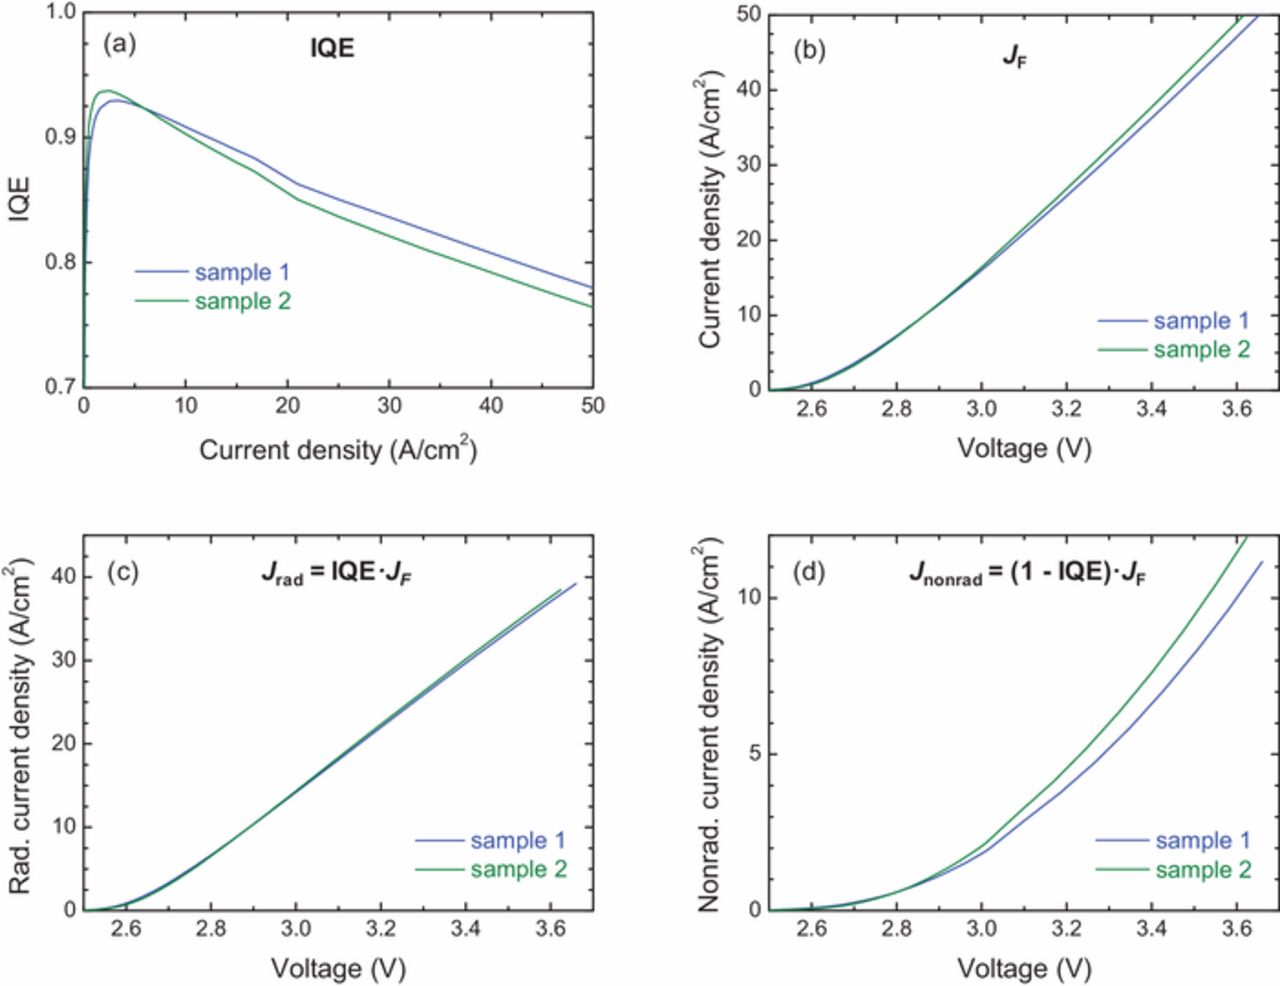
Figure 6. Comparisons of optoelectronic characteristics between sample 1 and sample 2: (a) IQE-current density (JF), (b) JF-voltage, (c) radiative current density (Jrad)-voltage, and (d) nonradiative current density (Jnonrad)-voltage.
Figure 7 compares the IQE-JF-V curves for samples 1 and 3 (case of an increasing AE). Sample 3 shows better characteristics both in IQE and VF as shown in Figs. 7a and 7b, respectively. Roughly speaking, sample 3 and 1 show similar performances of the IQE and VF up to the peak IQE current, but sample 3 outperforms sample 1 above the peak IQE current. Fig. 7c reveals that sample 3 has much larger Jrad (Rrad) than sample 1 above the voltage at the peak IQE. In Fig. 7d, it is seen that sample 3 has smaller Jnonrad (Rnonrad,MQW) below the voltage at the peak IQE and larger Jnonrad (Rnonrad,clad) above the voltage at the peak IQE. However, the difference in Jrad is much larger than that in Jnonrad. Consequently, in the case of an increasing AE, the peak IQE, IQE droop, and VF characteristics are determined dominantly by Rrad rather than Rnonrad. It should be noted from the comparative analyses of samples 1, 2, and 3 that the radiative and nonradiative recombination rates should be considered separately in order to understand both the IQE droop and VF characteristics.
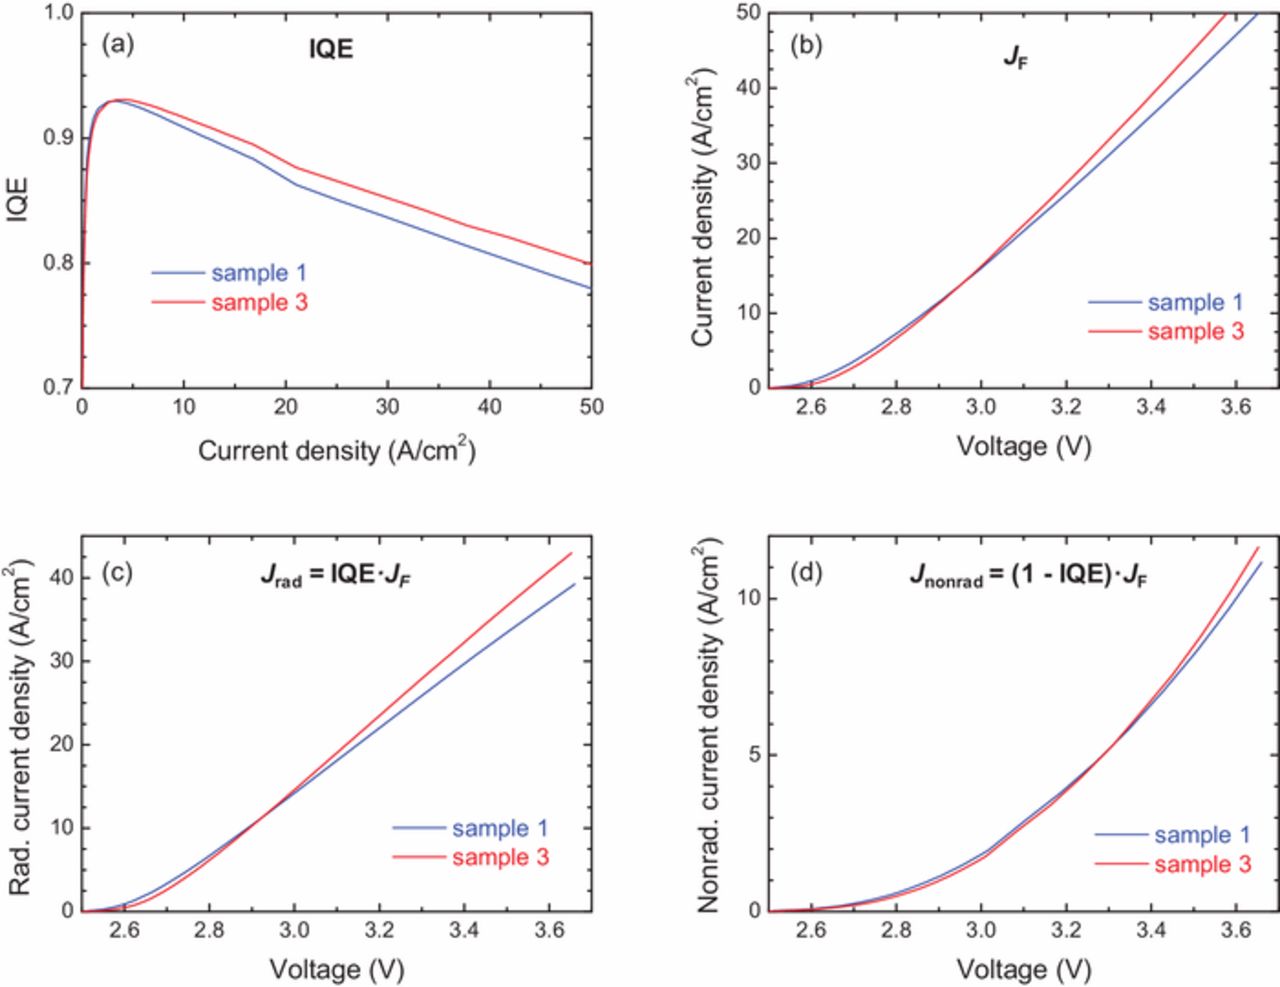
Figure 7. Comparisons of optoelectronic characteristics between sample 1 and sample 3: (a) IQE-JF, (b) JF-voltage, (c) Jrad-voltage, and (d) Jnonrad-voltage.
Origin of the IQE Droop and the VE
A major challenge for III-nitride LEDs is delivering the highest efficiency performance at the current density and temperature relevant to the operation. The IQE, a measure of how many electrons are converted to photons, typically shows a maximum at a low injection current density and then decreases as the current density is increased further (efficiency or IQE droop). InGaN-based LEDs operating at blue-green wavelengths typically suffer from significant amounts of efficiency droop. The droop is currently a limiting factor to more efficient LEDs under high current densities.
The IQE can be written as the ratio of the radiative recombination current Irad in the active region to the injection current IF, which consists of the radiative recombination and the nonradiative recombination currents, as shown in Eq. 14. At room temperature, electrons and holes in the active region can be considered as free carriers and they recombine radiatively according to the Fermi's golden rule. We know from Eq. 14 that the IQE droop happens only when Inonrad increases faster than Irad with increasing total current IF. This is the reason why the nonradiative recombination processes have received much attention as origins of the IQE droop. Many possible nonradiative recombination mechanisms have been proposed to explain the efficiency droop, including the carrier overflow enhanced by the internal polarization field, carrier delocalization from indium-rich regions and subsequent nonradiative recombination at high defect sites, and the Auger recombination in the active region. These IQE droop explanations are based on additional increase in nonradiative recombination rates with increasing current densities. Nevertheless, a consensus on the mechanism behind the IQE droop remains elusive because the proposed nonradiative mechanism alone cannot explain all the experimental droop phenomena comprehensively and consistently.
The Auger recombination is a typical nonradiative recombination mechanism at high carrier concentration. Nonradiative electron-hole recombination processes transfer the excess electron energy to other particles except photons. In case of the direct Auger recombination, these other particles are electrons or holes that are excited into higher energy levels within the same band. The theoretical probability of this Auger process decreases exponentially with increasing bandgap energy Eg and decreasing operating temperature T, i.e., C∝exp ( − Eg/kBT), where C is the Auger recombination coefficient and kB is the Boltzmann constant. Therefore, the importance of the Auger recombination in III-nitride semiconductors has been in doubt for a long time. However, similar efficiency droop curves in the resonant photoluminescence (PL) and EL experiments invoked the Auger process as the dominant nonradiative mechanism leading to the efficiency loss at high carrier concentrations. Efforts to verify the Auger recombination have been carried out both theoretically and experimentally.
The influence of the Auger recombination is typically estimated by using the constant ABC-model in the semiconductor carrier rate equation. Reported Auger recombination coefficients at room temperature in InGaN-based LEDs range from 3.5 × 10⁻³¹ to 3.2 × 10⁻²⁹ cm6/s. These experimental values are generally larger compared to the theoretical values of ∼10−34 – 10−30 cm6/s. In fact, it is not easy to obtain the exact values of these A, B, and C parameters simultaneously by only one fitting process. Thus, most works fit the A and B coefficients in the low current regime and the C coefficient in the high current regime. It should be noted that all these works neglect the influence of the carrier leakage, i.e., the IE is considered as unity. However, it seems that many carriers overflow without recombining at the active MQWs even in the resonant PL experiments.26
On the other hand, as discussed in the previous section, comparative studies of the AE have shown that the difference in the IQE droop cannot be explained by different nonradiative recombination rates alone. To identify the origin of the IQE droop, it is essential to consider both the radiative and nonradiative recombination processes separately at the same time. Recently, the saturation of the radiative recombination rate and subsequent increase of the nonradiative recombination rate have been proposed by us in order to explain the IQE droop phenomena more comprehensively including their temperature dependences.27 We have also reported a phenomenon of decreasing open-circuit voltage when the incident optical power increases at cryogenic temperatures when the LED is operated as a solar cell. The behavior of the open-circuit voltage with temperature is quite similar to that of the IQE and can only be explained by the carrier overflow.
As we know from Eq. 14, the IQE droop at a certain temperature can happen if the nonradiative recombination rate increases faster than the radiative recombination rate or the radiative recombination rate increases slower than the nonradiative recombination rate. As a concept for an origin of the IQE droop, the former is different from the latter in the following sense. The former emphasizes additional increase in the nonradiative recombination rate without taking into account the changing rate of the radiative recombination. On the other hand, the latter supposes the saturation in the radiative recombination rate at high carrier concentrations as a trigger for the IQE droop: the saturation in the radiative recombination rate accelerates an additional increase in the nonradiative recombination rate. In the former case, for reducing the IQE droop, we need to identify important nonradiative recombination processes and eliminate them in the first place. In the latter case, however, we need to increase the radiative recombination rate without its saturation up to high current densities. Thus, it is essential to clarify which concept is more suitable to understanding the LED efficiency comprehensively. Figure 8 summarizes the consequence of the saturated radiative recombination rate. As the carriers accumulate due to the saturated radiative recombination rate, the nonradiative recombination is induced more severely, manifesting as the efficiency droop and the forward-voltage increase. Based on this model, the IQE and voltage characteristics of samples 1, 2, and 3 are described again.

Figure 8. Schematic diagram explaining the IQE droop with increasing current. As the radiative recombination rate at the active MQWs begins to saturate, carriers rapidly accumulate even at small currents. As the current increases further, the nonradiative recombination rate increases faster than the radiative recombination rate, due to the carrier overflow from the active layers to the clad layers.
Samples 1 and 2 in Fig. 6 have nearly the same active-layer structure except the slightly different defect density in the MQW active layers. This is the former case of eliminating the nonradiative defect centers rather than increasing the radiative recombination rate in the first place. The radiative recombination rates of the two samples are the same, i.e., Rrad,1 = Rrad,2, but the SRH recombination rate via defects are slightly different. Considering that the SRH recombination dominantly appears at small carrier concentrations in the active layers, it is expected that the active layers of sample 2 are less defective than those of sample 1 (thus the IQE peak value of sample 2 is higher than that of sample 1), i.e., Rnonrad,QW,1 > Rnonrad,QW,2. Consequently, the total recombination rate in the active layers of sample 2 is smaller than that of sample 1, i.e., Rrad,1 + Rnonrad,QW,1 > Rrad,2 + Rnonrad,QW,2. For both samples at current levels below the peak IQEs, currents are totally injected into the MQW active layers and therein the carriers recombine. Thus, the characteristics of the IQE, VF, Irad, and Inonrad become almost the same for the two samples. When the current level increases above the peak IQE, sample 2 has less total recombination rate in the active layers, resulting in higher carrier overflow to the clad layers with additional nonradiative recombination volume, larger IQE droop, and smaller forward voltage.
The samples 1 and 3 in Fig. 7 have nearly the same defect levels but different radiative recombination probabilities in the MQW active layers. This is the latter case of increasing the radiative recombination rate rather than eliminating the nonradiative defect centers. Sample 3 was prepared to have an active MQW structure in which the radiative recombination rate is less saturated even at a higher carrier concentration than that of sample 2. On the other hand, the peak values of the IQE for the two samples are almost the same, so it can be thought that their SRH recombination rates are almost the same. For both samples at current levels below the peak IQEs, currents are totally injected into the MQW active layers and carriers recombine there with almost the same radiative and nonradiative recombination rates. Thus, characteristics of the IQE, VF, Irad, and Inonrad become almost the same for the two samples. In sample 3, as the total current increases beyond the IQE peak, the radiative recombination rate is less saturated, resulting in the carrier overflow causing the nonradiative recombination reduced and the IQE droop ultimately reduced.
We have observed that a saturation of the radiative recombination rate via phase-space filling can indeed occur, which triggers the carrier overflow as a nonradiative recombination mechanism. Since high carrier concentrations induce the phase-space filling, it is necessary to increase the effective active volume to reduce the efficiency droop in InGaN LEDs. It is known that such factors as the piezoelectric field, asymmetric carrier distribution, and indium fluctuation affect the effective active volume of the InGaN LEDs. Thus, it is imperative to alleviate those factors to overcome the efficiency droop. In most LEDs made of III-V compound semiconductors, the onset current and the rate of efficiency droop as functions of operating temperature and current can be explained very consistently and comprehensively in terms of saturation characteristics of the radiative recombination rate inside the active MQWs. The saturated radiative recombination rate triggers the rapid increase of the nonradiative recombination rate mainly outside the active MQWs.
Conclusions
Almost 60 years have passed since the birth of semiconductor LEDs in the early 1960s, but it is surprising that very few technical documents are found on various LED efficiencies in terms of definitions, terminologies, and measurement methods. In this paper, we have introduced the definitions and interrelations of various LED efficiencies such as the PE, the VE, the EQE, the LEE, and the IQE. Next, we have examined how various efficiencies can be measured quantitatively and individually by using simple experimental data of the radiant power, current, voltage, and spectrum.
As a key to separating various efficiencies, we have reviewed two IQE measurement methods, namely, the TDEL and the RTRM. Both methods require only experimental data without assuming any physical parameters. The TDEL utilizes the experimental EQE curves measured at various temperatures from room to cryogenic, which takes very long time for sample preparation and measurements. To overcome technical hurdles of the TDEL, we have developed a simple and unique IQE measurement method called the RTRM that can measure the IQE from the EQE data just at room temperature.
The RTRM was applied on InGaN/GaN blue LED samples with slightly different growth conditions for the active layers, and the relationship between the IQE and the VE (or forward voltage VF) was investigated. We could find a close relationship between the IQE and the VE through the common carrier recombination processes, and the AE defined as the product of the IQE and the VE turned out to be a useful and comprehensive parameter for quantifying the active-layer quality.
By expressing the injected current as the sum of the components contributing to the radiative recombination and the nonradiative recombination, we have investigated how the AE varies with the quality of the active layer. When only the nonradiative recombination decreases, the AE cannot be improved significantly. Using a model that the behavior of the LED at increasing currents involves the saturation of the radiative recombination rate, we have explained the IQE droop, the forward-voltage increase, and the AE constancy with the reduction of the nonradiative recombination only. The analyses given in this study emphasize the importance of increasing the radiative recombination rate in order to improve the LED performance further. Decreasing the nonradiative recombination rate alone is not sufficient to improve the overall performance of the AE or the PE.
Acknowledgments
This work was supported by the Technology Innovation Program funded by the Ministry of Trade, Industry and Energy, Republic of Korea, under Grant 20006908.
ORCID
Jong-In Shim 0000-0002-1305-074X
Dong-Soo Shin 0000-0002-0863-9138