Abstract
The design and fabrication of durable nanocatalysts to efficiently and selectively electro-oxidize organic molecules toward value-added product(s) is an important starting point for the future deployment of electrochemical "cogeneration" devices with the triple advantage of producing electricity, heat and fuels/chemicals. This interdisciplinary research requires a synergistic effort from three communities of electrochemistry/electrocatalysis, material science and organic chemistry. To this end, we chose to explore the integration of different electrochemical and analytical techniques to study the outstanding ability of gold-based nanomaterials in the electrocatalytic oxidation of mono- and di-saccharides. In order to rationalize the previous outcomes on the selective catalysts for glucose-to-gluconate conversion toward cogenerating organic electrosynthesis (ECS Trans., 77, 1547 (2017)), a multivariate study is carried out in alkaline and neutral pHs by examining three substrates, glucose, galactose, lactose and different electrodes. Electroanalytical investigation revealed that these substrates are selectively oxidized at their C1-position (two transferred electrons). At pH 7.4, the corresponding lactone and acid forms were detected by their specific vibration bands of 1744 and 1780 cm−1, which is explained by a local pH decrease within the thin-electrolyte. Our study delineates a broad strategy for organic electrosynthesis in electrochemical cells by controlling electrode materials fabrication.
Export citation and abstract BibTeX RIS

This is an open access article distributed under the terms of the Creative Commons Attribution Non-Commercial No Derivatives 4.0 License (CC BY-NC-ND, http://creativecommons.org/licenses/by-nc-nd/4.0/), which permits non-commercial reuse, distribution, and reproduction in any medium, provided the original work is not changed in any way and is properly cited. For permission for commercial reuse, please email: oa@electrochem.org.
Electrocatalysis plays a central role in chemical science by enabling the conversion of chemical energy (ΔreactionG, kJ mol−1) into electrical energy (Ecell, V) and vice versa. Carbon-based fuels can be used in fuel cells (FCs)1–6 for the production of electricity – despite their relatively low gravimetric energy density compared to molecular hydrogen, 33 kWh kg−1 vs. 1–9 kWh kg−1 – or in electrolysis cells (ECs)7–11 for the production of fuels and/or chemicals. For FCs, the main selection criterion for the design and fabrication of electrode materials is the electrooxidation with the lowest overpotential, i.e., at low electrode potentials (E), ideally E < 0.7 V vs. reversible hydrogen electrode (RHE). For ECs, the condition switches toward the best reaction selectivity either at low or high electrode potentials. New type of devices so-called "co-generation or co-production" FCs arise from the possibility of reaching efficiently and simultaneously these two goals.8,9,11–15 For instance, the current platforms for H2 production are largely based on fossil fuels (steam methane reforming, coal gasification), and lead to the emission of significant quantities of greenhouse gases (CO2 and other carbon-based species in addition to the need of high temperatures), which apparently violates our original intention of reducing global warming by the employment of H2 power.16 Besides, the organic electrosynthesis is expected to replace, somehow, toxic or hazardous reagents, avoid large quantities of stoichiometric oxidizers and reducers as well as the in situ production of unstable and/or hazardous chemicals, which means that the waste originating from the used reagents is almost negligible.12,17,18 Therefore, seeking a clean, renewable and efficient strategy for electricity and fuels/chemicals production is needed.
The electrochemical water splitting involving two half-reactions (hydrogen evolution reaction (HER) and water oxidation, referred to as oxygen evolution reaction (OER)) is proposed as one of the sustainable H2 production sources.19 However, the implementation is facing several fundamental and technological challenges, one of which is the efficient design of the anode catalytic materials exhibiting durable activity. Owing to their low oxidation potential compared to H2O, the efficiency of ECs can be much improved by oxidizing an organic compound at the anode in lieu of water molecules.7,12 Indeed, a large cell voltage of ca. 2 V is needed to achieve a current density of ∼100 A dm−2, which leads to a consumed electric energy of ∼5 kWh (Nm3H2)−1 Refs. 7, 12. At the same time, an alcohol instead of water as reactant for the oxidation reaction needs a voltage below 1 V and an electric energy lower than 3 kWh (Nm3H2)−1 Refs. 7, 12, that is roughly 50% energy saving. Up to now, the majority of electrolysis occurs in acidic media and needs precious and expensive metals (IrO2, RuO2, Pt), and only a few attempts have been dedicated to solid alkaline membrane electrolysis cells (SAMECs) for organics oxidation at the anode.7–11 Thus, an advanced electrode material for the selective oxidation of organics in an EC enables recovering a value-added product, enabling to cut down the overall H2 production cost. Furthermore, the production of chemicals from pristine abundant organics (known as organic electrosynthesis) could also become an excellent idea to avoid excessive CO2 emissions.13–15,20,21 Abundant, renewable, and nontoxic, carbohydrates with potentially high energy density (4.35 kWh kg−1 for glucose)6 represent a class of compounds that have received tremendous interests in electrocatalysis owing to the fact that these carbohydrates and cellulose/hemicellulose represent up to 70% of the biomass, an extensive and endlessly renewable resource.13 For instance, gluconic acid from the selective glucose oxidation in a two-electron process is a mild organic acid that has received great interest in various fields such as food, pharmaceutical, and cosmetic industries.13,22,23
Seminal investigations in electrocatalysis showed that the alkaline medium is the environment of choice for mono- and polyhydric alcohols electrooxidation.24–27 Hence, performing selectively these reactions in order to produce chemicals of interests within a cogeneration configuration is an excellent tool to cut down the H2 production cost. However, the experimental screening showed that the reactions are a combination of multi-electron and multi-proton processes involving many reaction intermediates and reaction barriers,28 which make the electrochemical kinetics inherently slow, compared to hydrogen oxidation within a H2/O2 fuel cell. Then, various tactics for the increase in catalytic activity of the electrode materials have been investigated, one of which is the alloying of at least two metals to enable the: (i) modification of the electronic properties of the surface resulting in changes of the adsorption properties; (ii) increased surface concentration of adsorbed oxygen containing species involved in the oxidation of organic substances; (iii) dissociation of the C–H and further C–C bonds with minimal driving force (i.e. with the smallest overpotential); (iv) suppression of the formation of strongly adsorbed intermediate species.12,25
We reported the use of "Bromide Anion Exchange" (BAE) method,29–31 a surfactant-free approach, to develop a line-up of Au-Pd-Pt nanocatalysts able to oxidize efficiently glucose at low electrode potentials at various pHs.32–34 It was also shown that monometallic Au enables a selective oxidation of a range of carbohydrates by their anomeric position and even in a cogeneration fuel cell;13,35 however, it was postulated that the selectivity remained limited to Au that exhibits remarkable catalytic activity36–38 toward aldehydes and hemiacetals oxidation. Herein, we examine the extended analysis on Au100-xMx (M = Pd, Pt) catalysts by coupling electrochemical techniques with spectroscopic and chromatographic methods to unravel the outstanding ability of these electrocatalysts, enabling the acquisition of clear and precise information on the electrocatalytic reaction. Indeed, pure electrochemical methods do not provide any specific information on the products and/or intermediates of the oxidation reaction without combining with analytical techniques.39,40 Our investigation conclusively states that the electrooxidation remains exclusively limited to the anomeric position of each substrate, thus underpinning the conclusion that electrochemistry can be employed for a co-generative organic electrosynthesis.
Experimental
Chemicals and materials
Potassium tetrachloropalladate (II) (K2PdCl4, 99%) was provided by Alfa Aesar. Hexachloroplatinic (IV) acid hexahydrate (H2PtCl6·6H2O, ≥37.50% Pt basis), hydrogen tetrachloroaurate trihydrate (HAuCl4·3H2O, ≥99.9%), sodium borohydride (NaBH4, 99%), L-ascorbic acid (AA, ≥99%), potassium bromide (KBr, ≥99%), Nafion suspension (5 wt% in aliphatic alcohols), sodium hydroxide (NaOH, 97%), sodium phosphate dibasic dihydrate (Na2HPO4·2H2O), sodium phosphate monobasic monohydrate (NaH2PO4·H2O), D-(+)-glucose (99.5%), D-(+)-galactose (≥99%), were purchased from Sigma-Aldrich. Lactose monohydrate (analytical reagent grade) was purchased from Fisher. These chemicals were used without further purification. Prior its use, Vulcan XC 72R carbon black (from Cabot) was thermally pretreated at 400°C under nitrogen (N2) atmosphere as described elsewhere.41 The anion exchange membrane (AEM) was purchased from Fumatech (Fumasep FAA) and activated by soaking in 0.1 M NaOH overnight (2 h in 1 M NaOH is fine). Carbon Paper (Spectracarb 2050L-1050) was purchased from Fuel Cell Store. The phosphate buffer solution, PBS (0.2 M, pH 7.4), was prepared from Na2HPO4·2H2O and NaH2PO4·H2O solutions (0.2 M). All the solutions were prepared with ultrapure water (Milli-Q Millipore, 18.2 MΩ cm at 20°C) and outgassed by bubbling N2 prior to electrochemical measurements.
Preparation of the nanomaterials from the BAE method
Au-Pt-Pd/C nanomaterials were synthesized according to the BAE procedure for the nanocatalysts preparation, described in previous reports.31,32 The method consists of the reduction of the metallic precursor(s) in aqueous solution in the presence of bromide ion as a size and morphology regulator. In a typically synthesis of AuxPtyPdz nanoparticles (where x, y and z are the corresponding atomic percentages) supported on Vulcan XC 72R, HAuCl4·3H2O, H2PtCl6·6H2O and K2PdCl4 as metal precursors and taken in the proportions corresponding to the desired atomic composition of the nanoparticles (total metal weight of 20 mg) are dissolved in MQ water (100 mL, 25°C). Then, KBr was added to the solution (ϕ = n(KBr)/n(metals) = 1.5) under vigorous stirring. After complete solution homogenization, 80 mg Vulcan was added under constant ultrasonic homogenization for 45 min. Then, a freshly prepared reducing agent aqueous solution was added dropwise to reduce AuCl4−, PtCl62− and PdCl42− species to Au, Pt and Pd. Specifically, NaBH4 (0.1 mol L−1, n(NaBH4)/n(metals) = 15) was used for Au-Pt/C and AA (0.1 mol L−1, n(AA)/n(metals) = 7) for Au-Pd/C in order to avoid hydrogen (present in NaBH4) insertion into the palladium lattice. After 2 hours of operation at 40°C under vigorous stirring, the materials are filtered, rinsed several times with ultrapure water and dried in an oven at 40°C for 12 h. The extensive physicochemical characterization of these Au-Pd and Au-Pt binaries are reported in Ref. 32.
Catalytic ink preparation
The catalyst ink was prepared by mixing 375 μL MQ water and 50 μL Nafion suspension in a water ultrasonic bath. Then, 4 mg of catalyst powder was added to obtain a homogeneous ink to be coated on different supports for electrochemical tests.
Cyclic voltammetry (CV) measurements
The tests were performed in a conventional three-electrode cell using a potentiostat EG&G PARC Model 362 (Princeton Applied Research). The reference electrode was a daily-made RHE, separated from the solution by a Luggin capillary and a slab of GC (6.48 cm2) acts as a counter electrode. The working electrode consisted of either 3 μL catalyst ink deposited onto a well-polished glassy carbon disk (GC, 0.071 cm2, 80 μgmetal cm−2)32 or an optimized 2 × 20 μL ink onto carbon fiber (CF42,43, 2 × 1 cm2, 38 μgmetal cm−2). The entire tests were conducted at controlled temperature, from 5 to 40°C.
Spectroelectrochemical measurements
In situ Fourier transform infrared spectroscopy (FTIRS) measurements were performed with a homemade three-electrode electrochemical cell where a slab of GC and RHE act as counter and reference electrodes, respectively. The working electrode consisted of 3 μL of catalyst ink deposited onto a GC disk of 8 mm diameter. The amount of Nafion in the ink was halved and a small amount of ink was deposited to reduce the interference with the IR beam. Excellent reflectivity was obtained by pressing the working electrode against a CaF2 window to obtain a thin layer of electrolytic solution. The coupling of CV to FTIRS (CV-FTIRS) known as "single potential alteration infrared spectra, SPAIRS" consists in recording the electrode reflectivity REi at different potentials Ei in steps of 0.05 V at a quasi-steady-state scan rate of 1 mV s−1. The coupling of chronoamperometry (CA) to FTIRS (CA-FTIRS) relies on a spectrum acquisition every Δt = 3 min at a fixed electrode potential. A setup of the μ-AUTOLAB Type III (Metrohm Autolab BV, Netherlands) potentiostat was used for electrochemistry and OPUS software (Bruker) was used for IR spectroscopy by using a Bruker IFS 66v spectrometer as described elsewhere.44,45
Electrolysis, chromatographic and spectrometric analyses
Bulk solution electrolysis was performed at different electrode potentials (from 0.2 to 0.8 V vs. RHE, EG&G PARC Model 362 potentiostat) by using a Pyrex H-type cell separated with the AEM to prevent the contents mixing and to provide the current relay through ion exchange between both compartments. The auxiliary electrode (GC, 22 cm2) compartment contained the electrolyte and the working electrode (Carbon Paper coated with the catalytic ink: 2 × 4 cm2, 24 μgmetal cm−2) compartment is filled with 43 mL of the substrate (glucose, galactose, lactose) solution, which is gently stirred during electrolysis by a bar magnet. The sampling was obtained by high-performance liquid ionic chromatography (HPLIC, Dionex) in gradient elution with a conductivity detector (elution by conductivity strength) and an amperometric detector (allows in situ electrolysis for qualitative and quantitative analyses). The HPLIC included an AS50 autosampler and a 2 × 250 mm column (IonPac AS15), operating at 30°C. A constant flow of eluent (0.3 mL min−1 at pressure of ∼1500 psi) is provided by a pump (ICS-5000 P).
Results and Discussion
Spectroelectrochemical investigations
Since the CFs support cannot be used for spectroelectrochemical analysis, the catalytic ink was coated onto a vitreous GC for in situ FTIRS experiments, firstly in 0.1 M NaOH and secondly in PBS (0.2 M, pH 7.4). Figure 1a displays the chemical structures of the predominant forms in an alkaline solution (25°C) of glucose, galactose, lactose and the potential reaction products. Please, note that the structure of galactonate is similar to glucose, except the spatial position of –OH at C4-position. Before running spectroelectrochemical analysis, i.e., coupling in situ FTIRS to electrochemistry to probe the electrooxidation reaction and subsequently provide relevant qualitative data about the nature of intermediates/products, we first recorded FTIR spectra of the substrates in both media as references for band assignment. Figure 1b depicts the corresponding ex situ FTIR spectra in alkaline media showing the infrared specific bands for glucose and products assuming an exchanged number of electrons nex = 2 (gluconolactone, gluconate), nex = 4 (glucuronate) and nex = 6 (glucarate). Gluconolactone is well evidenced by its νC=O specific band at 1742 cm−1 (stretching vibration mode). The specific COO− function of an oxidized carbohydrate is characterized by the two intense bands at 1584 and 1413 cm−1 that correspond to the asymmetric stretching vibration νas(O–C–O) and symmetric νs(O–C–O), respectively. However, a thorough observation of spectra shows a dilemma for assigning these bands. Specifically, depending on the oxidized carbon in the glucose molecule (Figure 1a), different products having these bands are obtained, gluconate (carbon C1-position oxidation), glucuronate (carbon C6-position oxidation) and glucarate (both C1-position and C6-position oxidation). Interestingly, only glucose, gluconolactone and gluconate have the –CH2- function in C6-position. Thus, its band (deformation vibration mode) is a powerful tool for a precise and unambiguous identification since the position of δ(CH2) is ∼1368, 1365 and 1352 cm−1 (±5 cm−1) for glucose, gluconolactone and gluconate, respectively. It was observed (not reported herein) that in comparison to gluconate, galactonate shows identical spectra and in the other side, the O–C–O vibration of the osidic bridge of the lactobionate46 (from lactose oxidation) is situated in 1635–1660 cm−1 range. In PBS (Figure 1c), the IR bands of the phosphates are situated at 990 cm−1 for νs(PO3 −4), 1080 cm−1 for νas(PO3 −4) and 1180–1200 cm−1 for δ(HPO2 −4).
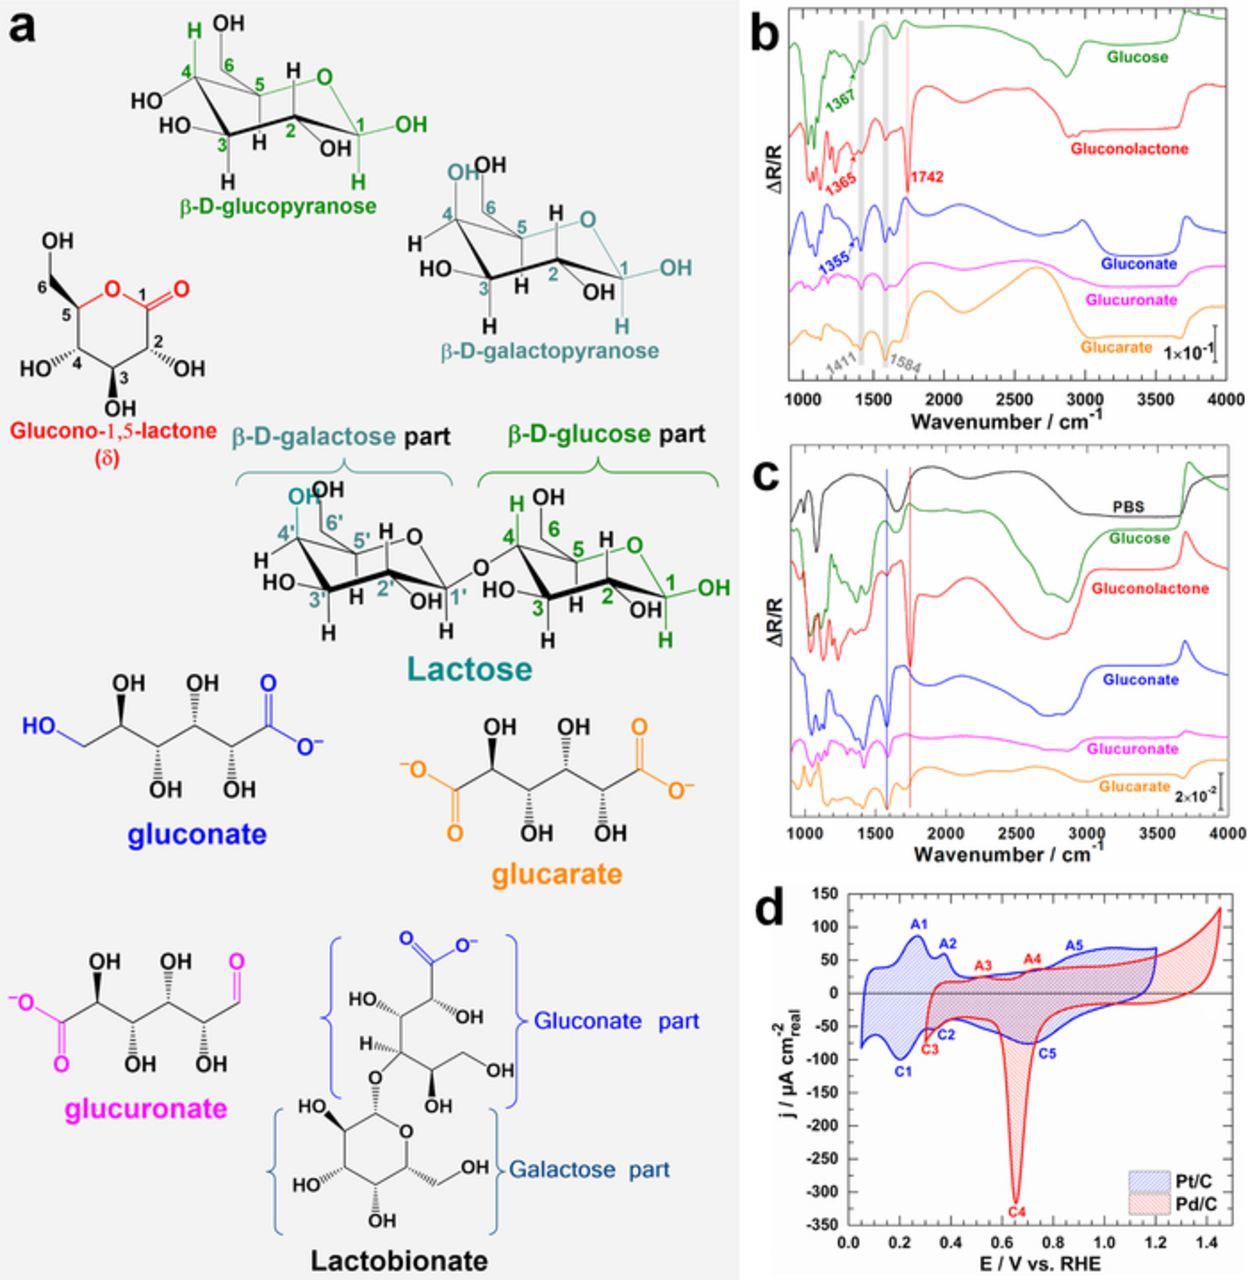
Figure 1. (a) Chemical structures of glucose, galactose, lactose and the possible reaction products: predominant forms in alkaline solution, typically at 25°C. Reflectance FTIR spectra of glucose and possible intermediates/products in: (b) NaOH aqueous solution (0.1 M, pH 12.8) and (c) phosphate buffer (0.2 M, pH 7.4). (d) CV (no iR correction) recorded at 50 mV s−1 in the FTIRS cell containing NaOH electrolytic solution (0.1 M, pH 12.8) on the model electrode materials of Pt/C and Pd/C. Temperature: 22 ± 2°C.
Figure 1d shows the CV profiles of Pd/C and Pt/C electrodes highlighting that the voltammograms recorded in the IR cell are typical of those obtained in a conventional three-electrode electrochemical cell. Thus, it can be argued that all processes are typical of the involved reactions. The shape of Pd/C corresponds to Pd nanoparticles wherein the oxidation of the palladium surface occurs at E ≥ 0.63 V vs. RHE in the positive-going sweep (peak A4) followed by the reduction of this PdO at ca. 0.65 V vs. RHE (peak C4) and the hydrogen adsorption on the released Pd active sites takes place at E < 0.42 V vs. RHE (peak C3) during the negative-going sweep. The shoulder A3 centered at 0.53 V vs. RHE is attributed to the hydrogen desorption process. For Pt/C electrode, the hydrogen desorption from Pt sites occurs during the positive potential-going scan between 0.05 and 0.4 V vs. RHE (peaks A1 & A2), followed by the double layer charging current up to 0.7 V vs. RHE and finally the Pt surface oxidation at higher potentials (region A5). In the reverse scan, after the Pt oxide reduction – corresponding to the cathodic peak centered at 0.7 V vs. RHE, peak C5 – the Pt free surface becomes covered by adsorbed hydrogen in the lower potential region from 0.4 to 0.05 V vs. RHE (peaks C2 & C1). For the electrochemical hydrogen adsorption (or desorption) process, the number and position of different peaks depend not only on the crystallographic orientation (hkl) of the surface, for instance (100), (110), and (111) for the low indexes but also on the nature of the metal. For instance, the hydrogen desorption on Pd47 surfaces occurs in the same potential range leading to a broad peak, while separate peaks are routinely observed for Pt48 in alkaline media.
It is generally accepted as a fait accompli that CV profiles for organic molecules oxidation on metal catalysts show at least one peak during the positive and one peak for the negative scanning of the electrode. To robustly and qualitatively elucidate here the exact nature of the backward peak, we designed specific experiments to reveal whether it belongs to "strongly adsorbed reaction intermediates" or to new reactant molecules coming from the solution. On the basis of our previous screenings on monometallic Au/C13 and bimetallic Au90Pd10/C12,49 and Au60Pd40/C35 materials, we examine herein other Pt/C, Pd/C and Au100-xMx/C (M = Pt, Pd) electrodes in order to rationalize the trends. The forward and reverse configurations were performed by starting at either the lower (0.05 V vs. RHE) or upper (1.40 V vs. RHE) potential limit at a quasi-steady-state scan rate of 1 mV s−1 (Figure 2a) and by recording the electrode reflectivity Ri at different potentials Ei, each separated by 50 mV intervals (Figures 2b–2e). The first procedure starts at 0.05 V vs. RHE and spectra are recorded during the forward going scan from 0.05 to 1.4 V vs. RHE (Figure 2b) and backward going scan from 1.40 to 0.05 V vs. RHE (Figure 2c). The second procedure starts, with a new electrode and solution, at 1.40 V vs. RHE and spectra are recorded during the forward going scan from 1.40 to 0.05 V vs. RHE (Figure 2d) and backward going scan from 0.05 to 1.40 V vs. RHE (Figure 2e).
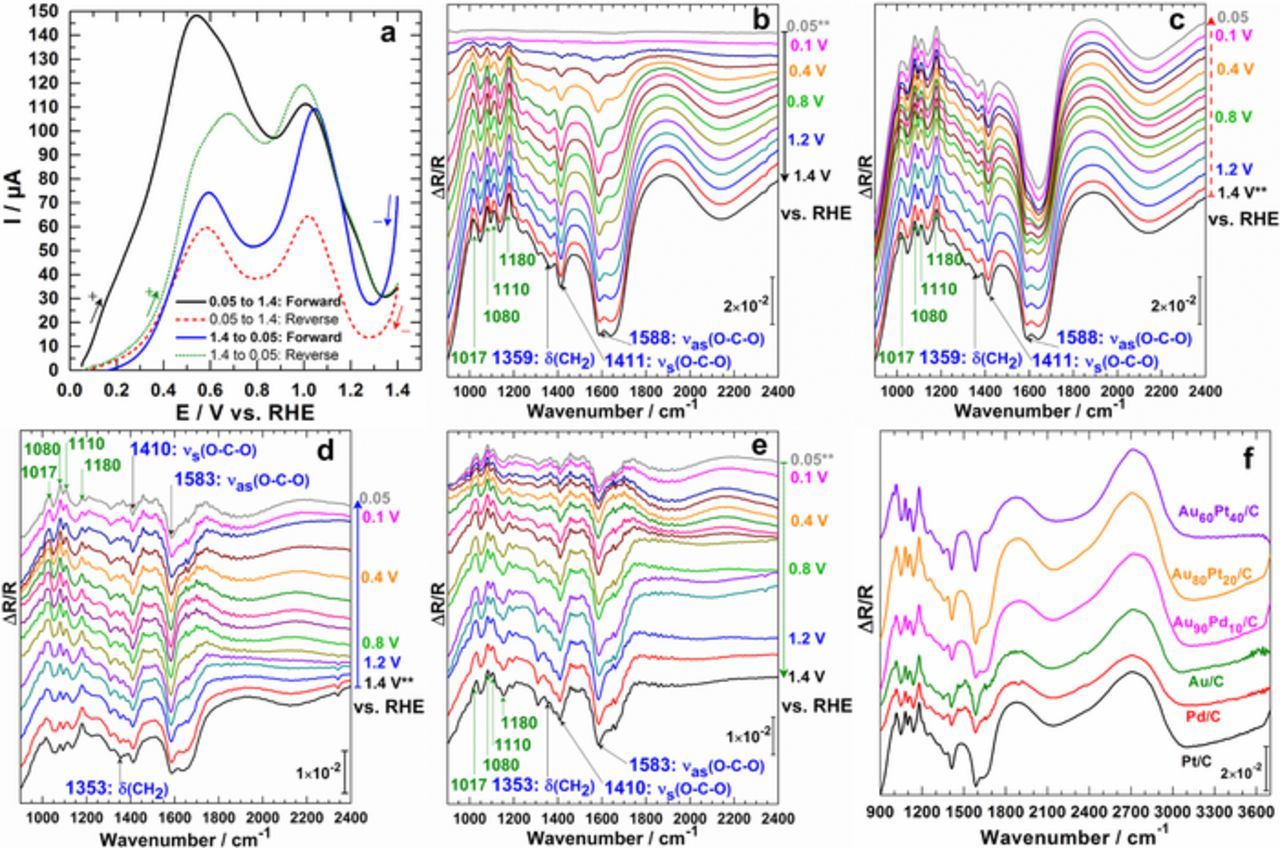
Figure 2. Spectroelectrochemistry experiments recorded in NaOH (0.1 M, pH 12.8) electrolyte in the presence of 50 mmol L−1 glucose on Au80Pt20/C electrode material. (a) CV (no iR correction) recorded in the FTIRS cell at a quasi-steady state scan rate of 1 mV s−1. (b-e) Corresponding SPAIRS plotted every 100 mV (except 0.05 and 0.1 V vs. RHE) for an initial electrode potential of either Ei = 0.05 V vs. RHE (b, c) or Ei = 1.40 V vs. RHE (d, e). (b) Forward-going scan from 0.05 to 1.40 V vs. RHE and (c) backward-going scan from 1.40 to 0.05 V vs. RHE for Ei = 0.05 V vs. RHE. (d) Forward-going scan from 1.40 to 0.05 V vs. RHE and (e) backward-going scan from 0.05 to 1.40 V vs. RHE for Ei = 1.40 V vs. RHE. (f) Compared SPAIRS results at an electrode potential of 0.7 V vs. RHE, collected on different electrodes during the forward-going scan for Ei = 0.05 V vs. RHE. Temperature: 22 ± 2°C. Note: "**" indicates the beginning of the oxidation bands.
Figures 2a to 2c display the screening results with Au80Pt20/C. Figure 2a shows that the glucose oxidation reaction (GOR) starts at E ≤ 0.2 V vs. RHE substantiated by the synchronous appearance of intense bands at 1588 and 1411 cm−1 assigned to the specific COO− function of an oxidized carbohydrate. While the positive band at 1080 cm−1 indicates glucose consumption through its dehydrogenated species, the water amount in the thin-electrolyte during the reaction is demonstrated by its δ(H2O) at ∼1660 cm−1. Remarkably, no C–C bond cleavage compounds (CO: 1900–2100 cm−1, carbonate: 1396 cm−1, CO2: 2340–2350 cm−1) were observed. It should be noted that the weak signal around 2345 cm−1 results from the oxidation of the support, i.e. Vulcan (this was evaluated during the control and blank tests with Vulcan and NaOH only). Additionally, gluconolactone (νC=O specific band at 1742 cm−1) is not visible from the spectra. Since the same bands are obtained from the two approaches, the oxidation peak during the reverse scan corresponds to fresh molecules oxidation. To validate and extend the reaction selectivity on the entire range of bimetallic materials, we recorded CV-FTIRS. It was remarkably observed that the spectra present the same bands. Specifically, the obtained SPAIRS results at an electrode potential of 0.7 V vs. RHE and collected on different electrodes during the forward-going scan (Figure 2f) provide the direct evidence of quasi-identically nature of reaction product(s). It is worth mentioning that the same type of spectra was obtained for galactose electrooxidation, which would suggest that the reactivity of this glucose's isomer did not depend strongly on the nature of catalysts.
The aforementioned set of data indicates a highly selective oxidation at the whole electrode potential range without C–C bond breaking and a fast gluconolactone hydrolysis, since it is an unavoidable intermediate. Conclusively, the band at ∼1350 cm−1 is rationally assigned to the deformation vibration mode δ(CH2) of gluconate. Taken together, these clues underpin a drastic change of the reaction kinetics with the revisited BAE protocol since C–C bond cleavage compounds and gluconolactone were observed on other electrodes based on nanoscale materials.52,53 In summary, it can be qualitatively concluded that glucose is selectively oxidized to gluconate according to a 2-electron pathway.
The voltammetry plays a pivotal exploration role wherein series of CV experiments help to determine the oxidation/reduction potential of the substrate, thereby allowing a precise quantitative study under either galvanostatic or potentiostatic conditions. Thus, having successfully examined the spectra as a function of the electrode potential by SPAIRS during our forays toward the electrooxidation, we next spectroelectrochemically probed the reaction at different fixed electrode potentials during the chronoamperometry (CA). Yet, the thin-layer electrolyte configuration does not allow a good mass transport, but it is scientifically sufficient enough for product(s) identification purposes (qualitatively). Figure 3a displays the typical behavior of I vs. t curves at an applied potential of Eappl = 0.8 V vs. RHE along with the recorded spectra in Figures 3b–3d. The fast current delay during the first minutes is rationally assigned to the thin-film configuration and the obtained histograms of current density distribution in the inset do not represent the real short-term stability trend. In order to establish universal selectivity-electrocatalyst-potential relationships, different electrode potentials from 0.2 to 1.2 V vs. RHE were examined (two potentials are displayed in Figure 3) and the same current and spectra profiles were obtained. Specifically, the same set of bands, 1583, 1412, 1350, and 1080 cm−1 demonstrate that the nature of the product(s) is identical to the previous methodology.
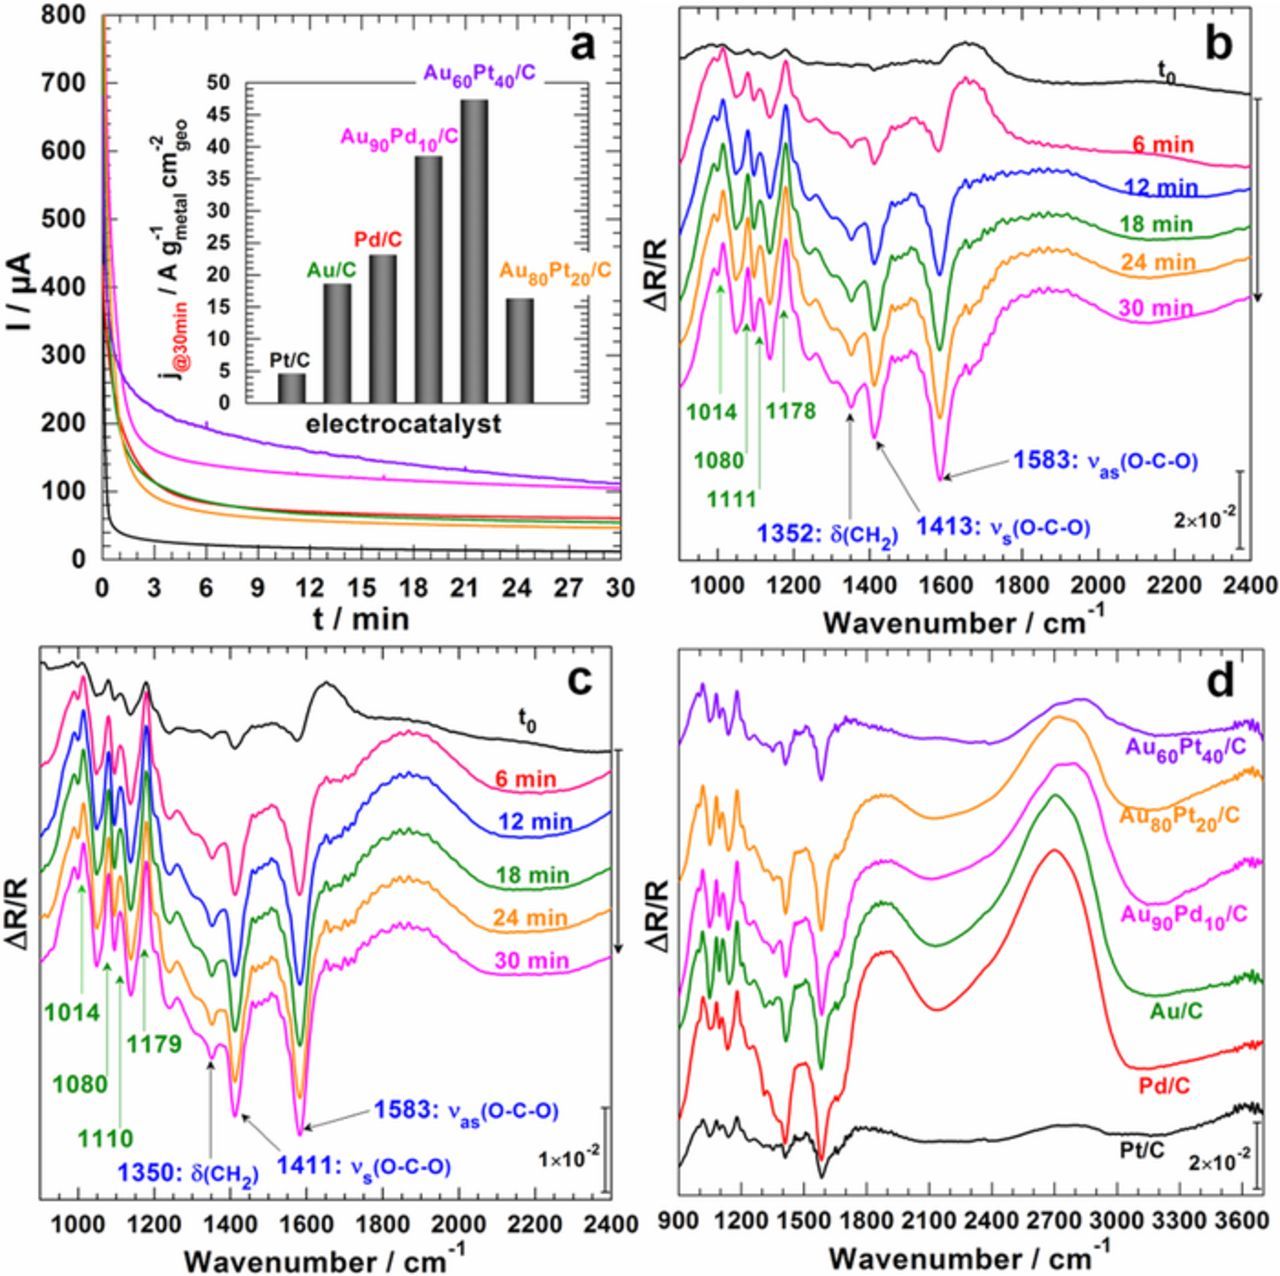
Figure 3. Spectroelectrochemistry experiments recorded in NaOH (0.1 M, pH 12.8) electrolytic solution in the presence of 50 mmol L−1 glucose. (a) CA recorded at 0.8 V vs. RHE in the FTIRS cell on different electrodes. In situ FTIR spectra plotted every Δt = 6 min during CA measurements at 0.5 V vs. RHE on: (b) Au/C and (c) Au60Pt40/C electrode materials. (d) Compared spectra at t = 30 min on different electrode materials CA measurements at 0.8 V vs. RHE. Temperature: 22 ± 2°C.
The previous findings show only, at a qualitative level, the remarkable selectivity in an alkaline medium. Otherwise, the nature of the reaction product can no longer be extended a priori to other aqueous media. Given the great interest of metallic nanoparticles at pHs close to biological conditions for sensing or other "abiotic" purposes,33,34,52–58 we subsequently turned our spectroelectrochemical apparatus out to elucidate the nature of the reaction product. Compared to the investigations in a "relatively clean electrolyte" that is basic NaOH solution, the translation of spectroelectrochemistry in pH close to 7 is prohibitively challenging with added factors such as the low activity of metals toward organics electrooxidation and the presence of species such as phosphates which can interfere since they have vibration bands in the considered spectral domain. The acquisition of the FTIR data of the buffer solution and subsequent reagents, as well as the supposed reaction products, thus preceded the initiation of the reactions at a quasi-steady state scan rate of 1 mV s−1. The obtained results are gathered in Figures 4a–4c for CV-FTIRS (SPAIRS) and Figures 4d–4f for CA-FTIRS. The first observation is that the activity is lowered at pH 7.4 compared to the data recorded at pH 13 even if with a tenfold substrate concentration, which underpins the crucial role of hydroxyls.59,60 The characteristic bands of gluconate (Figure 4b) and galactonate (Figure 4c) are observed at 1410 and 1588 cm−1. Interestingly, the characteristic vibration band of ν(C=O) for gluconolactone at ca. 1744 cm−1 can be kinetically translated as a slow lactone hydrolysis at pH 7.4 in comparison to pH 13. The second remarkable observation is the presence of a second vibration band ν(C=O) at 1780–1785 cm−1, which is typical of carboxylic acids. This is therefore indicative of a local decrease of pH that would result in a rapid protonation of gluconate to gluconic acid given its pKa of 3.75.61
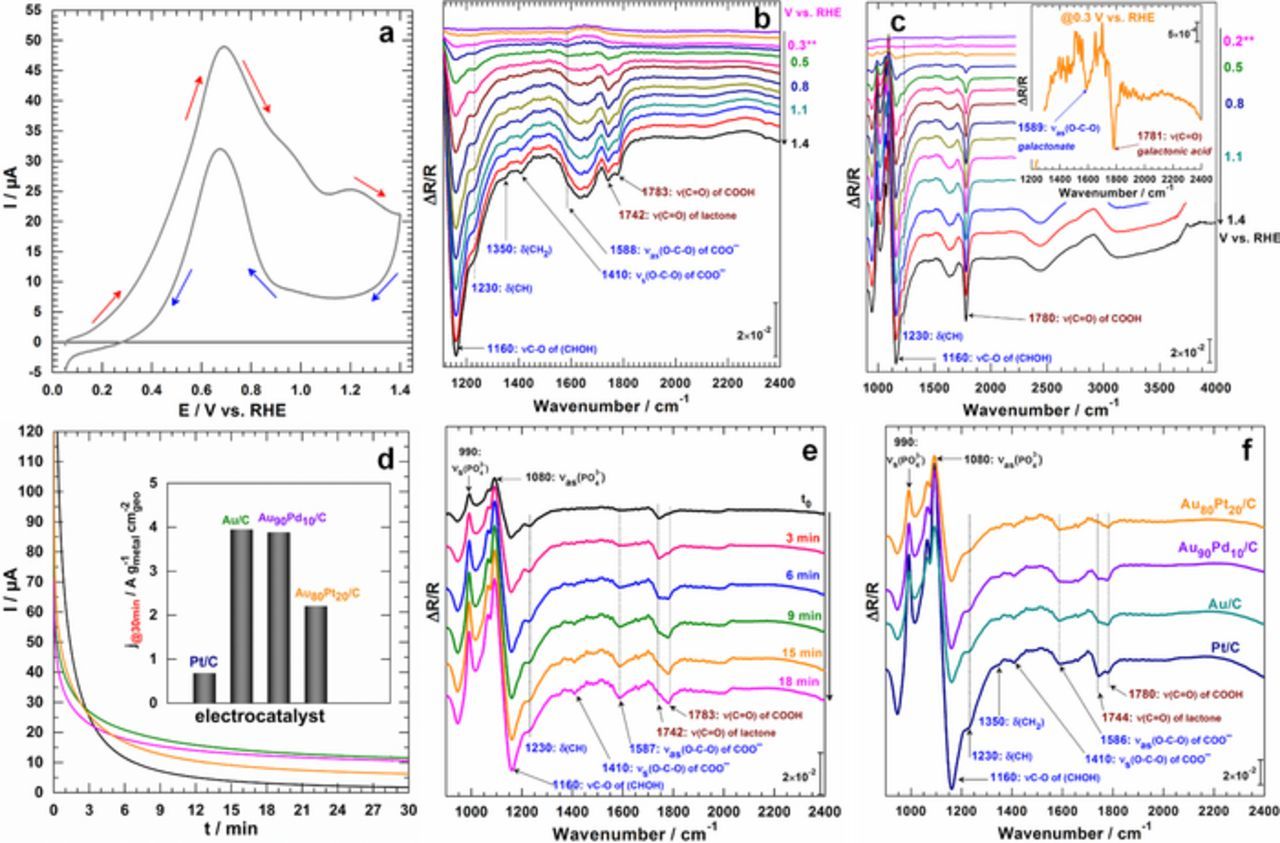
Figure 4. Spectroelectrochemistry experiments recorded in phosphate buffer (0.2 M, pH 7.4) electrolytic solution in the presence of 100 mmol L−1 substrate. (a) CV (no iR correction) recorded in the FTIRS cell at a quasi-steady state scan rate of 1 mV s−1 in the presence of substrates. Corresponding SPAIRS plotted every 100 mV for: (b) Au80Pt20/C electrode material in the presence of glucose; (c) Au/C electrode material in the presence of galactose: the inset show the spectrum recorded at 0.3 V vs. RHE. (d) CA recorded in the FTIRS cell at 0.6 V vs. RHE on different electrodes. (e) In situ FTIR spectra plotted every Δt = 6 min during CA measurements at 0.4 V vs. RHE on Pt/C electrode material. (f) Compared spectra at t = 30 min on different electrode materials during CA measurements at 0.6 V vs. RHE. Temperature: 22 ± 2°C.
To support such explanations, we performed CA-FTIRS experiments (Figure 4d) wherein an increase in the intensity of the band at 1780–1785 cm−1 for –COOH over time is clearly evident (Figure 4e). The set of spectra after 30 min are shown in Figure 4f where the intensity of the band due to gluconolactone at 1744 cm−1 decreases gradually while those at 1588 cm−1 (gluconate) and 1780 cm−1 (gluconic acid) increase over time. The second characteristic substantiating the formation of –COOH acid form in lieu of a –COO− carboxylate is a very broad band around 3000 cm−1 (not shown here) assigned to the carboxylic acid's –OH elongation. This first spectroelectrochemical work in buffer at pH 7.4 with nanomaterials enlightens us of the exact nature of the final product in neutral pHs.
It should be noted that a prominent local pH depletion has been firstly reported in 2010 by Camara's group62 before confirmation by several groups including us and now widespread in alkaline media as a fait accompli for glycerol electrooxidation enabling the detection of CO2 (pKa = 6.4, 10.3 for the dissolved CO2 as H2CO3).44,63–65 To explain the origin of this surprising phenomenon, it is mainly argued that the thin-layer configuration (about 1 and 10 μm)66–68 of the solution during the spectroelectrochemical study induces a significant consumption of OH− during the organic molecule oxidation.
Electrochemical activation energy
Having demonstrated the ability to use spectroelectrochemistry as a powerful tool to probe the electrochemical reaction, we sought to study the reaction itself more carefully at different temperatures. Such investigation is crucial for the assessment of the electrochemical activation energy (Ea), an important reaction kinetic parameter indicating the activation energy barrier to overcome before the reaction occurs. A qualitative examination of the polarization curves at model electrodes of Pt/C (Figures 5a–5c) and Au/C (Figures 5d–5f) for different mono- and di-saccharides, glucose (Figures 5a and 5d), galactose (Figures 5b and 5e) and lactose (Figures 5c and 5f) shows that I increases with T for E > 0.4 V vs. RHE, indicating that the electrochemical reaction at the surface of these catalysts is exothermic (Ea > 0). For the particular case of Pt/C, the peak current between 0.2–0.4 V vs. RHE decreases as the temperature increases. This therefore reflects a thermodynamically unfavorable process (endothermic, Ea < 0) that has been firstly reported by Essis-Yei et al.36 in 1988 on bulk Pt electrode. In order to access the value of Ea, the electrochemical formulation of the Arrhenius relationship was used (Equation 1).69
![Equation ([1])](https://content.cld.iop.org/journals/1945-7111/165/9/H425/revision1/d0001.gif)
![Equation ([2])](https://content.cld.iop.org/journals/1945-7111/165/9/H425/revision1/d0002.gif)
j: current density. E: electrode potential. ΔrG: Gibbs' free energy (J mol−1). ΔrH°: standard enthalpy or chemical activation energy (J mol−1). ΔrS°: standard entropy (J K−1 mol−1). A or A': pre-exponential factor. α': effective symmetry factor (related to properties of the electric double layer: α' = αn is used because the number of electrons n of the rate limiting step, rds, is unknown). R: universal gas constant (8.314 J K−1 mol−1). T: temperature in Kelvin (T = 273.15 + θ, where θ is the temperature in °C). F: Faraday's constant (96485 C mol−1).  : electrochemical activation energy (J mol−1).
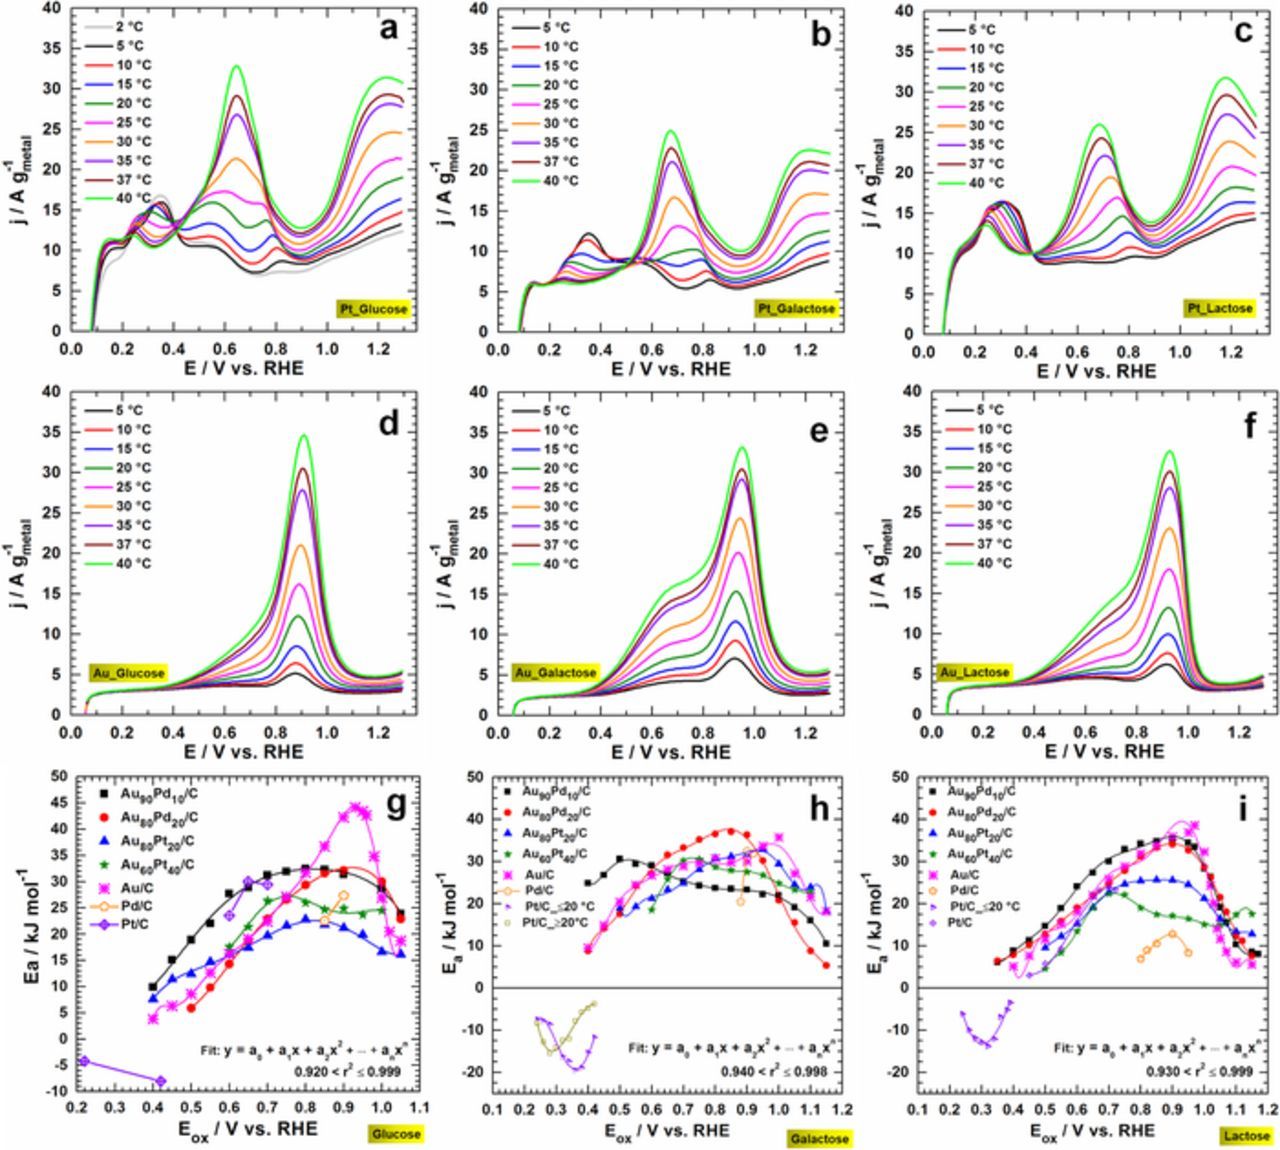
Figure 5. Effect of the temperature on the oxidation reaction and the dependence of the electrochemical activation energy evaluated at different oxidation potential for different mono-and di-saccharides: (a, d, g) glucose; (b, e, h) galactose and (c, f, i) lactose. The polarization curves (no iR correction) at the model electrode materials of Pt/C (a-c) and Au/C (d-f) were recorded at 20 mV s−1 scan rate in 0.1 mol L−1 NaOH and in the presence of 10 mmol L−1 substrate. (d) The electrochemical activation energy evaluated from the polarization curves obtained at 20 mV s−1 in 0.1 mol L−1 NaOH + 10 mmol L−1 substrate. Supporting electrode = CF.
The value of Ea =  can be determined from the Arrhenius' plots (Equation 2). Figures 5g to 5i depict the trends of Ea as a function of the oxidation potential (Eox). Overall, Ea < 40–50 kJ mol−1, suggesting that the reaction kinetics is not controlled by the reactant adsorption but by the reactants/products diffusion processes.70 Since
  , it was theoretically expected that Ea vs. Eox follows a linear distribution. However, the fitting result shows a polynomial distribution, supported by the theoretical calculations of Protsenko and Daminov.71,72 To date, the dependency of Ea to Eox has been observed for methanol electrooxidation at Pt bulk,73 and polynomial trend has been recently observed for glucose electrooxidation at pHs 7.474 and 13.33 Herein, we hypothesize that the effective symmetry factor α' ( = αn) is a Eox-dependent parameter, which explained the polynomial distribution of Ea.
Qualitative electroanalytical studies: electrolysis, chromatography, mass spectrometry
Based on the qualitative data obtained by spectroelectrochemistry, we next used a tandem of electrolysis and chromatography to electro-oxidize, and identify the main stable reaction products from these carbohydrates. Figure 6a compares the results in terms of oxidation current (Iox, left y-axis) and quantity of electricity (Qox, right y-axis), wherein the progressive decrease in Iox is ascribed to the reactant consumption and/or to catalyst deactivation. The deactivation results from the strongly adsorbed reaction intermediates/products that block the catalytic surface.12,44 The trends in Iox and Qox indicate that Au/C electrode material behaves as the best stable monometallic materials compared to Pt/C that is rapidly deactivated. The bulk electrolysis was carried out at different applied potentials of Eappl = 0.2, 0.4, 0.6, and 0.8 V vs. RHE. Figure 6b shows the amperometric (and coulometric) Iox (and Qox) vs. t traces at Eappl = 0.8 V vs. RHE with the overall goal of comparing the efficiency at a given electrode potential rather than enabling individual catalysts to operate at their specific peak current. The observed trend is explained by the fact that at this potential, for 50 mM substrate, the polarization curves I vs. E of Au/C exhibits nearly its maximum peak current, while those of bimetallic electrodes are situated at E < Eappl = 0.8 V vs. RHE. HPLIC analysis of samples after the bulk electrolysis (Figure 6c) highlights the presence of two unresolved peaks at a retention time of tR = 5.5 and 6.1 min, nearly coinciding with gluconate (galactonate), however very far from glucuronate (tR = 10 min) and glucarate (tR = 21 min) as previously reported.13,35 After a thorough study on a monometallic Au/C electrocatalyst, it was argued that the peaks A and B belong both to the same product, gluconate.13 Indeed, the LC-MS analysis (Figure 6d) after acidification and lyophilization show that the obtained spectra belong to the lactobionic, galactonic and gluconic acids. Basically, LC-MS analysis in negative ionization mode allows to distinguish the different hypothesized acids based on the mass of their pseudo-molecular ions (M–H)−: m/z = 195 (gluconic), 195 (galactonic), and 357 (lactobionic). The other peaks at m/z = 129 and 391 are attributed to the fragmentation and simple dimerization processes, thus confirming the feature of a unique reaction product for which nex = 2. Our findings conclusively provide direct evidence that the oxidation happens exclusively at carbon in the C1-position and involves two electrons, thus underpinning that electrochemistry can be elegantly used for a selective saccharides oxidation in aqueous media.
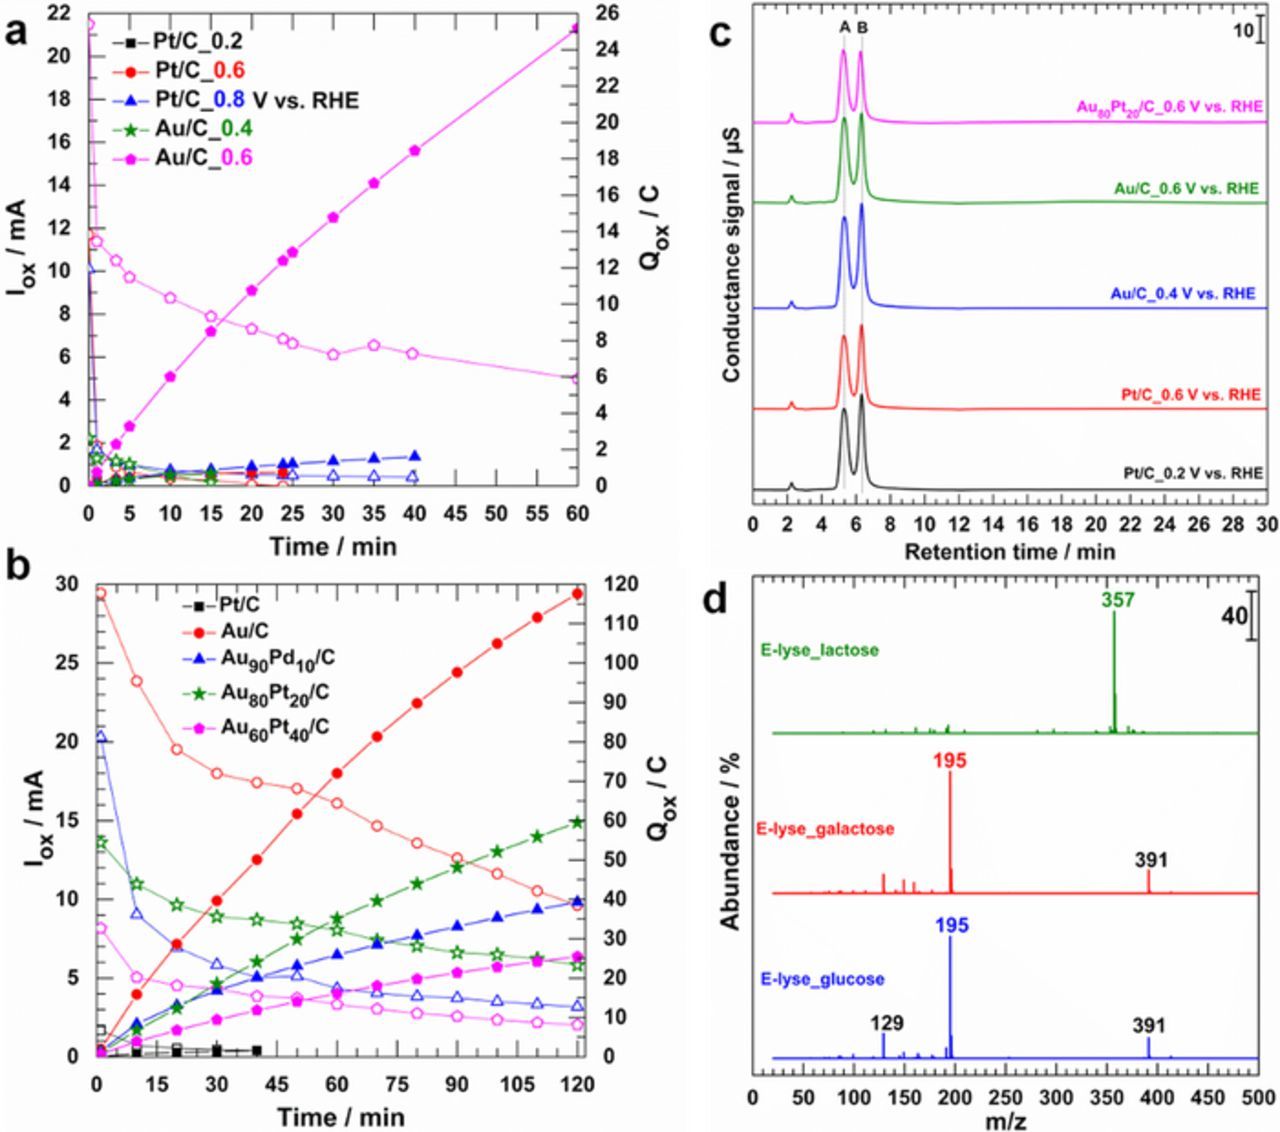
Figure 6. (a) Electrolysis in a 0.1 mol L−1 NaOH solution on the model electrodes of Pt/C and Au/C at different potentials in the presence of 50 mmol L−1 glucose: Oxidation current Iox (left y-axis, opened symbols) and the quantity of electricity Qox (Right y-axis, filled symbols). (b) Electrolysis in a 0.1 mol L−1 NaOH solution on different electrode materials at 0.8 V vs. RHE in the presence of 50 mmol L−1 glucose: Oxidation current Iox (left y-axis, opened symbols) and the quantity of electricity Qox (Right y-axis, filled symbols). (c) HPLIC from electrolysis solution (0.1 mol L−1 NaOH + 50 mmol L−1 glucose) collected at t = 1 min (diluted two times before injection) with different electrode materials. (d) LC-MS analysis spectra (negative ionization, M-1) of the product from glucose, galactose and lactose electrolysis at 0.8 V vs. RHE (for t = 7.5 h) in 0.1 mol L−1 NaOH + 20 mmol L−1 substrate.
Electrochemical kinetic analysis
Next, we investigated the electrochemical kinetics to compare the exchange current (I0) or exchange current density (j0), normalized to the geometric surface area of the electrode (Equation 3). Prior to that, the short-term stability tests performed by CA at different electrode potentials from Eappl = 0.5 to 0.9 V vs. RHE in 0.1 M NaOH with 10 mmol L−1 substrate (Figure 7a: glucose), (Figure 7b: galactose) and (Figure 7c: lactose) show that the bimetallic materials exhibit an enhanced electrocatalytic performance for mono-saccharides.
![Equation ([3])](https://content.cld.iop.org/journals/1945-7111/165/9/H425/revision1/d0003.gif)
E: electrode potential. Eeq: equilibrium potential. η: overpotential. j: current density. j0: exchange current density. α': effective symmetry factor (related to properties of the electric double layer: α' = αn is used because the number of electrons n of the rate determining step, rds, is unknown). R: universal gas constant (8.314 J K−1 mol−1). T: temperature in Kelvin (T = 273.15 + θ, θ(°C)). F: Faraday's constant (96 485 C mol−1). b: Tafel slope (mV dec−1).
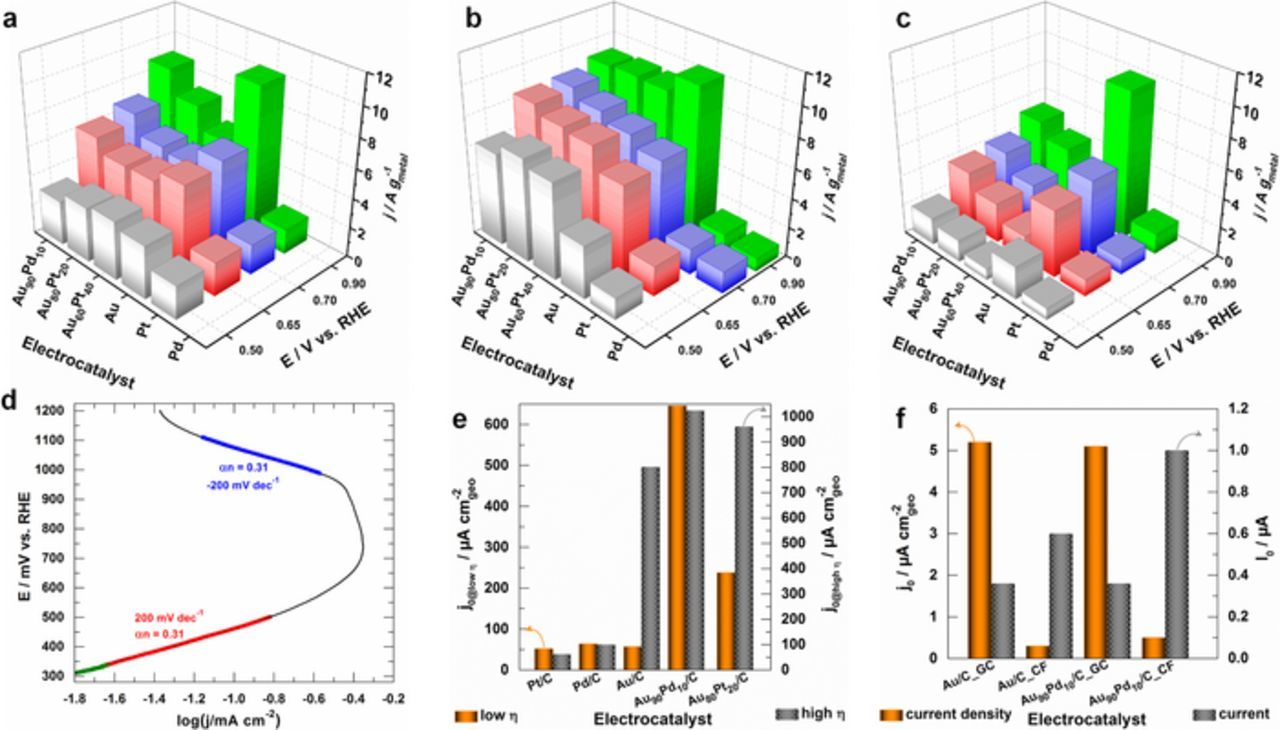
Figure 7. (a-c) Histograms of steady-state current density at t = 10 min during CA measurements at different electrode potentials on various electrode materials: Experiments were performed in NaOH (0.1 M, pH 12.8) electrolytic solution in the presence of 10 mmol L−1 substrate; (a) glucose, (b) galactose and (c) lactose. (d) Typical Tafel plot from the polarization curve (no iR correction) recorded at a quasi-steady state scan rate of 2 mV s−1 at Au90Pd10/C_CF electrode material in phosphate buffer (0.2 M, pH 7.4) electrolytic solution in the presence of 10 mmol L−1 glucose. (e) Exchange current density j0 at low overpotential (left Y-axis) and high overpotential (right Y-axis), determined from polarization curves recorded at a quasi-steady state scan rate of 2 mV s−1 at different electrode materials in NaOH (0.2 M, pH 12.8) electrolytic solution in the presence of 10 mmol L−1 glucose. (f) Exchange current density j0 (left Y-axis) and exchange current I0 (right Y-axis) at low overpotential, determined from polarization curves recorded at a quasi-steady state scan rate of 2 mV s−1 at different electrode materials in phosphate buffer (0.2 M, pH 7.4) electrolytic solution in the presence of 10 mmol L−1 glucose. Temperature: 22 ± 2°C.
Figure 7d displays a typical Tafel plot from the polarization curve (no iR correction) recorded at a quasi-steady state scan rate of 2 mV s−1 from which the effective symmetry factor α', the Tafel slope b and j0 can be determined. The metric of j0 (function of b and Eeq) depends only on the catalyst material and electrolyte. Thus, it reflects the ability of electron transfer from the substrate to the electrode for an oxidation reaction. Technically, a catalytic material having a high j0 and a small b is desirable since a smaller value of b means that increasing the same current density (dec−1) requires smaller overpotential (mV), implying faster charge transfer kinetics. Depending on the investigated materials, the determined values of α' range from 0.1 to 0.5 and b from 100 to 300 mV dec−1 therefore confirming the complexity of the electrooxidation reactions (the three substrates were probed), which might involve the reactant(s) adsorption, electron transfer and reactant(s)/product(s) diffusion as rds. Typically, α' is ∼0.5 and leads to: (i) b = 120 mV dec−1 after the potential drop (iR) correction and n = 1 as transferred number of electrons during the rds and (ii) b = 60 mV dec−1 for a pseudo two-electron (n = 2) reaction as the rds.75 Since no iR compensation (may contribute up to tens of mV)76 was applied to the present data, the results could suggest the first-electron transfer during the oxidation of saccharides as rds or a pseudo two-electron reaction as the rds. However, according to International Union of Pure and Applied Chemistry (IUPAC, Technical Report 2014), the simultaneous transfer of more than one electron is considered to be highly improbable.77 The determined value of j0 at low η (E ≤ 0.55 V vs. RHE) and high η (E > 0.60 V vs. RHE) for glucose electrooxidation in 0.1 M alkaline media support the good electrochemical kinetics of the bimetallic materials. Specifically, Au90Pd10/C is the most active with j0 > 0.5 mA cm−2. However, no data is available in the literature for comparison under alkaline environments. We finally evaluated the kinetics at pH 7.4 on GC (0.07 cm2) and CF (2 cm2) supports by using the metrics of j0 and I0 because of different geometric surface areas. For Au90Pd10/C, the obtained exchange current at CF support is larger in comparison to Au/C, which indicates a substantial "support effect" from CF on the catalytic activity. Besides, no rational comparison can be made between GC and CF. It should be noted that GC (very expensive, very small electrode area) is only interesting for examining fundamental aspects while CF mats can be fabricated at large scale for real applications.
Overall reaction scheme
We finally combined the in/ex situ investigations on the monometallic and bimetallic materials to revise and generalize the previously established catalytic reaction cycle for glucose electrooxidation in alkaline medium on Au/C13, as displayed in Scheme 1. This scheme is valid for galactose and lactose since only the carbon at the C1-position is involved in the catalytic cycle. Owing to its good spatial arrangement,78 the adsorption of the β anomeric form (1) leads to the intermediate 2 (rate constant k1→2) before yielding the adsorbed lactone (3) after a second electron transfer with a rate constant k2→3/3'. Then, the lactone undergoes either desorption (5, rate constant k3/3'→5) and then hydrolysis to gluconate (7, rate constant k5→7) or a self-rearrangement to yield an adsorbed gluconate (4 or 4') at k3/3'→4/4' as a rate constant before being desorbed as a final product (7: rate constant k4/4'→7). It has been argued that (4') leads to an enhanced antisymmetric O–C–O stretching vibration (νas = 1588 cm−1), while (4) favors the symmetric motion (νs = 1410 cm−1).79 Based on the collected spectroelectrochemistry data in alkaline medium, herein, it can be concluded that gluconate is weakly adsorbed on the surface by either only one oxygen (4) or two oxygen (4'). However, no rational conclusion can be made in neutral pH given the weak intensity of the spectra. Furthermore, the intermediate (6) is likely obtained from (7) due to a local pH decrease in neutral pH than a direct lactone hydrolysis (rate constant k5→6). A significant consumption of OH− during the electrolysis with high glucose concentration (> [NaOH]) may lead to a mixture of (6) and (7) as final and stable products only if the pH at the end is above their pKa that is 3.75. It should be noted that spectroelectrochemistry enables the detection of the reagents, intermediates (stable enough) and products, while basic analytic methods (HPLIC, LC-MS, FTIRS) allow detecting only the very stable products. This reaction scheme could be likely extended to other monosaccharides as well as polysaccharides.
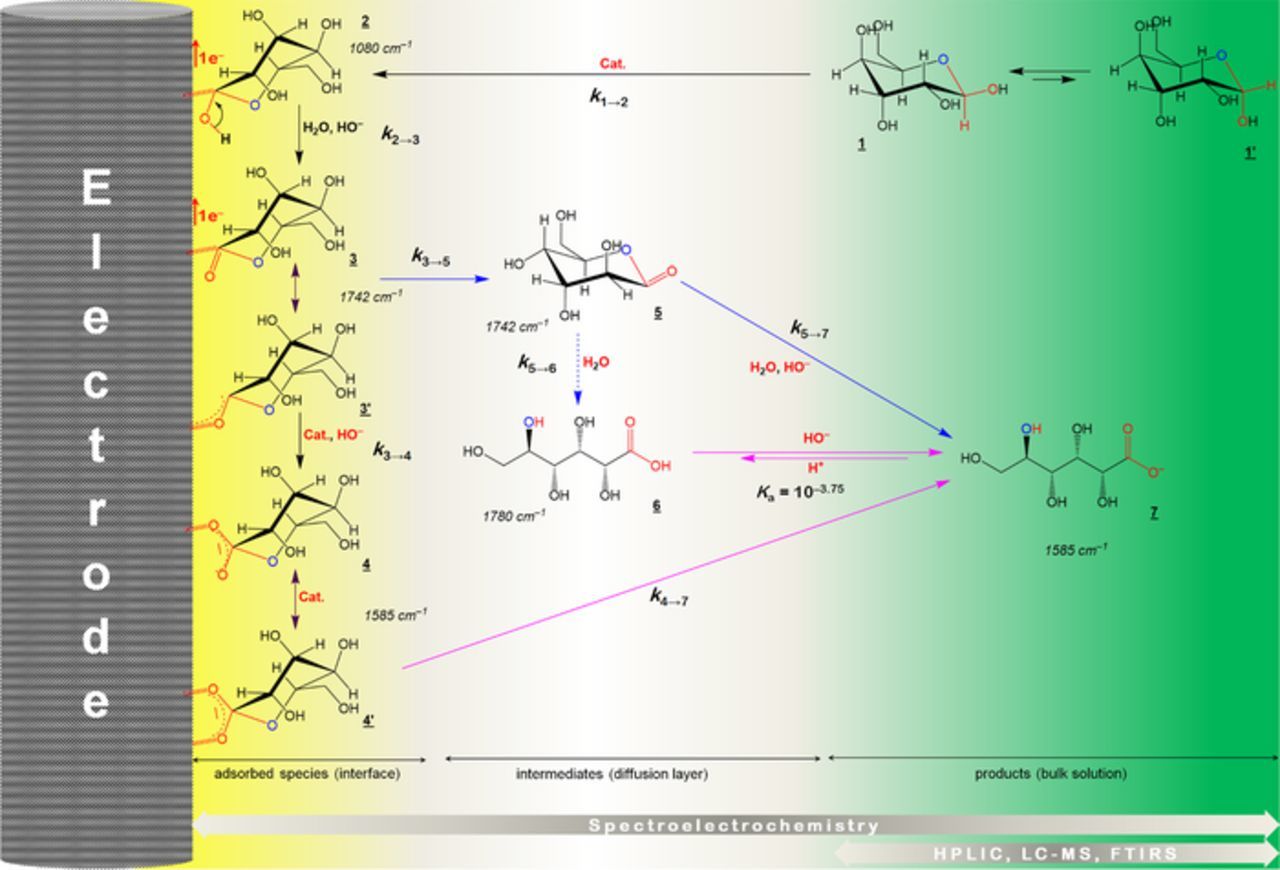
Scheme 1. Proposed scheme based on the collected electrochemical, spectroscopic and spectrometric data during the electrochemical oxidation of glucose (also valid for galactose and lactose) in aqueous media. Cat. refers to a catalytic species involved in the reaction, which can be a pure metal M, M(OH)x or MOx from Au-Pt or Au-Pd nanomaterials.
Conclusions
During these forays toward the electrocatalytic oxidation of mono- and di-saccharides on gold-based nanocatalysts, we have relied heavily on pure electrochemical technics (cyclic voltammetry, chronoamperometry) to identify viable electrode windows and atomic composition wherein the substrates can be quantitatively studied. The rational and methodological screenings permit us to evidence the overall specificities of elaborated electrocatalysts by the so-called Bromide Anion Exchange (BAE) method. The setup of two complementary procedures during the spectroelectrochemical studies revealed that the electrooxidation of glucose, galactose, and lactose fuels did not affect the carbon skeleton of the molecules in either basic or neutral pHs. The hydrolysis of the lactone as a reaction intermediate is kinetically fast on the developed nanocatalysts in alkaline media while the decrease of the pH toward 7.4 enables to detect the lactone and acid forms by their specific vibration bands of 1744 and 1780 cm−1, respectively. A local pH decrease within the thin-electrolyte has been proposed to explain their presence by spectroelectrochemistry. The main conclusion after further chromatographic and spectrometric investigations is that the substrates are selectively oxidized at the C1-position allowing an exchange number of electrons of two. The obtained results delineate a general strategy for a versatile organic electrosynthesis by tuning the electrocatalysts performance, and offer ample opportunities for a rational design of nanostructured catalysts for use in fuel cells or in the elegant organic electrosynthesis that is a promising technology allowing chemists to "do more with less". However, for sustainability, scalability, and versatility purposes, further deeper investigations on the selectivity and conversion under flow conditions are needed on the scale-up as well as the modularity for the development of methodologies that should entail the systematic examination of each reaction parameter, including, solvent, electrolyte, reaction temperature, etc. Owing to its scalability of fabrication and obtained kinetics data, electrospun carbon fibers as supporting electrode material are emerging as a potential candidate, similar to the well-established carbon paper or carbon cloth that are widely employed by the electrocatalysis's community.
Acknowledgments
The authors thanks the "Chembio-Energy" project in the framework of the ANR program Bioénergies/Biomatières & Energie (France, 2012–2015). A.B.E. thank the thesis funding by the Brazilian program Ciência sem Fronteiras ("Science without Borders", 2013–2015).
ORCID
Yaovi Holade 0000-0002-8806-568X
Sophie Tingry 0000-0001-6311-9330