Abstract
This paper presents an approach to quantify microstructural inhomegeneity in lithium ion battery electrodes over multiple length scales and examines the impact of this microstructural inhomogeneity on electrochemical performance. Commerical graphite anodes are investigated because graphite remains the anode material of choice due to its low cost, mechanical robustness, and suitable electrochemical properties. At the same time, the graphite anode often plays a role in cell degradation and failure, as lithium plating can occur on the graphite anode during charge, when unfavorable microstructure in the graphite electrode leads to a large overpotential. Here, three-dimensional representations of four different commercial anodes obtained with X-ray tomographic microscopy are statistically analyzed to quantify the microstructural inhomogeneity that is commonly present in lithium ion battery electrodes. Electrochemical simulations on the digitalized microstructures are performed to isolate and understand the influence of different types of microstructural inhomogeneity on battery performance. By understanding how distributions in particle size and shape or slurry and electrode processing cause microstructural inhomogeneity and impact performance, it is possible to determine the extent to which homogeneity should be prioritized for specific applications and how homogeneity could be achieved through smart material selection and processing.
Export citation and abstract BibTeX RIS

This is an open access article distributed under the terms of the Creative Commons Attribution 4.0 License (CC BY, http://creativecommons.org/licenses/by/4.0/), which permits unrestricted reuse of the work in any medium, provided the original work is properly cited.
The microstructure of lithium ion battery (LIB) electrodes has been traditionally discussed and incorporated into electrochemical simulations using a homogenized picture, where one value of porosity or tortuosity describes effective parameters for the entire electrode. 1,2 However, as a glance at images of commercial LIB anodes reveals (Figure 1a), particle size and shape distributions result in an inhomogeneous microstructure. An inhomogeneous microstructure can cause a spread in the local current density during operation, which has implications for battery performance, safety, and durability. 3,4 Heterogeneous local current densities lead to a spatially varying state of charge (SOC), not only reducing the accessible capacity 5 at high cycling rates, but also risking overcharge of parts of the electrode. For anodes made of graphite, 6 overcharging is especially critical because it leads to metallic lithium plating with accompanying degradation and safety issues. 7–10
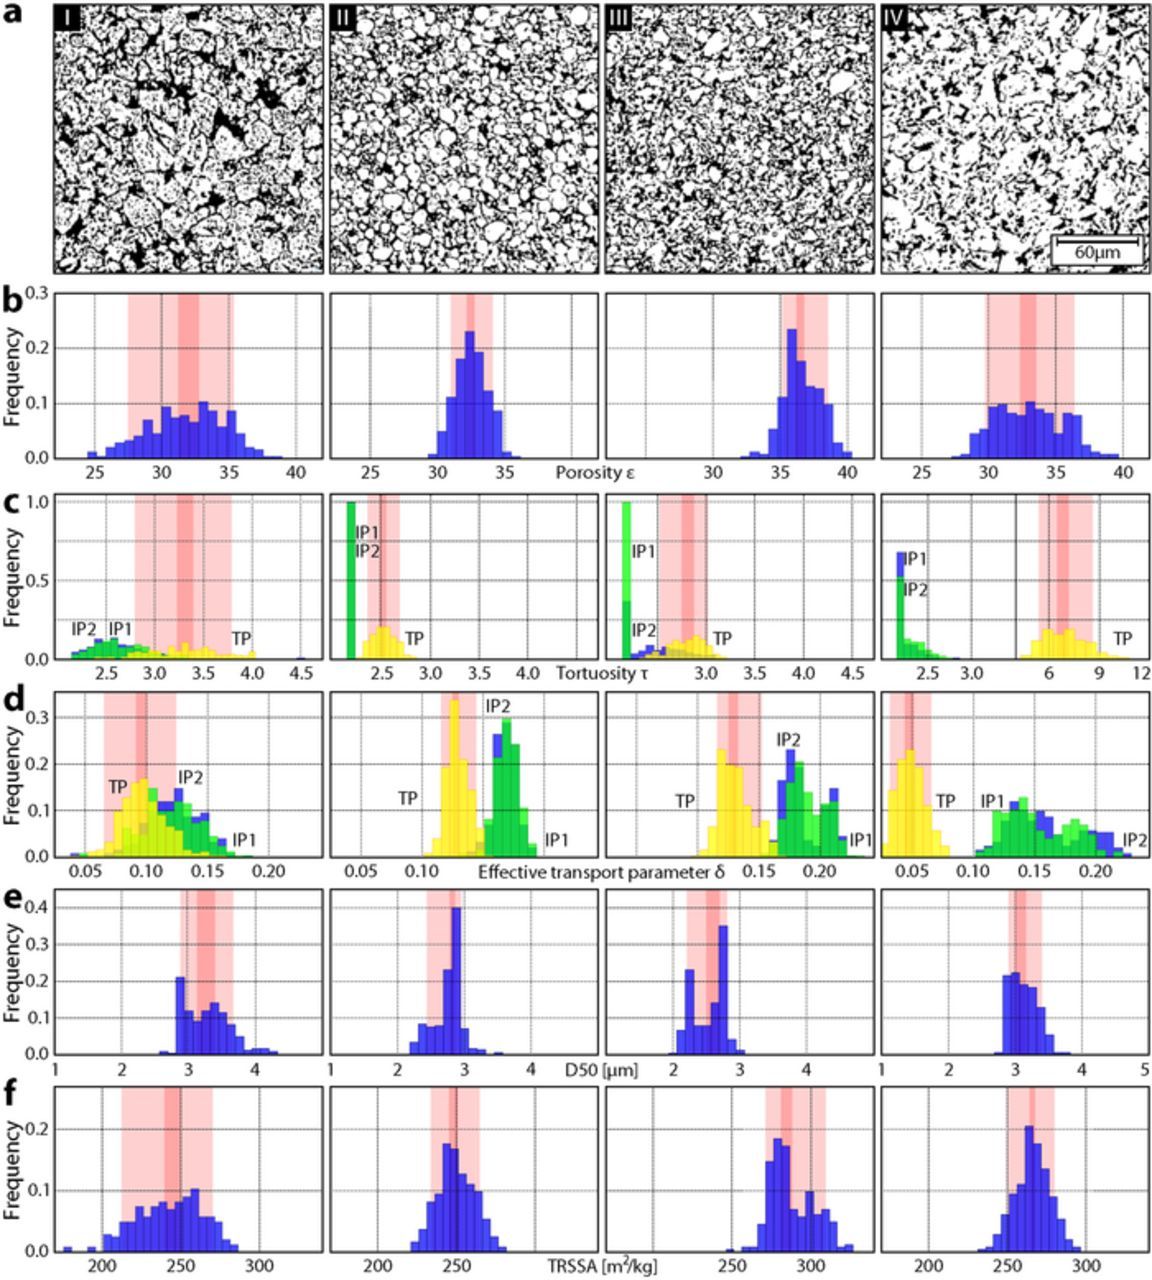
Figure 1. For each of the four electrodes, a subsection of a binarized tomogram (a) is shown together with histograms of the values for (b) porosity, (c) tortuosity, (d) effective transport parameter, (e) particle size (D50 value), and (f) tomographically-reconstructed specific surface area calculated for 243 subvolumes 71.5 μm × 71.5 μm × 32.5 μm in size. In panels (c) and (d) three histograms are shown for each electrode. IP1 (green) and IP2 (blue) indicate the values in the two in-plane (IP) directions (i.e., those parallel to the current collector) while TP (yellow) indicates values in the through-plane direction (i.e., orthogonal to the current collector plane). The pink bars represent the 68%-interval for a confidence of 99% based on a binomial distribution, while the dark pink bars indicate the median interval.
Electrode inhomogeneity has been studied experimentally on the centimeter scale by neutron diffraction, 11,12 and on the micrometer scale by Raman Spectroscopy, 13 via which local variations in SOC and degradation have been observed. The availability of tomographic techniques with (sub-)micrometer resolution enables the study of inhomogeneity at the micrometer length scale in three dimensions. 14 In combination with three dimensional electrochemical simulations, correlations between electrode microstructure and battery performance can be better understood. 15
Here, four different graphitc anodes (labeled I, II, III, and IV) found in commercially available LIBs designed for energy and power applications are imaged using X-ray tomographic microscopy to obtain three-dimensional representations of the microstructure. The types and length scales associated with microstructure inhomogeneity is quantified and three-dimensional electrochemical simulations on representative subvolumes of the imaged microstructure are used to understand the potential impact of microstructural inhomogeneity on electrode performance and cell degradation and safety.
Experimental
X-Ray tomographic miroscopy and data binarization
For each of the four anodes, X-ray tomographic microscopy (XTM) 16 is performed on samples extracted from three distinct locations (i.e., >1 cm apart) of the pristine electrode sheet. Details of the sample preparation and measurement setup are described in the Supplementary Material. Briefly, the samples are cylindrical volumes with a diameter of 0.7 mm that contain the entire electrode thickness (48.75 μm, 68.25 μm, 55.25 μm, and 74.75 μm for electrode I, II, III, and IV, respectively). This field-of-view and a voxel size of 325 nm enables identification of the individual graphite particles in the samples, which range from 5–30 μm in size, while observing approximately 2000 particles per sample. A subsection of a tomogram from each anode is shown in Figure 1a. They reveal different types of graphite particles (the active particles in electrode I, III, and IV are flake-like while electrode II consists of spherical graphite) with varying size distributions and resulting microstructures.
Computational analysis of the microstructure requires preprocessing of the tomograms to differentiate between the pore space and the active material phase (binarization). 17 Here, binarization based on the grayscale value recorded by the X-ray technique is performed. An iteratively applied nonlinear diffusion filter (Perona-Malik algorithm) reduces noise while preserving key image features such as lines and edges (see Supplementary Material Figure S1). 18,19
Errors in the microstructural parameters that result from the binarization procedure (threshold selection and filtering) are discussed in detail by Pietsch et al. 20 Furthermore, while the imaging parameters are well suited for resolving the micrometer-sized graphite particles and provide a large field of view that enables the statistical analysis of microstructural paramenters, the small surface features of the graphite and the binder phase cannot be resolved. Because of the low amount of binder and additives (2–4 wt%) found in commercial anodes, 21 this resolution limitation should not significantly influence the porosity values; however, it does lead to discrepancies between the tomographically reconscructed surface area and the value found by BET measurement 22 and to differences in the tomographically calculated tortusities and those found through electrochemical impedance spectroscopy. 23 Due to the difficulty in imaging the binder phase, it is often added in computationally. 24 Here, we confine our analysis to the microstructural inhomegeneity coming from the active particles.
The raw and binarized tomograms are offered open source to the community and lend themselves to further investigation of the impact of binarization uncertainty and the influence of the binder phase. 25
Microstructural inhomogeneity analysis
Porosity ɛ, tortuosity τ, specific surface area (SSA), and particle size are important microstructural parameters for electrode operation. In the homogenized electrode picture, the influence of electrode geometry is accounted for by the ratio of porosity and tortuosity, 26–28 which is referred to as the effective transport parameter δ (Supplementary Material Table S1). 14,29 The charge transfer process across the electrode-electrolyte interface depends on the respective lithium concentrations in electrolyte and active particles as well as the exchange current density that scales with the surface area. 30 Finally, the lithium distribution within the active particles (concentration gradient) is assumed to be governed by the solid-state diffusion coefficient and the size of the particles. 31 The particle size is quantified with a porosimetry algorithm 32 by calculating the D50 value, which corresponds to the mean effective diameter under the assumption that the particles are spherical.
These microstructural parameters of interest are computed using the software GeoDict (MATH2MARKET GmbH). Microstructural analysis is performed on a volume with in-plane dimensions of 357.5 μm by 357.5 μm (1100 by 1100 voxels) taken from the center of each of the twelve samples. Since tortuosity computed from a Fickian diffusion simulation could depend on the size of the geometry studied, and the four electrodes have different thicknesses ranging from 48.75 μm to 74.75 μm, all subvolumes are truncated to a thickness of 32.5 μm (100 voxels) to enable direct comparison among the electrodes.
To determine the length scale at which microstructural inhomogeneity occurs, a scale space analysis is performed. The concept of scale space analysis comes from signal theory 33,34 and introduces a new dimension, the scale parameter, which enables assessment of the locality of a feature. Here, as previously applied to battery separators, 35 subvolume size is the scale parameter, and microstructural parameters are calculated for subvolume sizes ranging from 17.88 μm to 143 μm (Supplementary Material Figure S2) distributed across the imaged electrode volume. Parameter values calculated for large subvolumes approach the global average for the electrode, while, for small subvolumes, the parameters show dispersion stemming from the fact that the subvolumes approache the length scale of the particles. This scale space analysis indicates that, for all four electrodes, a subvolume size of 71.5 μm × 71.5 μm × 32.5 μm will provide insight into the microstructure of the electrodes and not the size dispersion of the particles (Supplementary Material Figure S3).
Inhomogeneity of the electrodes is assessed statistically by evaluating the different microstructural parameters for the 243 subvolumes of this size per electrode (each of the three samples imaged per electrode is divided into 81 partially overlapping subsamples of this subvolume size as shown in the Supplementary Material Figure S2). The distributions of the microstructural parameters are shown for each electrode in Figures 1b–1f and summarized in Table I.
Table I. Mean and 68%-interval width for a 99% confidence based on a binomial distribution of different microstructural parameters evaluated for the 243, 71.5 μm × 71.5 μm × 32.5 μm subvolumes analyzed for electrodes I–IV.
| Parameter | 99% confidence | I | II | III | IV |
|---|---|---|---|---|---|
| Porosity ɛ | Mean | 31.76 | 32.52 | 36.65 | 33.04 |
| [%] | 68%-interval | 7.65 | 3.14 | 3.40 | 6.47 |
| Tortuosity τ | Mean TP | 3.31 | 2.52 | 2.81 | 6.96 |
| [-] | 68%-interval TP | 0.99 | 0.31 | 0.50 | 3.17 |
| Mean IP | 2.66 | 1.93 | 2.17 | 2.15 | |
| 68%-interval IP | 0.78 | 0.21 | 0.29 | 0.74 | |
| Effective transport δ | Mean TP | 0.098 | 0.129 | 0.131 | 0.049 |
| [-] | 68%-interval TP | 0.047 | 0.025 | 0.037 | 0.030 |
| Mean IP | 0.122 | 0.169 | 0.188 | 0.157 | |
| 68%-interval IP | 0.059 | 0.024 | 0.042 | 0.085 | |
| TRSSA | Mean | 242.9 | 249.7 | 288.2 | 266.1 |
| [m2/kg] | 68%-interval | 55.2 | 30.4 | 36.8 | 29.7 |
| D50 | Mean | 3.29 | 2.76 | 2.54 | 3.13 |
| [μm] | 68%-interval | 0.83 | 0.51 | 0.59 | 0.50 |
All electrodes have mean porosities ɛ between 31% and 37% (Figure 1b). The irregular size and shape of particles in electrode I and IV contribute to regions of high and low porosity, reflected by the large witdh of the 68%-interval in porosity (wI = 7.65%, wIV = 6.47%). The witdh of the 68%-interval therby represents the interval between the 15.9th and the 84.1th percentile computed on a 99% confidence level for a binomial distribution.
Tortuosity τ can be defined in the two in-plane (IP) directions (green and blue in Figure 1c), which describe transport directions parallel to the current collector, and the through-plane (TP) direction (yellow coloring in Figure 1c), which describes transport in the direction perpendicular to the current collector. For all four electrode types, tortuosity is anisotropic, with the TP tortuosity higher than the tortuosity value in the IP direction. While the TP tortuosity for electrodes I, II, and III is similar (around 3), in electrode IV, the TP tortuosity is higher (mean value of 6.96) due to the large, platelet shaped particles oriented parallel to the current collector. 36
IP and TP directions can also be identified for the effective transport parameter δ (Figure 1d). Electrode IV exhibits the worst TP effective transport parameter δ of 0.049 because of its high TP tortuosity value and low porosity. This means that, based on purely structural restrictions, lithium diffusion in the electrolyte filled pore space of the electrode is only 4.9% of the diffusion of lithium in electrolyte alone.
Considering the particle size based on the D50 value (Figure 1e), electrode I is made from the largest particles followed by electrode IV, which has the smallest 68%-interval of particle sizes. As mentioned previously, the calculated specific surface areas (Figure 1f) underestimate the typical values (3'000 m2/kg – 30'000 m2/kg) experimentally obtained from BET measurements. 37–40 This is due to the finite resolution of the tomographic imaging, which does not capture nanometer-scale features on the graphite surface that contribute to the surface area that is accessible by BET measurements. 41 To avoid confusion, the calculated surface areas are thus referred to as the tomographically-reconstructed specific surface area (TRSSA). The TRSSA nonetheless provides insight into particle shape. For example, the mean and 68%-interval of the D50 values for electrodes II and III are close, while the TRSSA value for electrode III is larger than for electrode II. This indicates that the particles in electrode II have a smaller surface to volume ratio than those in electrode III. From visual inspection, this seems plausible since electrode III is made of irregularly shaped flakes while those in electrode II are more spherical (Figure 1a).
Taking the width of the 68%-intervals of the studied parameters as an indication of heterogeneity, electrode I has the most inhomogeneous microstructure. Electrode II is made of regularly shaped spherical particles leading to little variation in porosity, tortuosity, and effective transport parameter and to a relatively small TRSSA. Electrode III exhibits a bimodal TRSSA that comes from inhomogeneity at the electrode scale (Supplementary Material Figure S4). Electrode IV consists of flat, flake-like particles oriented parallel to the current collector, resulting in high TP tortuosity and low effective transport.
Electrochemical simulations
To determine the influence of heterogeneity of microstructural properties on electrode performance, electrochemical simulations are performed with the Battery and Electrochemistry Simulation Tool (BEST), which handles voxel-based microstructures. 30,42,43 As shown schematically in Figure 2a, the simulation environment consists of a porous, three-dimensional electrode microstructure, a 13 μm thick homogenized separator, and a one-voxel thick counter electrode made of pure, non-porous lithium. The pores are filled with electrolyte. Current collectors complete the simulation geometry. The simulation domain has six faces. Two of these are current collectors, where a defined current density is applied. The other four have periodic boundary conditions to minimize edge effects.
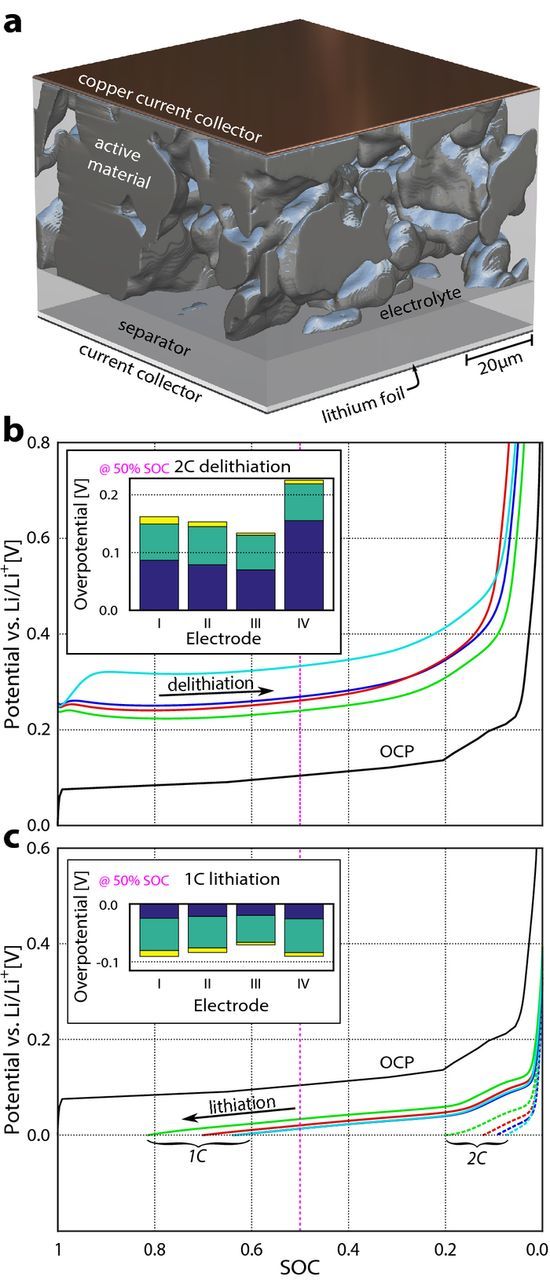
Figure 2. (a) A representation of the simulation environment. (b) Potential curves for 2C delithiation of a representative 71.5 μm × 71.5 μm × 32.5 μm volume for all four electrodes (I blue, II red, III green, and IV cyan). A state of charge (SOC) of 1 refers to fully lithiated graphite. The bar plot inset shows the total overpotential at 50% SOC for each of the four electrodes. The total overpotential consists of the resistance overpotential (dark blue), the activation overpotential (pale green), and the resistance overpotential of the current collectors (yellow). The same is shown in (c) for lithiation at 1C. The lithiation curves at a 2C rate are shown as dotted lines. The solid black line marks the open circuit potential of graphite.
The goal of this study is to assess the influence of the electrode microstructure on electrochemical performance of the four electrodes. Therefore, a single set of simulation parameters is chosen to describe all four electrodes (Supplementary Material Table S2). Parameters are chosen from literature, and a mathematical optimization is performed to achieve the best fit to the experimental electrochemistry values for all four electrodes simultaneously. Because the electrodes contain different graphites, no single set of parameters can be expected to perfectly track the electrochemical behavior of the four electrodes. Nonetheless, reasonable agreement to the experimentally measured electrochemistry is found (Supplementary Material Figure S7). Details of the electrochemical modeling, fitting to the experimental electrochemistry, and limitations to the BEST code are discussed in the Supplementary Material.
Simulations are carried out at a current rate of 2C. Because of the large polarization (Figure 2b), the simulated potential drops below 0V already at a SOC of around 85% during lithiation. This is in accordance with literature that reports the apperance of lithium plating upon lithiation at current rates starting at 1C. 44 Therefore, the impact of the microstructure on the litiation behavior of the electrodes is studied at a current rate of 1C (Figure 2c).
To assess the influence of the microstructure on electrochemical performance, the most representative subvolume (71.5 μm × 71.5 μm × 32.5 μm in size) for each of the four electrodes is simulated during lithium (de)intercalation (Figures 2b and 2c). "Representative" means that the effective transport parameter δ, the particle size (D50 value), and the TRSSA of the subvolume have the same values as the mean values of the entire volume with in-plane dimensions of 357.5 μm by 357.5 μm on which microstructural analysis is performed.
The cell potential θtot (i.e. the potential between the current collectors) is the sum of the SOC-dependent open circuit potential of graphite OCPgraphite, the resistance overpotential in the electrolyte θE, the activation overpotential ηact and the contact resistance overpotential of the current collectors RCC : 30,45

While the OVPGraphite is the same for all electrodes, the resistance overpotential of the electrolyte θE and the activation overpotential ηact modeled by the Butler-Volmer equation, depend on the lithium concentration in the electrolyte, which is influenced by the microstructure of the electrodes.
To assess the influence of microstructure on the electrochemical performance, the total stucture dependent overpotential ηtot, namely the activation overpotential ηact and the resistance overpotential in the electrolyte θE:

is considered.
The overpotentials (ηact and θE) for each of the representative microstructures of the four different electrodes are listed in Table II and highlight the importance of microstructure on electrode performance. A larger TRSSA leads to a lower exchange current density, which results in a lower activation overpotential ηact. A low effective transport parameter δ leads to a large overpotential in the electrolyte θE. Accordingly, electrode IV (with the smallest effective transport parameter of 4.9% compared to 9.8%, 12.9%, an 13.1% for electrodes I, II, and III) shows the highest resitance overpotential in the electrolyte θE during 2C delithiation (155.3 mV in comparison to 86.6 mV, 78.8 mV, and 70.2 mV for electrodes I, II, and III, respectively).
Table II. Activation overpotential ηact and resistance overpotential θE in the electrolyte for all four electrodes during 2C delithiation and 1C lithiation at an SOC of 50%.
| Electrode at 50% SOC | I | II | III | IV |
|---|---|---|---|---|
| ηact [mV] 2C delithiation 1C lithiation | 62.7–55.9 | 66.0–54.5 | 60.0–46.8 | 63.4–58.4 |
| θE [mV] 2C delithiation 1C lithiation | 86.6–24.8 | 78.8–21.7 | 70.2–19.7 | 155.3–25.7 |
Comparison of electrodes II and III points out the advantage of spherical particles. While electrodes II and III have similar effective transport parameters δ (leading to similar resistance overpotentials θE), because electrode II contains more spherical particles, it achieves the effective transport parameter δ with a lower porosity and a lower tortuosity (resulting in a higher energy density electrode). On the other hand, because of its spherically-shaped particles, electrode II exhibits a lower TRSSA and therefore a higher activation overpotential ηact. However, since the resistance overpotential θE dominates the total overpotential at high current rates, the choice of spherical particles is favorable.
The magnitudes of the resistance overpotential θE induced by the effective transport properties during 2C delithiation are larger than the activation overpotentials ηact stemming from the TRSSA values (60 mV–66 mV for θE compared to 70 mV–155 mV for ηact). These results emphasize the importance of designing electrodes with large effective transport. Since low porosities would lead to reduced energy density, electrode tortuosity must be reduced. 36 During lithiation at lower currents (1C), the activation overpotential ηact accounts for the main share (47–58 mV) of the total overpotential compared to 20–27 mV for θE. The reason for that is the strong dependence of the resistance overpotential θE on the current. 46
Results and Discussion
Figure 3a maps the effective transport values δ, the TRRSA, and the particle size D50 values for each of the 243 subvolumes (71.5 μm × 71.5 μm × 32.5 μm) for each electrode. The representative subvolumes of each electrode (simulated in Figures 2b and 2c) are indicated with symbols.
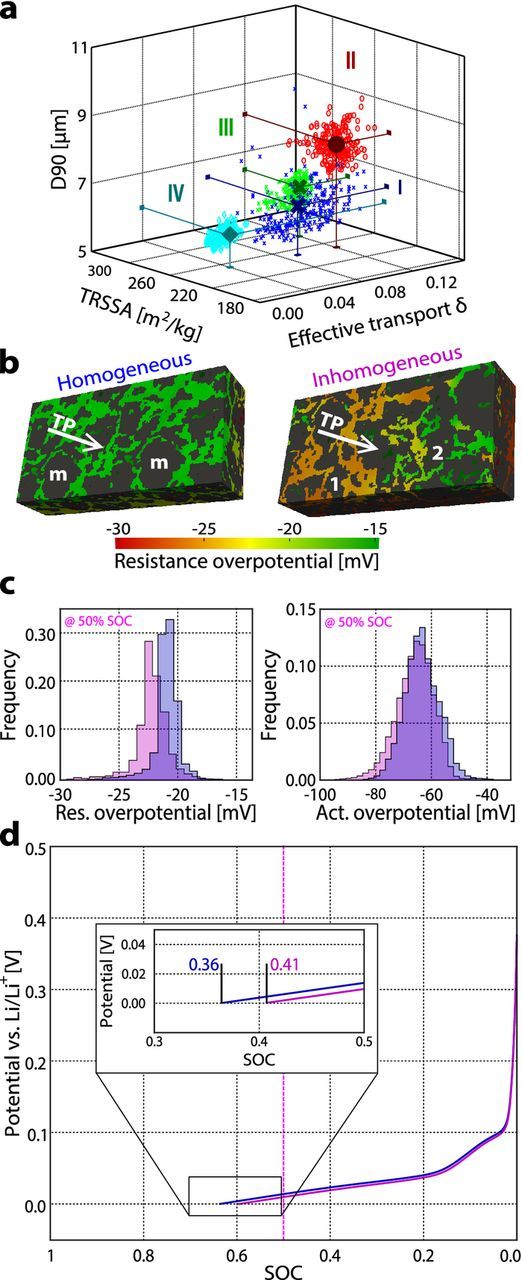
Figure 3. (a) Scatter plot of the microstructural parameter values for the 71.5 μm × 71.5 μm × 32.5 μm subvolumes for electrode I (blue "x"), II (red "o"), III (green "+"), and IV (cyan triangles). (b) Distribution of the resistance overpotential in the electrolyte of a homogeneous electrode (two mean subvolumes combined) and an inhomogeneous electrode (subvolumes 1 and 2 combined) at an SOC of 50% during 1C lithiation. (c) The resistance and activation overpotentials at an SOC of 50% shown in bar plots in blue for the homogeneous structure and pink for the inhomogeneous structure. (d) Potential curves of the homogeneous (blue) and inhomogeneous (pink) microstructures during 1C lithiation.
The impact of microstructural inhomogeneity on electrochemical performance is studied using electrode I. In addition to the representative subvolume, six subvolumes (labeled 1–6) of electrode I are selected: subvolumes 1 and 2 have the same mean TRSSA and D50 value as electrode I and an effective transport parameter that is either at the lower (for subvolume 1) or upper (for subvolume 2) limit of the 68%-interval. Subvolumes 3 and 4 have an effective transport parameter δ and a D50 value that corresponds to the mean value of the entire electrode I and a TRSSA that is at the lower (for subvolume 3) or upper (for subvolume 4) limit of the 68%-interval of electrode I. Subvolumes 5 and 6 are chosen analogously with mean values for TRSSA and effective transport parameter and smaller (subvolume 5) and bigger (subvolume 6) values for the particle size (D50 value). The values for the microstructural parameters for all five subvolumes are provided in Table III.
Table III. Effective transport parameter δ, TRSSA, and particle D50 values of subvolumes 1–6 of electrode I. The simulated overpotentials at 50% SOC and the SOC corresponding to 0.8 V vs. Li/Li+ during delithiation at 2C are provided. The percentages indicate the deviation compared to the mean values of electrode I.
| Subvolume | 1 | 2 | 3 | 4 | 5 | 6 | Mean |
|---|---|---|---|---|---|---|---|
| Effective transport δ | 0.076 -22% | 0.151 +54% | 0.098 | 0.098 | 0.098 | 0.098 | 0.098 |
| TRSSA [m2/kg] | 242.9 | 242.9 | 213.9 -12% | 269.1 +11% | 242.9 | 242.9 | 242.9 |
| D50 [μm] | 3.29 | 3.29 | 3.29 | 3.29 | 2.90 -12% | 3.73 +13% | 3.29 |
| θE at 50% SOC [mV] | 89.6 +6% | 78.8 -7% | 84.8 | 84.4 | 84.5 | 84.6 | 84.5 |
| ηact at 50% SOC [mV] | 60.8 | 61.8 | 66.7 +9% | 57.5 -6% | 61.0 | 61.4 | 61.2 |
| SOC at 0.8V | 0.949 | 0.950 | 0.949 | 0.950 | 0.955 +1% | 0.942 -1% | 0.949 |
Using the six subvolumes of electrode I, the influence of variation in effective transport parameter δ, TRSSA, and particle size can be isolated. For a delithiation simulation at a current rate of 2C, the difference in overpotential between subvolumes 1 and 2 stems solely from the resistance overpotential in the electrolyte (θE 10.8 mV higher for subvolume 1). Since the TRSSA and particle size take on the mean values, the activation overpotential ηact is nearly the same (60.8 mV and 61.8 mV). The smaller TRSSA of subvolume 3 (−12%) leads to a larger activation overpotential ηact (+9%), while increasing the TRSSA by 11% for subvolume 4 decreases the activation overpotential ηact by 6%. θE stays almost unaffected. The influence of the particle size can be seen in the retrieved capacity at 0.8 V. For subvolume 5 with smaller particles (−12% in D50 value), the SOC is 95.5 at 0.8 V while it is slightly lower (94.2) for subvolume 6 that has larger particles.
These results indicate that electrode microstructural inhomogeneity can lead to different overpotentials in different parts of the electrode (Figure 3b). To maintain any given effective current through electrode I, a region with the properties of subvolume 2 will have to support a higher current than subvolume 1. To show this, the electrochemical performance of an "inhomogeneous electrode" (i.e., one constructed by combining subvolumes 1 and 2) is compared to that of a "homogeneous electrode" (i.e., one constructued by combining two mean subvolumes) during lithiation at 1C. The histograms in Figure 3c support the hypothesis of the inhomogeneous structure having higher overpotentials than the homogeneous one even though the effective transport parameter is slightly worse for the homogeneous structure.
In addition to causing unwanted potential drops in the cell, microstructure inhomogeneity and the resulting heterogeneous overpotentials can lead to degradation and safety issues. The simulations show that during lithiation, the resistance overpotential due to the finite conductivity of the electrolyte (θE) in addition to the activation overpotential (ηact) can lead to regions of the electrode with potentials below 0 V vs. Li/Li+. This is the condition for lithium plating, which means decreased capacity and potential safety issues 47,48 and is reached earlier by an electrode showing higher inhomogeneity (Figure 3d). Assuming two electrodes have the same mean microstrutural parameters and the same material composition, the homogeneous electrode can thus be considered safer than the inhomogenous electrode having regions of better and worse transport.
Summary
X-ray tomographic reconstructions of four commercial electrodes are provided open source to the community in their raw and binarized form, and an example of the type of insights that can be gained from such 3D data is provided.
Analysis of the microstructural parameters of the anode indicate that commercial electrodes exhibit inhomogeneity at different length scales. Distributions in particle sizes and shapes result in inhomogeneity of the microstructure at the 100 μm length scale, while variations in manufacturing can lead to microstructures that show differences in samples taken centimeters apart.
Electrochemical simulations on the 3D reconstructed volumes indicate that, during delithiating of graphite electrodes, the effective transport δ parameter plays the most important role in cell performance, leading to overpotentials of up to 155.3 mV at 50% SOC. During lithiation at only 1C, the surface area related activation overpotential of up to 58.4 mV current accounts for the largest part of the total overpotential. These overpotentials are particularly problematic during lithiation of a graphite electrode since it can cause the local potential of the electrode to drop below 0 V vs. Li/Li+ leading to lithium plating.
The impact of an inhomogeneous microstructure is shown by constructing a homogeneous electrode and an electrode consisting of regions with different microstructural properties. The simulation results show that regions with bad transport properties lead to increased stress on adjacent regions with good effective transport compared to a more uniform electrode. This work highlights the importance of designing graphite anodes that are homogeneous and have high effective transport parameters.
ORCID
Jens Eller 0000-0002-9348-984X
Vanessa Wood 0000-0001-6435-0227
Supplementary data (3.7 MB, PDF)