
Abstract
A model of a lithium-metal battery with a CoO2 positive electrode has been modeled in order to predict the movement of lithium in the negative electrode along the negative electrode/separator interface during cell cycling. A finite-element approach was used to incorporate an intercalation positive electrode using superposition, electrode tabbing, transport using concentrated solution theory, as well as the net movement of the lithium electrode during cycling. From this model, it has been found that movement of lithium along the negative electrode/separator interface does occur during cycling and is affected by three factors: the cell geometry, the slope of the open-circuit-potential function of the positive electrode, and concentration gradients in both the solid and liquid phases in the cell.
Export citation and abstract BibTeX RIS
Electrochemical batteries have been used as convenient and relatively safe portable energy-storage devices for many years; and, with the development of rechargeable-battery technology, batteries have become an everyday dependence. With the progression of technology, the demand on rechargeable portable energy has increased to a point where, in certain applications, energy density is the limiting factor. More recently, the push toward widespread use of rechargeable batteries for powering vehicles along with other high-energy-demand applications has gained in popularity. Thus, there has been a large increase in the need for improved energy density in rechargeable batteries.1 For example, while nickel-metal hydride batteries are an acceptable solution for hybrid-electric vehicles (HEVs), the move toward fully electric vehicles such as plug-in hybrids (PHEVs) and eventually electric vehicles (EVs) will require higher-energy-density batteries. Several new battery technologies have been proposed; however, a long-time favorite has been lithium-metal batteries due to their high theoretical energy density.1–3 By replacing the standard graphite electrode with a solid lithium electrode, the size and weight of the battery are significantly reduced.1
Although the benefits of lithium-metal batteries are clear, there are several failure mechanisms that occur during cycling of the batteries. The most critical of these mechanisms and the most researched is the control of the electrode/electrolyte interface, primarily dendrite growth at the lithium surface during charging, which has been shown to cause shorting.4–6 The regime of stability in which dendrite propagation is repressed, found through modeling dendrite growth, has been shown to occur when the shear modulus of the separator is greater than that of lithium metal.5 There are currently two main methodologies that are being researched to inhibit dendrite growth. The first, is to create a polymer separator with acceptable ionic conductivity that has a shear modulus greater than that of lithium,1,7–9 and the second is to protect the anode with a ceramic that is conductive to lithium ions.10,11 However, even if dendrites can be prevented, it is likely that gradual redistribution will occur due to a rearrangement of the lithium over large length scales, on the order of centimeters. For example, an increase in the thickness of the lithium metal near the negative tab has been predicted in the model described in this paper.
This paper operates under the assumption that dendrite formation can be prevented through the use of a polymer separator or ceramic protective layer and looks instead into the possibility that anodic lithium redistribution could occur. Due to the difficulty in cycling lithium-metal batteries and the extensive focus on solving the dendrite problem, very little has been published on large-scale redistribution in batteries. Redistribution due to the mechanisms described in this paper have not been studied before. However, redistribution due to significantly different mechanisms has been observed in other chemistries, such as zinc secondary electrodes.12,13
In order to capture the behavior of interest, electrode tabbing has been included (Figure 1) where, during discharge, the current is drawn from the top of the positive tab and inserted into the bottom of the negative tab. A moving boundary will also be included along with an intercalation electrode as the cathode. Here, the y dimension of the model is through the thickness of the cell sandwich, which can be seen to be 200 μm thick, and the x dimension is taken to be along the length of the unwound cell sandwich and is 50 cm long. Tabs leading to the external leads of the cell are found at opposite corners of the cell. The positive current collector is aluminum, and the positive and negative tabs are copper. The positive electrode is modeled as a typical CoO2 porous intercalation electrode found in the literature.14–19 Here (figure 1), the positive electrode active material particles have been drawn out of proportion to aid in the visualization of the model geometry. The separator is modeled as a liquid electrolyte, and the negative electrode is lithium metal. The negative electrode in this model is twice the thickness necessary in order to remove the necessity of a separate negative current collector. All graphs presented later, unless specifically noted, are along the interface between the separator and the negative electrode (shown as the thick line in figure 1). This constitutes a through-plane cross-section of, what could be considered, a typical 18650 cell construction.
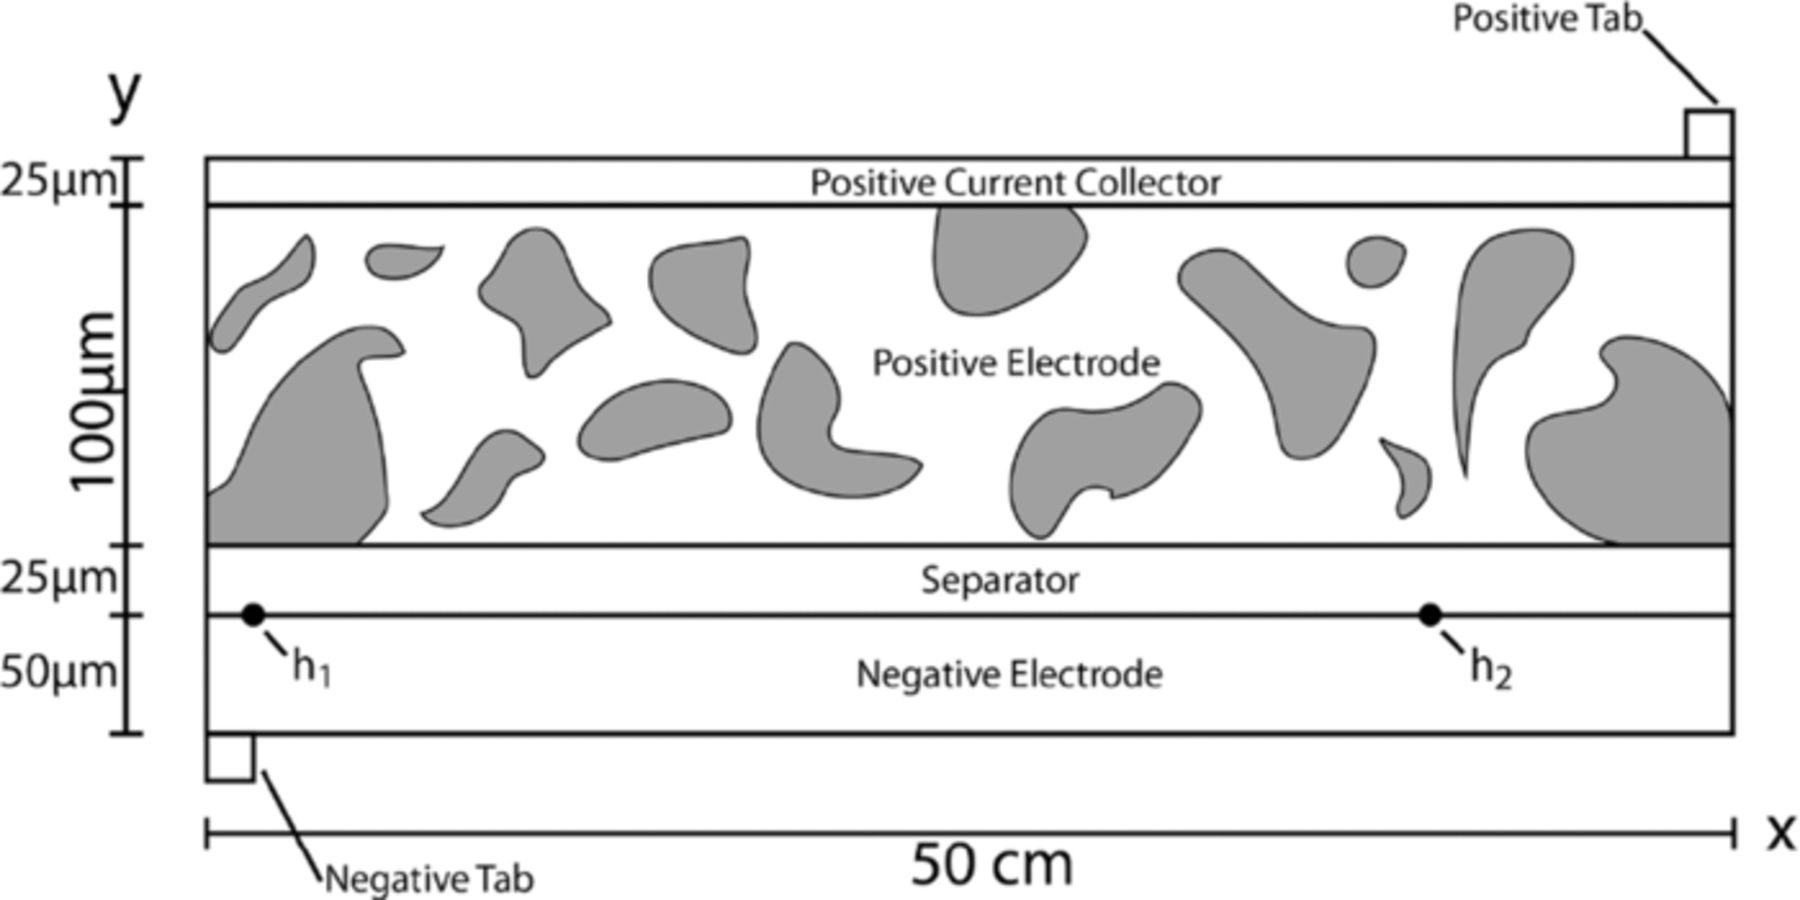
Figure 1. Two-dimensional model geometry of a lithium-metal battery, consisting of a lithium-metal negative current collector, a lithium-metal negative electrode, a liquid-electrolyte separator, composite cathode, and aluminum positive current collector.
Methods
In this work, modeling was done using COMSOL Multiphysics, which uses a finite-element approach. The model geometry, shown in Fig. 1, attempts to recreate a standard battery configuration. The negative electrode is modeled as a lithium metal layer with a varying, finite thickness, and the positive electrode consists of porous LiCoO2. Film formation at the lithium/separator interface and volume changes of the positive electrode and of the overall cell were not considered. The separator is a liquid electrolyte which is assumed to fill any gaps when the lithium shrinks during discharge and moves into excess head space as the thickness of the lithium anode thickens during charge. In other words, the separator is able to expand and contract freely with the movement of the negative electrode, thereby keeping the total volume of the cell sandwich constant. The free electrolyte allows for the free movement of the lithium anode and results in the worst-case scenario of lithium migration during cycling. If, for example, a polymer separator that has mechanical properties such that dendrites propagation is mitigated (as seen in the work by Monroe and Newman5) were used in place of the liquid electrolyte, it is expected that the results of the shape change would be altered significantly. The expectation, and the preliminary findings, are that the dendrite-inhibiting polymer separator significantly represses the movement of the lithium by providing a force opposite to the migration similar to its repression of the propagation of dendrite formation. This is of significant interest to the authors and further work on the effect of the separator on the movement of lithium is being investigated.
The cell was modeled as a two-dimensional model coupled to a pseudo three-dimensional model. The two-dimensional model has the x and y dimensions, labeled in Fig. 1, constituting the length along the unwound cell and the thickness through the cell sandwich, respectively. The pseudo three-dimensional model (not shown), takes the x and y dimensions from the positive electrode of the two-dimensional model. The pseudo third dimension is the r-dimension and constitutes the redial position in the active-material particles in the positive electrode. Transport in the separator is modeled with concentrated solution theory with the assumption of a binary electrolyte. Thus, the transference number of the lithium ion, the electrical conductivity, and the diffusion coefficient of the lithium salt characterize transport in the separator and are held as constants.
All equations were based on the papers by Doyle et al. and Fuller et al.14–18 and Newman and Thomas-Alyea19 and are treated in more detail there, but are repeated here for clarity. Modification includes expanding the equations for use in a two-dimensional model and adding in a moving boundary at the interface between the negative electrode and the separator that moves stoichiometrically with the amount of current passed. The moving boundary is incorporated using a deformed mesh, and the movement is calculated by using Faraday's Law and the density of lithium to convert the local current density into the velocity of the moving boundary.
Beginning with the liquid-electrolyte separator, a material balance on the salt is given by,
![Equation ([1])](https://content.cld.iop.org/journals/1945-7111/159/10/A1615/revision1/jes_159_10_A1615eqn1.jpg)
Here we assume that the solvent concentration is not a function of the electrolyte concentration15 and that the transference number is constant.17 The potential in the liquid phase is governed by an extended Ohm's law,
![Equation ([2])](https://content.cld.iop.org/journals/1945-7111/159/10/A1615/revision1/jes_159_10_A1615eqn2.jpg)
where we assume that the conductivity and transference number are constant. Currently the activity coefficient f± is assumed to be constant, but, if data are available, the variation will be included here.
It should be noted here that the convection terms, although perhaps relevant due to the moving boundary and liquid electrolyte, have been left out of the previous equations. This is due to the small effect that the concentration gradients have on the movement of the lithium and for the sake of simplicity. For a more detailed explanation please refer to the "Diffusivity" subsection.
At the interface between the separator and the lithium anode, a charge-transfer reaction occurs following Butler-Volmer kinetics.15 Since the separator is assumed to be a liquid electrolyte, the reaction takes the form
![Equation ([3])](https://content.cld.iop.org/journals/1945-7111/159/10/A1615/revision1/jes_159_10_A1615eqn3.jpg)
and the general form of the kinetic expression is taken to be
![Equation ([4])](https://content.cld.iop.org/journals/1945-7111/159/10/A1615/revision1/jes_159_10_A1615eqn4.jpg)
where ηs is the local value of the surface overpotential,
![Equation ([5])](https://content.cld.iop.org/journals/1945-7111/159/10/A1615/revision1/jes_159_10_A1615eqn5.jpg)
U1 is the theoretical open-circuit potential, and i0 is the exchange current density, which is taken from Albertus,20 where it is assumed to be
![Equation ([6])](https://content.cld.iop.org/journals/1945-7111/159/10/A1615/revision1/jes_159_10_A1615eqn6.jpg)
where K is the reaction rate constant and c2 is the local concentration of salt in the separator. The boundary conditions for these equations include the flux of lithium ions at the lithium/separator interface equaling the net transfer of current at that interface. The flux and concentration of each species as well as the potential in solution are taken to be continuous between the separator and the positive electrode.
The positive electrode consists of an inert conducting material, the liquid electrolyte phase, and the solid active-material insertion particles. These phases are treated as superimposed continua, and the material balance in the liquid phase is
![Equation ([7])](https://content.cld.iop.org/journals/1945-7111/159/10/A1615/revision1/jes_159_10_A1615eqn7.jpg)
where ɛ2 is the volume fraction of the electrolyte in the positive electrode and a is the specific surface area or surface area of the active material per volume of the cathode. The pore-wall flux ( jn) is related to local current density and to the divergence of the current in the electrolyte phase through
![Equation ([8])](https://content.cld.iop.org/journals/1945-7111/159/10/A1615/revision1/jes_159_10_A1615eqn8.jpg)
The current flowing in the electrolyte is governed by equation 2 with the addition that the pore wall flux is active in this domain. Here the diffusivity and conductivity are effective values through the Bruggeman equation.21
![Equation ([9])](https://content.cld.iop.org/journals/1945-7111/159/10/A1615/revision1/jes_159_10_A1615eqn9.jpg)
Although the diffusivity, conductivity, and transference number are known functions of concentration, they are currently held as constants. The boundary condition in the solution phase of the positive electrode is such that the fluxes of the species are zero at the positive current collector/positive electrode boundary.
Due to the large surface area of the positive electrode, the kinetics fall in the linear regime; therefore the kinetic expression in the positive electrode is simplified to linear kinetics where
![Equation ([10])](https://content.cld.iop.org/journals/1945-7111/159/10/A1615/revision1/jes_159_10_A1615eqn10.jpg)
Equation 5 defines the surface overpotential, ηs where the open-circuit potential U1 is a function of the surface concentration of lithium in the solid c1, which is calculated in equation 13. The reaction in the positive electrode is
![Equation ([11])](https://content.cld.iop.org/journals/1945-7111/159/10/A1615/revision1/jes_159_10_A1615eqn11.jpg)
where x varies between 0 and 0.5. The exchange current density is given by
![Equation ([12])](https://content.cld.iop.org/journals/1945-7111/159/10/A1615/revision1/jes_159_10_A1615eqn12.jpg)
where (c1max − c1) is the concentration of unoccupied sites in the insertion material.
The active material in the cathode is assumed to be made up of spherical particles of a constant radius Rp with diffusion being in the r-direction only, and the transport of lithium in the solid phase is governed by
![Equation ([13])](https://content.cld.iop.org/journals/1945-7111/159/10/A1615/revision1/jes_159_10_A1615eqn13.jpg)
where c1 represents the concentration of lithium in the solid particle. A separate three-dimensional model is used to solve equation 13, where the x and y dimensions are those taken from the positive electrode in the two-dimensional model and the third dimension is the r-dimension which is out of the solid active-material particles. The boundary condition at the surface of the particles (r = Rp) is
![Equation ([14])](https://content.cld.iop.org/journals/1945-7111/159/10/A1615/revision1/jes_159_10_A1615eqn14.jpg)
where the pore-wall flux is calculated in the cathode of the two-dimensional model. Equation 13 is then solved numerically in the three-dimensional active-material model, and the solution at the boundary r = Rp is used in the two-dimensional model to solve for the exchange current density seen in equation 12. Due to spherical symmetry, the second boundary condition for the three-dimensional model is
![Equation ([15])](https://content.cld.iop.org/journals/1945-7111/159/10/A1615/revision1/jes_159_10_A1615eqn15.jpg)
The potential in the solid phase, which includes the current collectors as well as the negative and positive electrodes, is governed by Ohm's law
![Equation ([16])](https://content.cld.iop.org/journals/1945-7111/159/10/A1615/revision1/jes_159_10_A1615eqn16.jpg)
and the current in the two phases is conserved through the equation
![Equation ([17])](https://content.cld.iop.org/journals/1945-7111/159/10/A1615/revision1/jes_159_10_A1615eqn17.jpg)
Thus the current flows through either the liquid electrolyte or the solid phase. The boundary conditions are such that the potential in the solid phase, ϕ1, is arbitrarily set to zero along the bottom of the negative tab, and a uniform current in the solid phase,  is set along the top of the positive tab.
To restate, diffusion in the electrolyte is governed by equation 1 for the separator and equation 7 for the positive electrode. The potential in the liquid phase of the separator and the positive electrode is governed by equation 2. The potential in the solid phase is governed by Ohm's law. The reaction kinetics in the positive electrode is linear and are Butler-Volmer (Eq. 4) at the negative electrode/separator interface (Eq. 10). Finally, equation 13 governs the solid-phase diffusion of the lithium in the positive electrode.
The problem is now completely specified and is solved numerically at every time step and position.
Results and Discussion
Transport properties used in the model are listed in Table I. The total volume as well as the porosities of the battery are assumed to be constant throughout the cycling of the battery. This means that, during discharge, the separator is assumed to fill in the void left by the lithium removed and on charging, the separator shrinks, allowing for the growth of the lithium plate. Thus, as the negative electrode shrinks on discharge, the separator expands keeping the total volume of the cell constant. In other words, the distance between the current collectors remains constant.
Table I. List of the model parameters used in this paper. The table shows both the adjustable parameters and those that are electrode specific.
| System Specific | Adjustable | |||
|---|---|---|---|---|
| Parameter | Value | Ref. | Parameter | Value |
| D1 | 5×10⁻¹³m2/s | 25 | T | 298 K |
| D2 | 7.5×10⁻¹¹m2/s | 26 | Rp | 4 μm |
| κcathode | 3.7 S/m | 18 | c10 | 26,000 mol/m3 b |
| κsoln. | 1.3 S/m | 26 | c20 | 2000 mol/m3 b |
| κCCa | 1.0776×10⁷ S/m | - | ɛ2 | 0.3 |
| κCCc | 3.546×10⁷ S/m | - | ||
| α1, α2 | 0.5 | a | ||
| t+ | 0.363 | 17 | ||
| K | 6.1×10⁻⁶ mol0.5/m0.5-s | 20 | ||
a Data are not available for these parameters. b Value given as initial condition.
The lithium-metal battery was cycled galvanostatically at four different rates beginning with a discharge, followed by a rest period of 1000 seconds, and completed by a charge at the same rate and duration as the discharge. The rest period of 1000 seconds was chosen because it was a convenient number larger than the time constant for diffusion of the electrolyte through the cathode and separator. To be sure that the rest period is not affecting the simulation results, the model was also cycled with a rest period after discharge of 20,000 seconds with similar results (less than a 5% difference). All rate calculations are based on the positive electrode. The four charge rates are a 0.1-C rate, corresponding to a 10 hour discharge rate, a 0.2-C rate, corresponding to a 5 hour discharge rate, a 0.5-C rate, corresponding to a 2 hour discharge rate, and a 1-C rate. All cycles were run to a time corresponding with a 50 percent depth of discharge based on the positive electrode, meaning that the cell cycles between Li0.5CoO2 and Li0.75CoO2. The average lithium removed during discharge was 9.98 μm, which is approximately 1/5 the total amount of lithium available. The current needed for a given C rate was calculated from the theoretical current needed to achieve a 1 hour discharge rate at the positive electrode. The time of the discharge was calculated based on the theoretical time required to fill 50 percent of the available capacity in the positive electrode. The maximum concentration of lithium in the positive electrode (c1max) was assumed to be one lithium atom per CoO2 molecule with a starting concentration of 26,000 mol/m3 or roughly 50 percent of the maximum concentration.
Figure 2 shows the initial dimensionless current density for the 0.2-C rate along the negative electrode/separator interface. The dimensionless current density was calculated by dividing the local current density by the average current density. Here the asymmetric current distribution can be clearly seen with the minimum current occurring at about 0.74 in the x direction and achieving about 97 percent of the average current. The tendency for the current to pass through the left side of the battery is due to the fact that the resistance of the negative electrode is roughly four times higher than that of the positive current collector. Thus, the current would rather travel along the positive current collector, which is less resistive, leading to a left-biased current density.
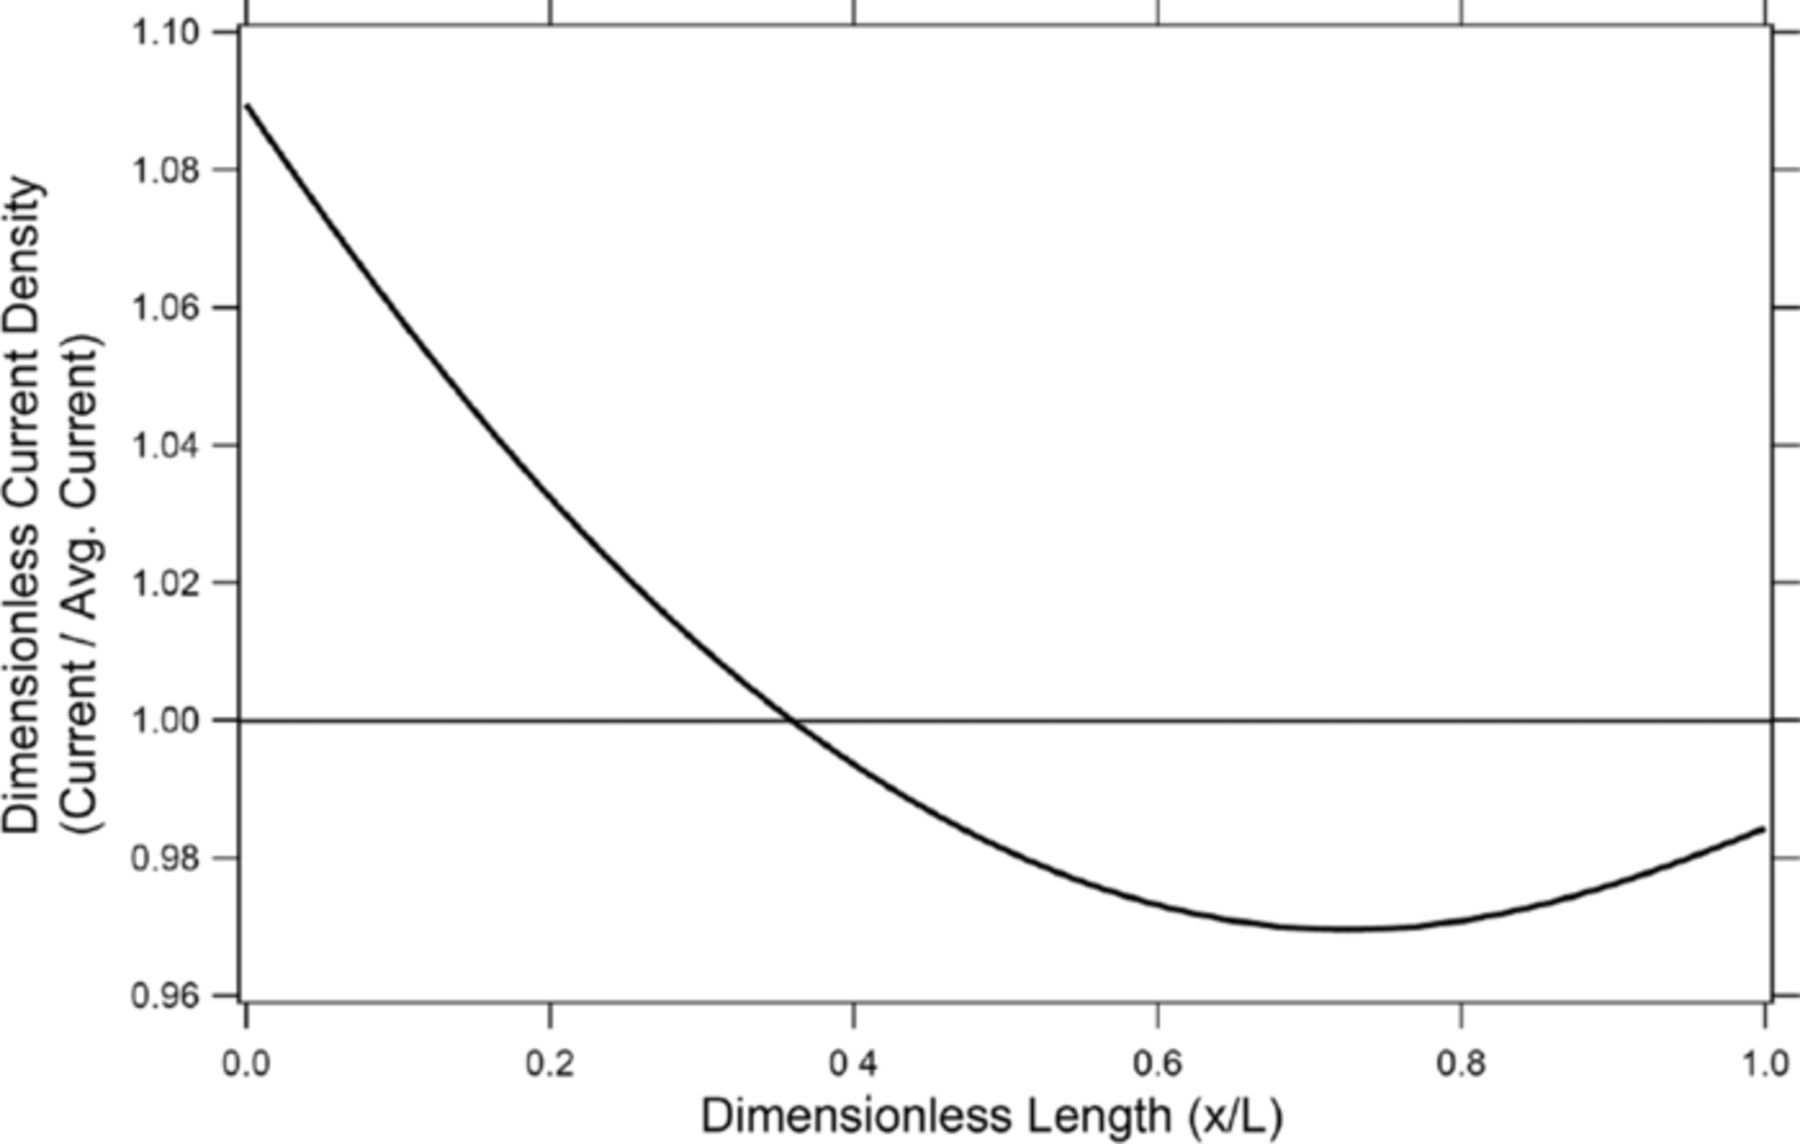
Figure 2. Dimensionless current density along the negative electrode/separator interface at the beginning of discharge at a C/5 rate.
Cell Geometry
In this model, the geometry of the cell strongly affects the movement of the lithium negative electrode during cycling of the cell. The magnitude of the asymmetry of the current density seen in figure 2 is a direct result of the large length to thickness ratio. For the purpose of this discussion, the physical dimensions of the cell and the conductivities were kept constant, and the effective length to thickness ratio was changed through the addition of tabs to the standard geometry of figure 1. Each tab along the positive electrode passed the same current such that the total current remained the same throughout the addition of tabs. It should be noted that the same effect could be achieved by either changing the physical dimensions of the cell geometry or by changing the conductivities of the positive current collector or negative electrode. For example, by changing the conductivity of the negative electrode (by adding a current collector) to have the same conductivity as that of the positive current collector, one can achieve similar results to that of the system with two tabs along both the top of the positive electrode and the bottom of the negative electrode. Similarly, by making the positive current collector more resistive than the negative, one can achieve the mirror image of the 1 Tab line in figure 3, meaning that the lithium would be removed more toward the right side of the cell where x/L = 1.
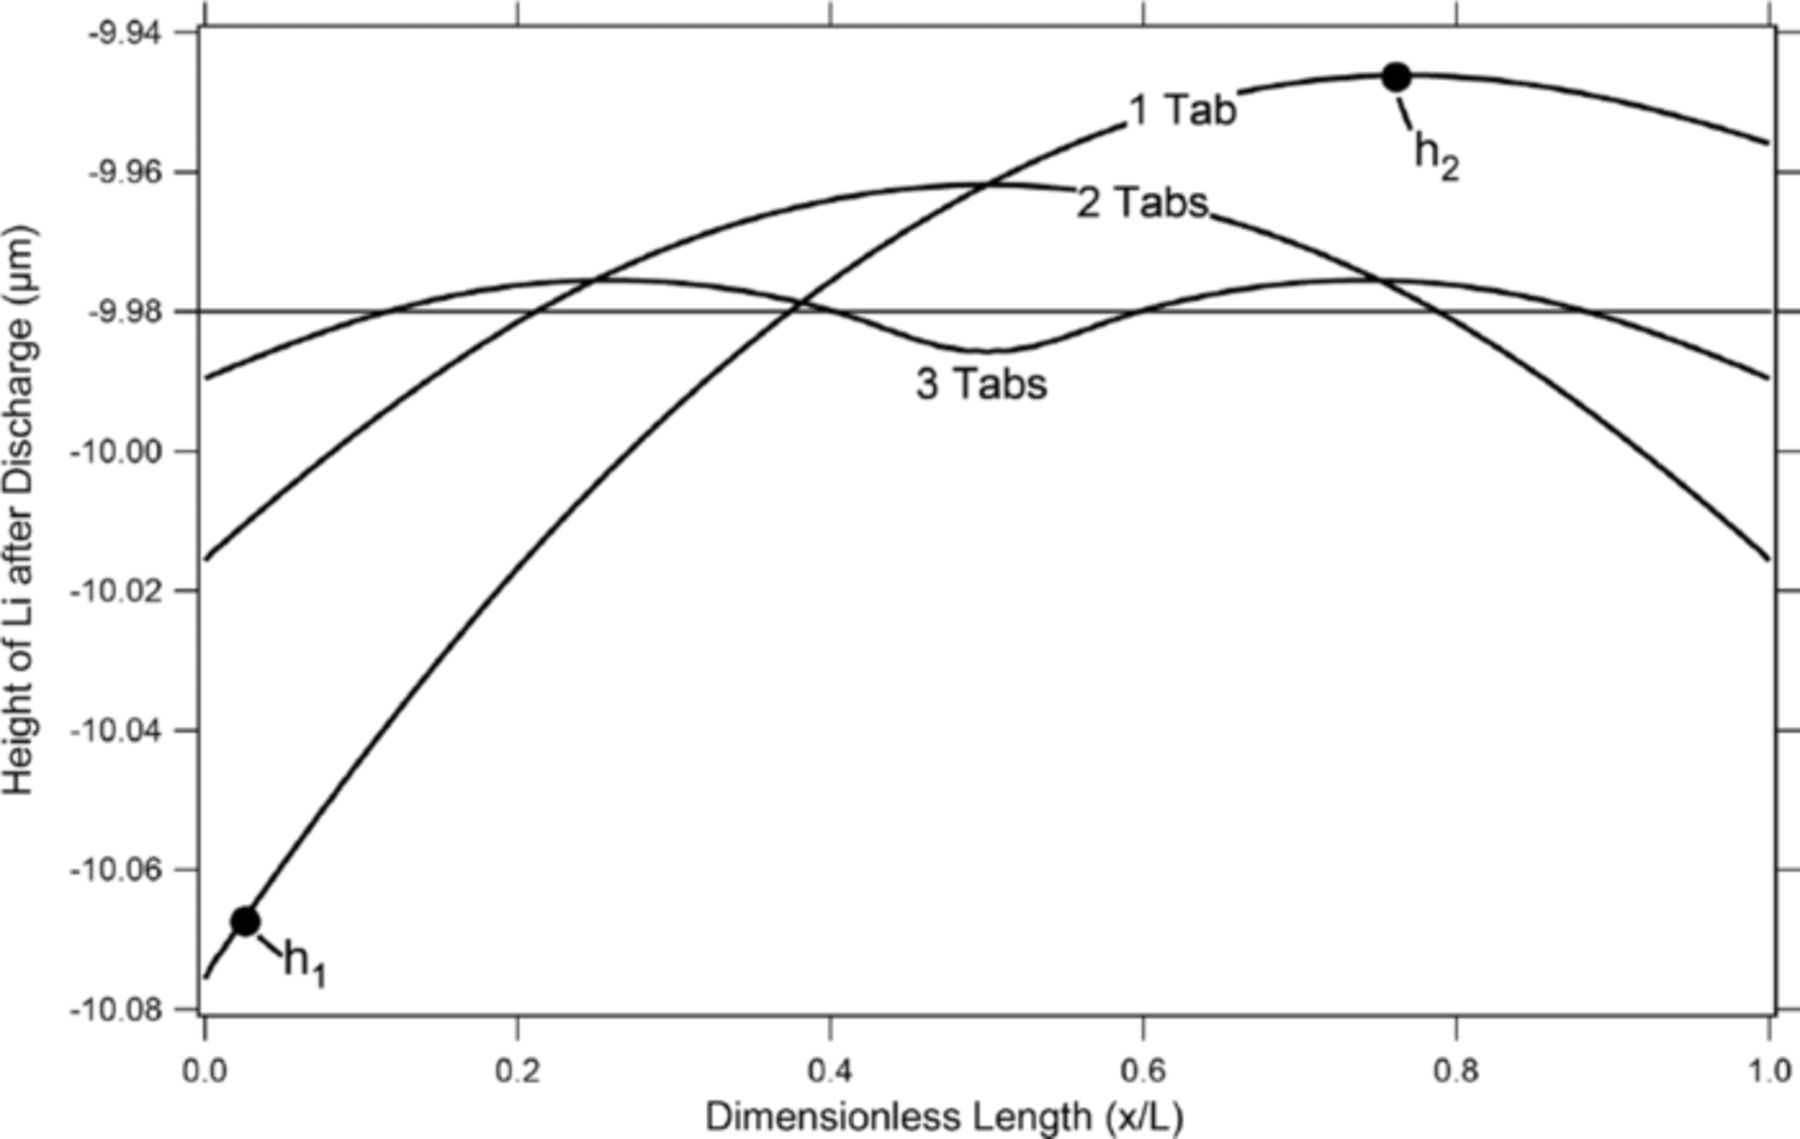
Figure 3. Height of the lithium negative electrode relative to its starting location with varying tab geometries after a discharge at a C/5 rate for 2.5 hours.
For this section, the model was discharged once at a C/5 rate for 2.5 hours for each of the tab geometries described, and the results of the change in the height of the lithium relative to its starting location are plotted in figure 3.
In this paper, four different tab geometries were used. The first was the standard configuration seen in fig. 1, where the positive and negative tabs were placed at opposite corners of the cell. The results of this arrangement can be seen in both figures 3 and 4, where there is an asymmetric bias of the change in the height of the negative electrode interface toward the negative-electrode tab. One more tab was then added to both of the remaining corners of the cell, making the tab configuration symmetric and leaving the cell with two tabs on each electrode, one at each corner. A uniform current was applied at each of the two positive tabs such that each passed half of the total current. The result of this symmetric tab placement was as expected, forcing the shape change to be symmetric as well. Next, one tab was placed half way between the two tabs along both the top and the bottom of the cell leaving the cell with three tabs evenly spaced at each electrode. Again, a uniform current was applied at each of the three positive tabs such that each passed one third of the total current. As expected, increasing the number of tabs forces the current density to become more uniform. This means that the degree of shape change diminishes with the end result being that if one had a continuous tab along both the positive and negative electrodes, the reaction rate would be completely uniform, and there would be no movement of lithium along the x axis at all.
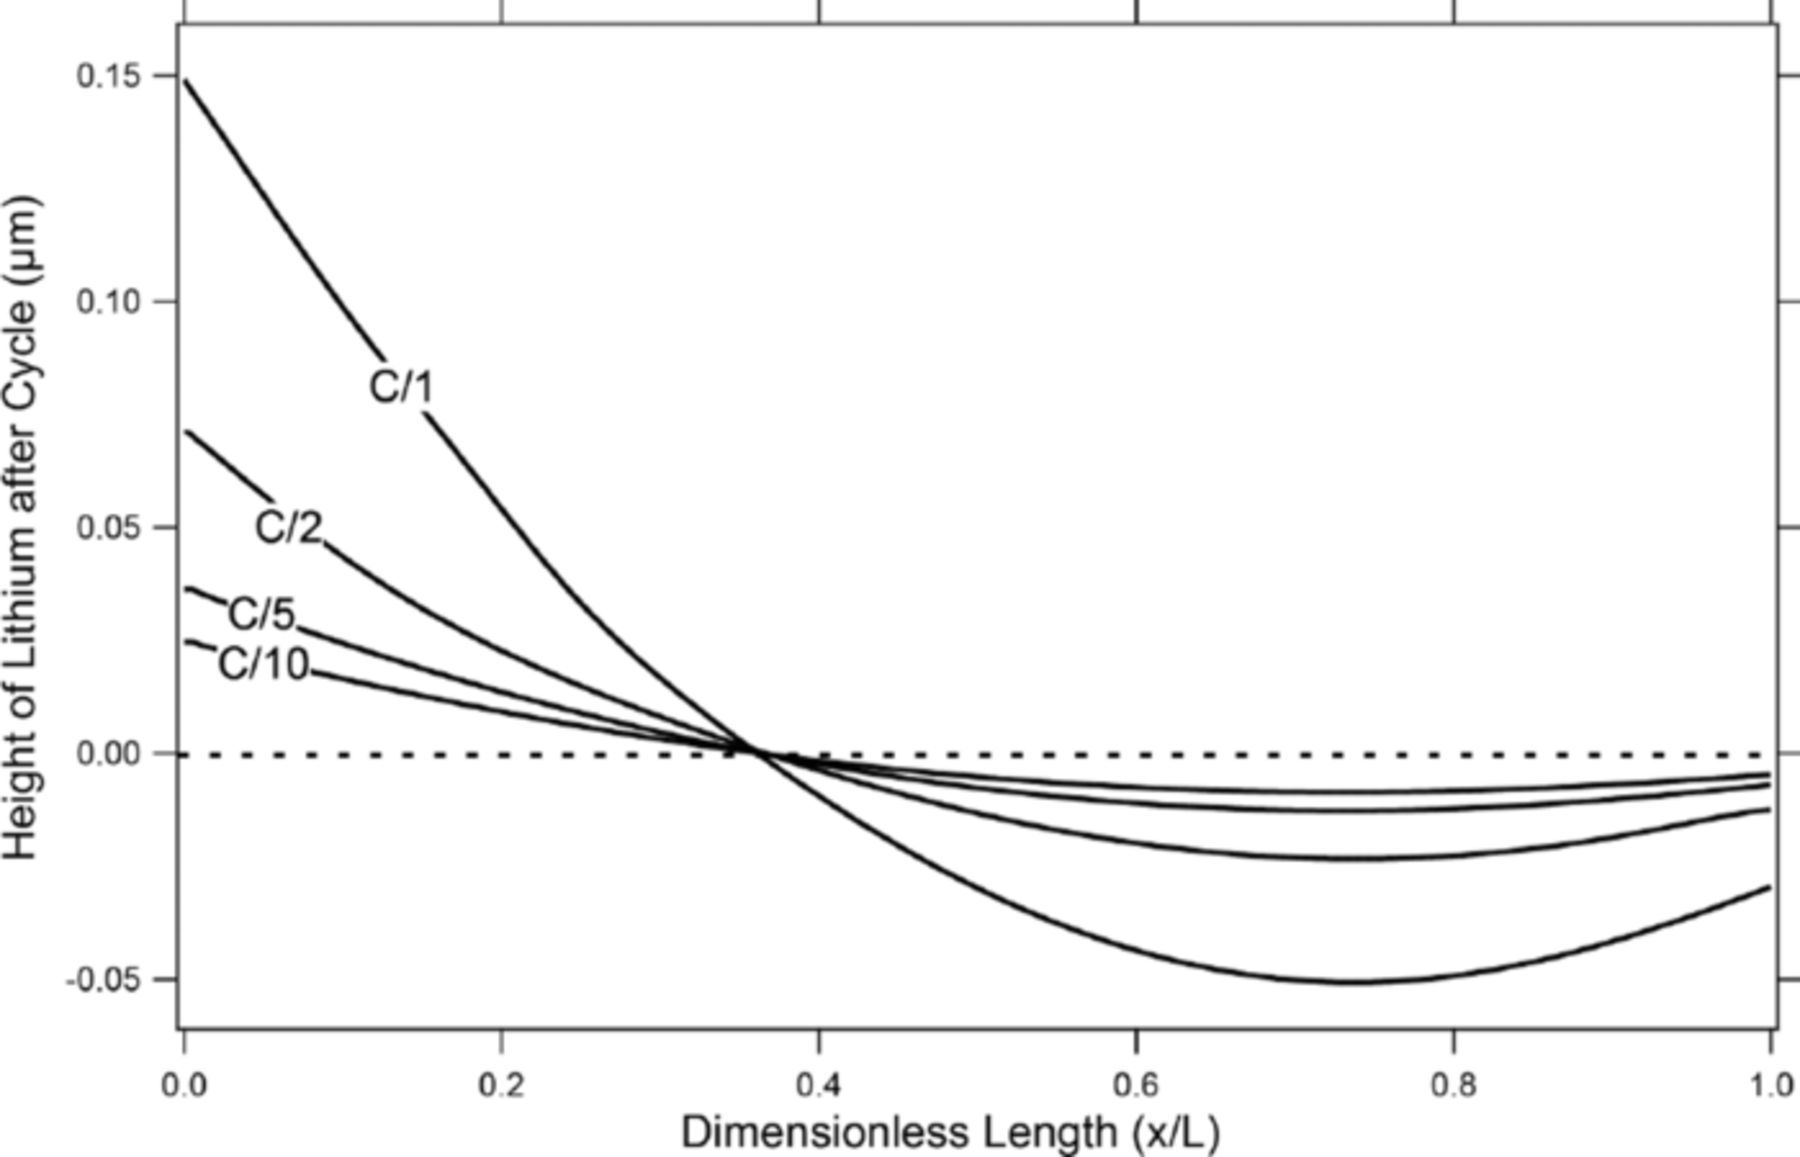
Figure 4. Height of the lithium negative electrode along the lithium/separator interface relative to its starting position after a discharge and charge cycle at various C-rates to a 50% depth of discharge.
Again, the same result can be achieved for the three-tab system by taking the two-tab geometry and halving the length of the cell. Similarly, as you diminish the length of the cell down to zero, you achieve a one-dimensional model that assumes a uniform reaction rate which would remove the movement of lithium in the x dimension.
As is shown in figure 3, the geometry of the cell model has a large effect on the movement of lithium over the half cycle. However, without any nonlinearities, the lithium, although migrating during the half cycle, will return to its original starting position. Figure 4, however, shows significant movement of the lithium metal after a full cycle consisting of a discharge phase, a rest period of 1000 seconds, then a charge cycle at various rates to a 50% depth of discharge calculated based on the positive electrode. The net overall state of charge is now the same as before cycling began. The profiles seen in figure 4 were taken immediately following the completion of the charging. All cycles were conducted galvanostatically. From fig. 4, it is apparent that nonlinearities in the equations discussed in the Methods section are contributing to a irreversible movement of the lithium metal in the negative electrode. As is discussed in the next sections of this paper, the two main nonlinearities contributing to this shape change are the open-circuit potential function in the positive electrode and the concentration gradients of the salt in the liquid phase.
Open-Circuit-Potential Function
In this model there are two main nonlinearities that contribute to the shape change seen in figure 4, the largest being the open-circuit-potential function or OCP. In order to describe how the OCP function affects the shape change, four different OCP functions (seen in fig. 5a) are modeled. These include the standard, experimentally measured OCP function for CoO2 (Experimental OCP),22 a sloped OCP function (Sloped OCP), a sloped OCP with a hyperbolic tangent function (Drop OCP), and a flat OCP function. Instead of plotting the final change in the height of the lithium after a full cycle (as seen in figure 4), two points (h1 and h2) were used. These measure the height of the lithium relative to its starting position along the separator/negative electrode interface (seen in fig. 1). The difference between these points (h1-h2) is plotted in figure 5b versus time for a full cycle at a C/5 rate with a 1000-second rest between the discharge and charge phases and a 2000-second rest after the full cycle. The points were chosen at 1 cm and 37.5 cm on the x-axis in order to achieve the maximum difference between the two points while still minimizing errors that can occur at the edges of the model.
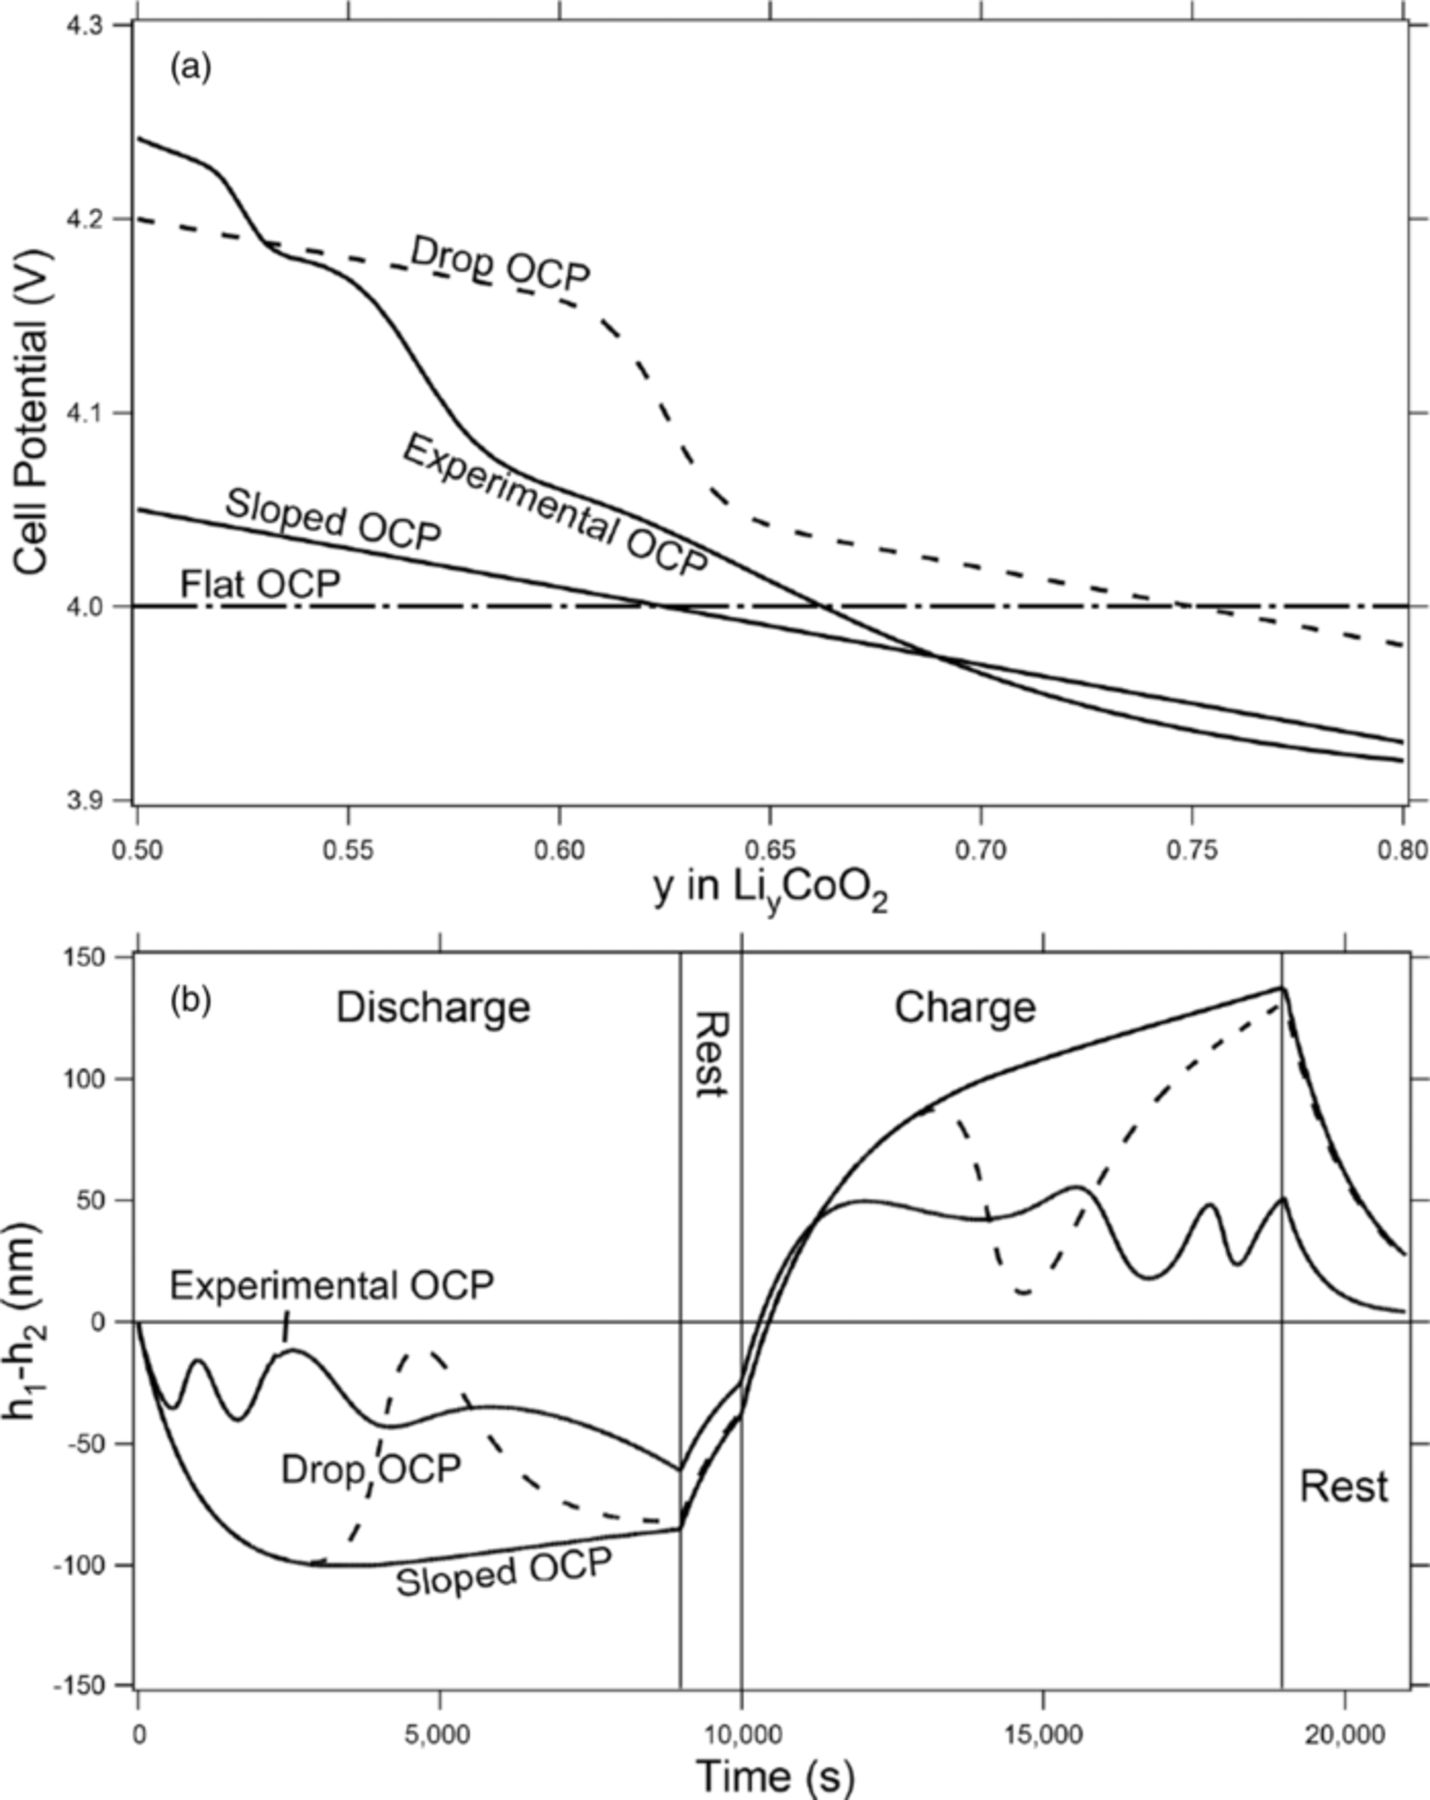
When plotting the difference in heights (h1-h2) versus time (fig. 5b), several interesting results can be seen. The plot of the experimental OCP for CoO2 (Experimental OCP in figure 5b) shows during both the charge and discharge phases local minima and maxima. This means that, starting from time zero, h1 starts to dip below h2 making the shape nonuniform, similar to the 1-Tab line in figure 3. However, as we continue forward in time, we reach a local minimum, and the line starts to return toward zero, meaning that the shape of the interface between the separator and negative electrode is starting to flatten out. The plot then goes through several local maxima and minima before reaching the global minimum right at the cutoff for the discharge portion of the cycle.
It has been found that these local minima and maxima are due to changes in the slope of the OCP. This is due to the fact that, as the cell is discharging, the SOC passes through a section where the OCP is steeper, which means that the concentration gradient of the lithium in the active material in the positive electrode will tend to flatten because of the greater driving force. One of the ways that this is achieved is by increasing the reaction rate across the area of the positive electrode where the SOC is lower and decreasing the reaction rate where the SOC is higher. This has the effect of flattening the concentration gradients of the lithium in the solid phase of the positive electrode and flattening the lithium interface at the negative electrode. This phenomenon can especially be seen when comparing Sloped OCP and Drop OCP lines in figure 5b (please note that the Sloped OCP line has the same slope as the Drop OCP line with the addition of a hyperbolic tangent). When studying Sloped OCP line in both figure 5a and 5b, it is noted that when the slope of the OCP remains constant, the local minima and maxima are removed. However, a comparison of Sloped OCP and Drop OCP lines in figure 5b shows that, as the SOC goes through the dip due to the hyperbolic tangent, the Drop OCP line departs from the Sloped OCP line. As the SOC passes completely through the hyperbolic tangent portion of the OCP, the Drop OCP line starts to return to its original path (Sloped OCP), as though the drop had never occurred. This theory has also been developed in the literature.16,18,23
The second effect that the OCP has on shape change in this model is that as you increase the slope of the OCP function, the shape change decreases. Again, this is caused by differences in the SOC or the concentration of lithium in the solid phase, which is governed by the OCP. For a given difference in potential between two points, there is a larger concentration gradient of lithium in the solid phase with a flatter OCP than with a steeper OCP function. That is, there is a greater driving force to decrease the concentration gradients in the solid phase with a steeper OCP than a flatter one. This can be seen when comparing the Experimental OCP line with the Sloped OCP line in figure 5b.
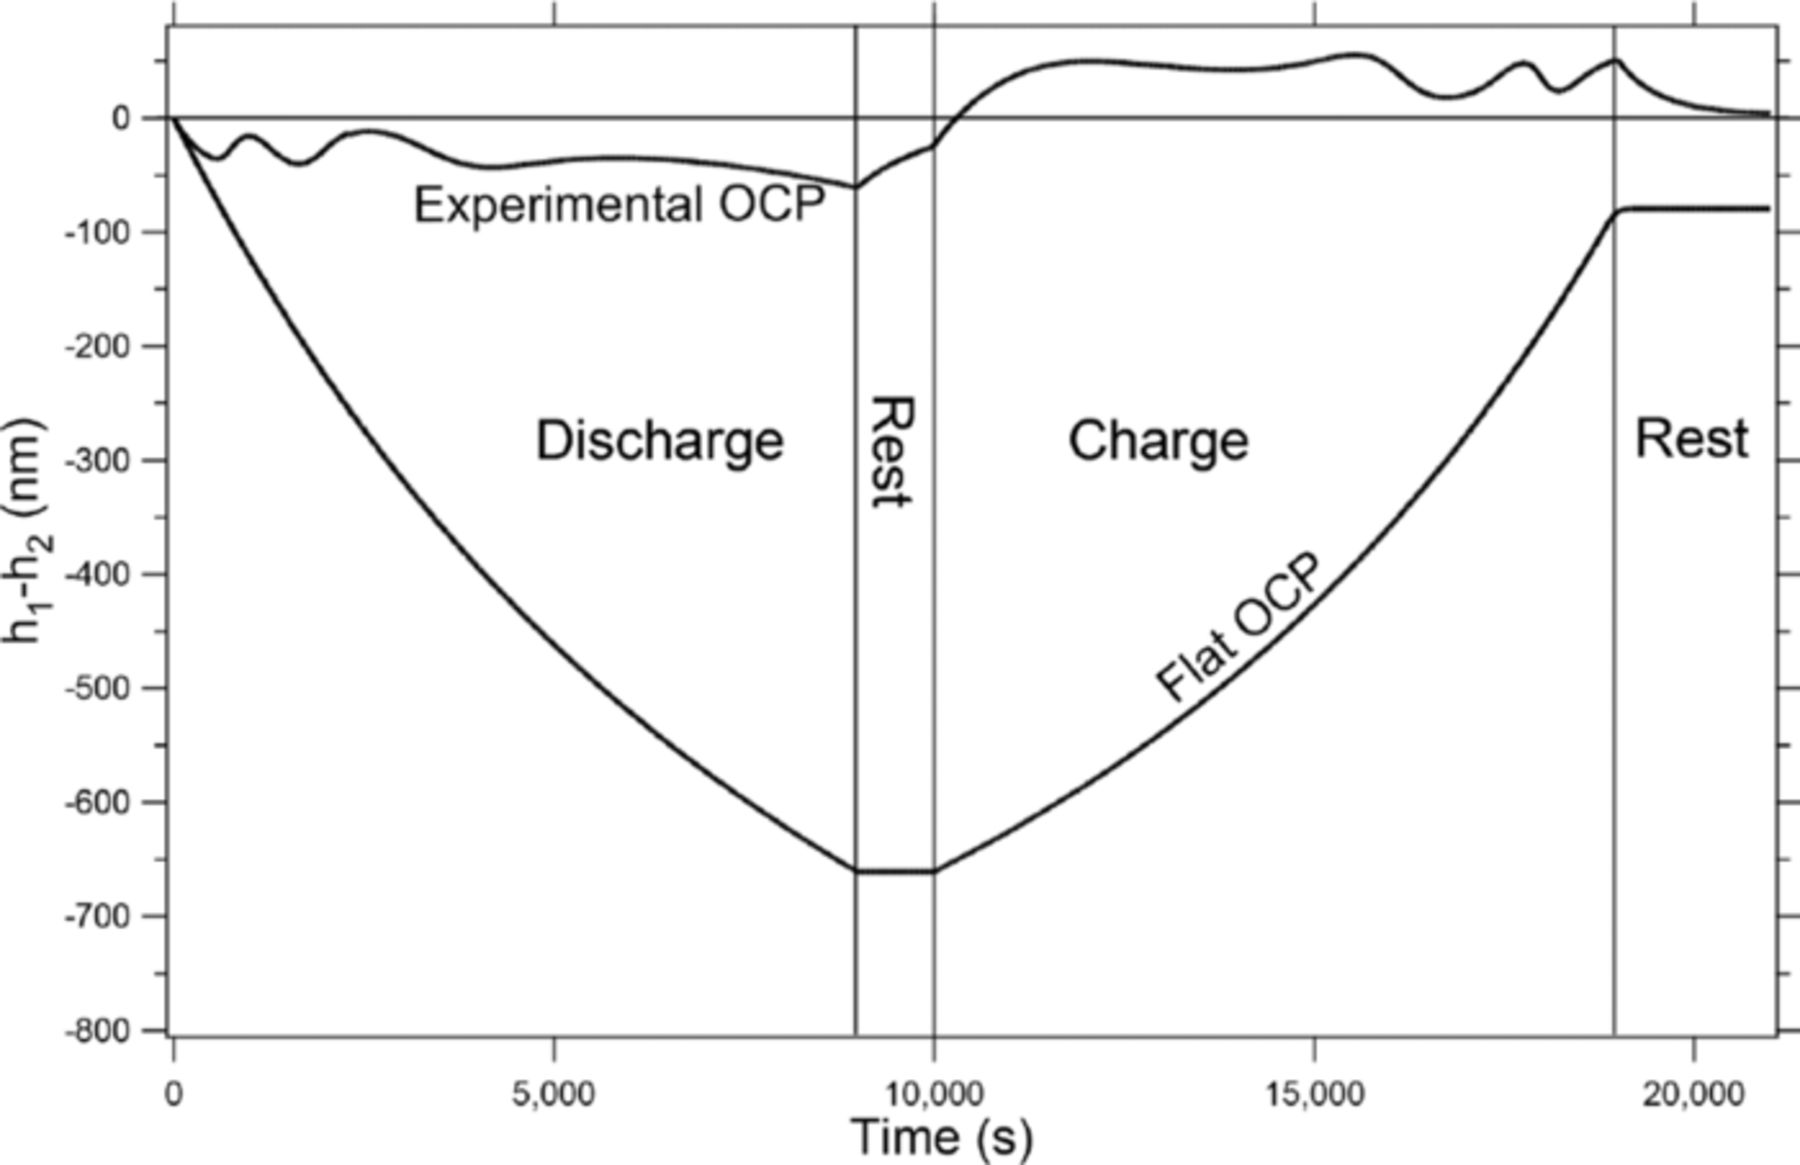
The third interesting phenomenon in figures 5a and 5b is that during rest the difference between h1 and h2 starts to return to zero, meaning that the shape of the lithium is flattening out when no external current is being passed. This flattening out of the negative electrode during rest is again an effect of the OCP which enhances the equilibration of lithium concentrations in the solid phase of the positive electrode. For example: after a discharge at a C/5 rate, more lithium at the negative electrode has been removed near the negative tab than near the edge closest to the positive tab (seen in the 1-Tab line in Fig. 3). This means that the concentration of lithium in the solid phase of the positive electrode is higher on the left side of the cell and lower on the right. Because of the sloped OCP, there is a potential gradient due to the concentration gradient that drives the lithium in the positive electrode to equilibrate. Because of the length scales involved (200 μm thick vs. 50 cm long), it is much easier for the lithium to cross through the separator and interact with the negative electrode than to diffuse through the positive electrode in the x direction. This phenomenon can be seen in figure 6 where the local current density along the surface of the negative electrode is measured at various times during an extended rest phase after a discharge half cycle at a C/5 rate to a 50% DOD. The zero-second line in fig. 6 corresponds to the current density immediately after discharge. As is expected, no net current is being passed during this rest phase, shown by the fact that the integral of the local current density is zero. However, there is still a local, nonzero current density during the rest period. To explain this phenomenon more completely, the lithium in the higher-concentration region of the positive electrode (the left side of the cell) crosses through the separator and deposits on the left side of the negative electrode causing the negative current density in that region. At the same time, the lithium on the right side of the negative electrode reacts into the solvent, diffuses through the separator and deposits in the right lower-concentration region of the positive electrode causing the positive current density in that region. This creates a current-neutral process that both equilibrates the positive electrode and flattens the negative electrode. Of course, as can be seen in the Flat OCP line in figure 7, if the OCP is flat, then there is no driving force to equilibrate the positive electrode, and the negative electrode will not flatten.
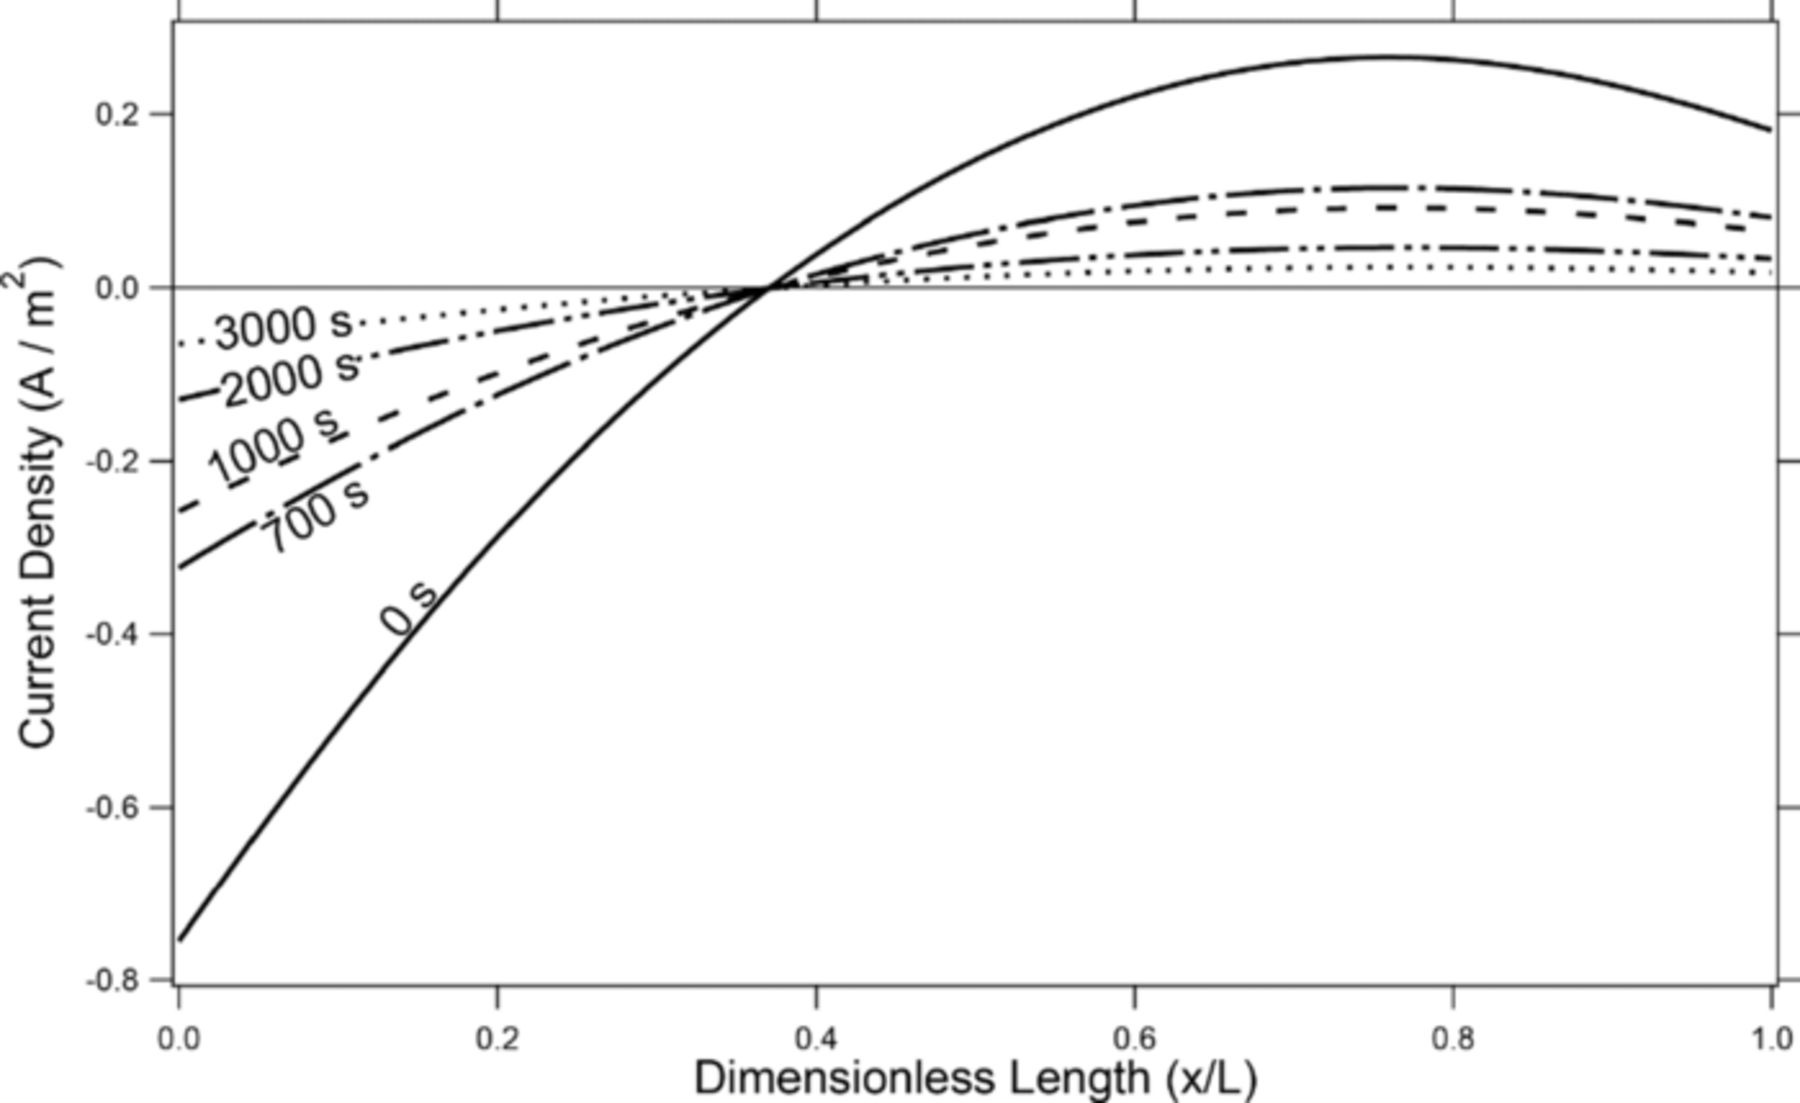
Figure 6. Local current density at the surface of the negative electrode following a discharge at a rate of C/5 for 2.5 hours. Zero seconds, corresponds to the start of the rest phase after discharge.
Diffusivity
The Flat OCP line in figure 7 shows several additional interesting features. Along with the absence of any flattening of the negative electrode during the rest phases, the movement of the lithium during the half cycles is much more extreme. This follows from the trend that, as the slope of the OCP flattens, the extent of the shape change increases. With a flat OCP, the driving force for equilibrating the concentration gradients in the solid phase of the positive electrode is completely absent. This means that the positive electrode will act as if it were a very thin electrode with all of the lithium intercalating into and out of the very edge of the positive electrode nearest the separator and biased toward the negative tab. This leads to the state of charge at the edge of the positive electrode nearest the negative tab increasing up to around 2.5, which is clearly not physical. This result is simply because the limitation in the model for the extent of the SOC at any point in the positive electrode was based on the OCP and with the OCP being held constant, that limitation is no longer present, leading to very large swings in the SOC.
The third phenomenon that can be seen in the Flat OCP line in figure 7 is that even though the OCP is held constant, the shape of the lithium after a full cycle still doesn't return to zero, meaning that there still is a net shift of the lithium after cycling. This is due to the concentration gradients in the liquid phase, and the effects of the concentration gradients can be seen clearly in figure 8. Figure 8 again shows the movement of the lithium (h1-h2) at the negative electrode over time for two different OCP functions: the experimental OCP function for CoO2 (Experimental OCP line in fig. 5a) and the flat OCP (Flat OCP line in fig. 5a). The solid lines represent the simulation being run under 'normal' conditions and are the same as those seen in figure 5b (Experimental OCP) and figure 7 (Flat OCP). The dashed lines are for simulations run under the same conditions but with the diffusivity of the salt in the liquid electrolyte raised by 3 orders of magnitude. This makes the concentration gradients very flat and, as can be seen in the Flat OCP High Diffusivity line in figure 8, without the nonlinearity of the concentration gradients or the OCP, the shape of the lithium returns back to zero after a full cycle. It should be mentioned again, however, that the significant movement seen during the half cycles is due to the geometry. It is also interesting to note that while the concentration gradients play a role when the OCP is flat (seen in the Flat OCP and Flat OCP High Diffusivity lines in figure 8), when one compares the solid and dashed lines for the Experimental OCP case no significant difference is seen in the movement. This shows that the effect of concentration gradients on the shape change is much smaller than the effect that the OCP has.
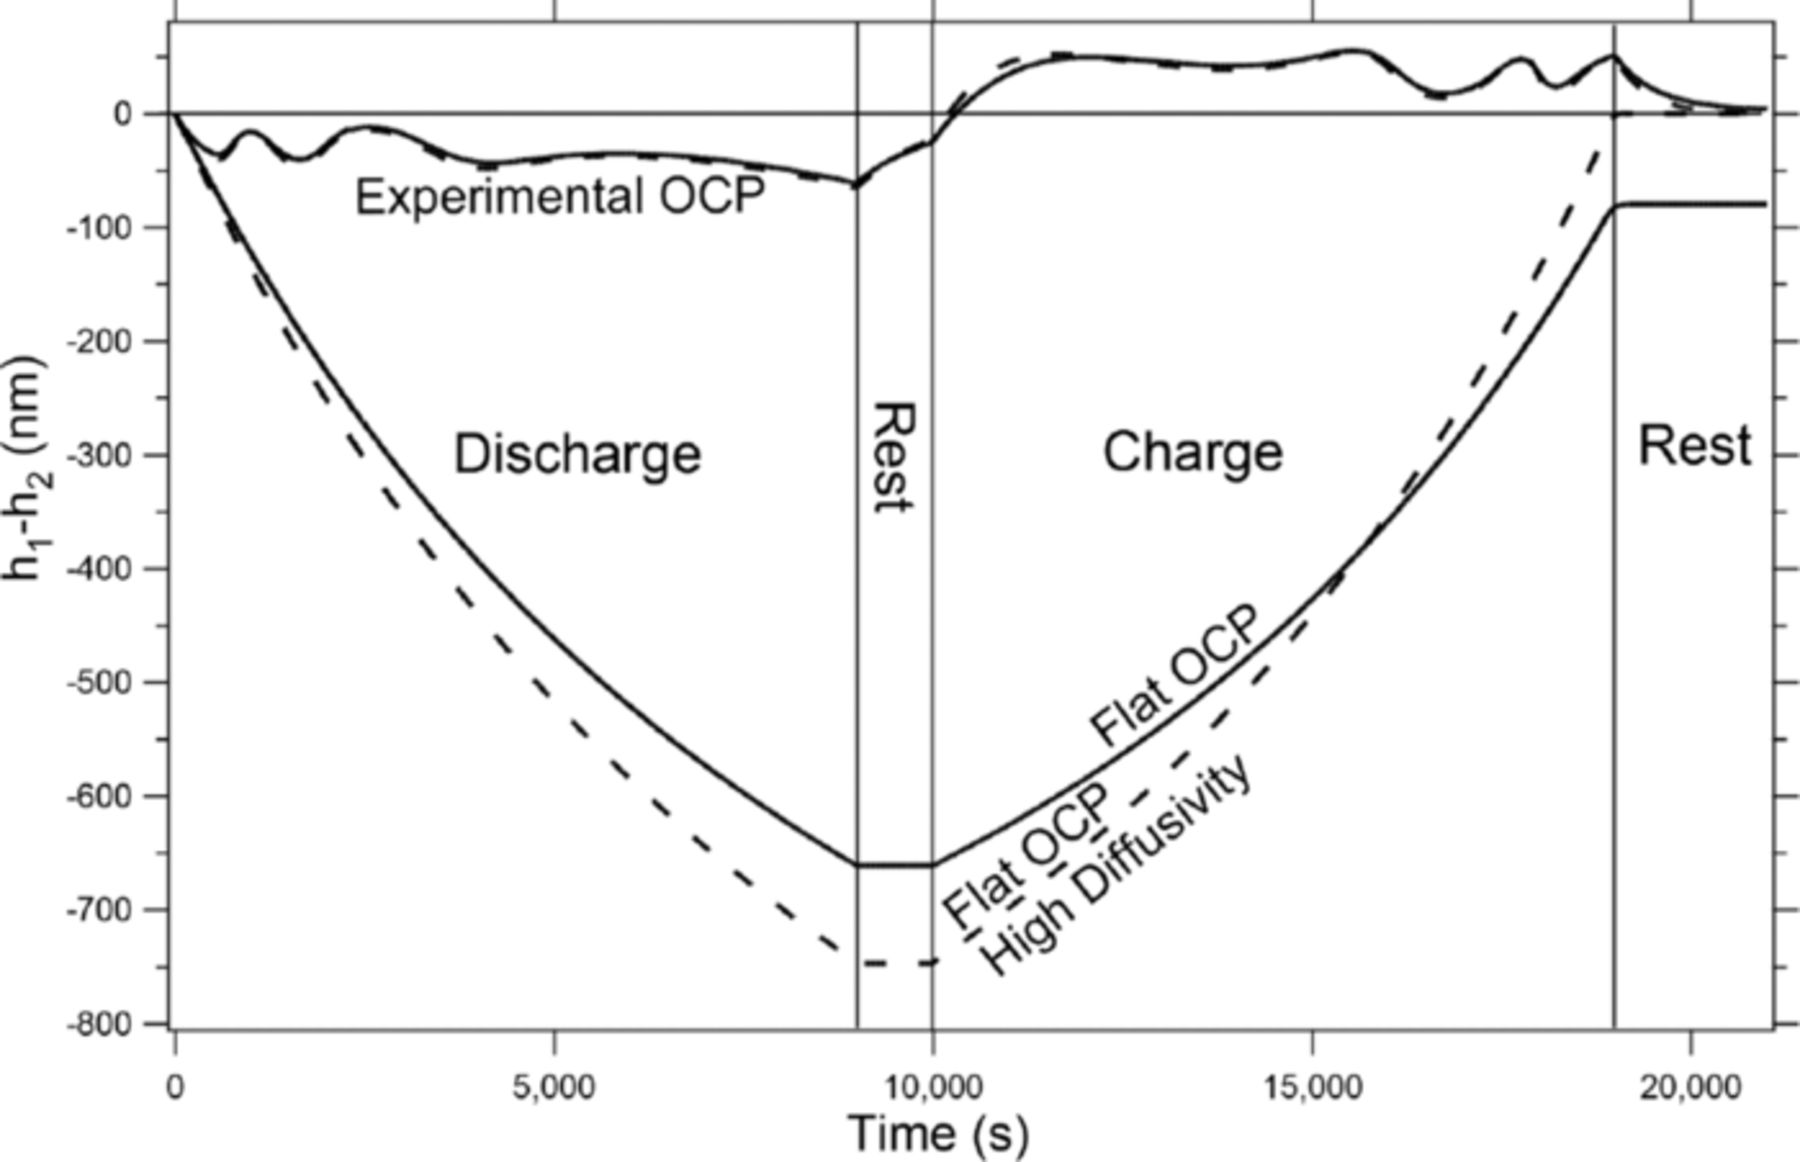
Figure 8. Comparison of the shape change (h1 and h2) over time when the diffusivity in the liquid phase is normal (solid lines) and is increased by three orders of magnitude (dashed lines) for two OCP functions, Flat OCP and Experimental OCP, seen in fig. 5a.
Along a similar line, the movement of the lithium with a liquid electrolyte will induce convection in the electrolyte. This convection can be considered, perhaps crudely, to be an enhancement of the diffusivity, which has been found to have a very limited effect on the movement of the lithium during cycling. Therefore, the convective term in the flux equation has been neglected for the sake of simplicity. The exclusion of the convection term in a liquid electrolyte system was also found to have a negligible effect on the concentration profiles in the work by Pollard et al.24 Again, as can be seen when comparing the high diffusivity Experimental OCP (dashed) and normal diffusivity Experimental OCP (solid) lines in figure 8, there is a small difference (a maximum of about 6%) in the movement of the lithium due to the increased diffusivity. This can be considered to be the maximum error incurred by the absence of convection terms and was deemed to be an acceptable level of error.
Conclusions
In this paper, a two-dimensional model has been presented that is able to capture the movement of lithium during cycling. This model incorporates electrode tabbing, a moving boundary at the negative electrode, a CoO2 intercalation electrode as the cathode, and a lithium-metal negative electrode. The positive electrode is modeled using porous electrode theory, the separator as a liquid electrolyte with a binary salt, and the total volume changes are assumed to be zero. Finally, the negative electrode in this model is twice the thickness required by stoichiometry in order to avoid the need for a separate negative current collector.
The model has been cycled at various rates, and it is seen that, even without dendrites, significant large-scale movement of lithium is seen both during each half cycle and after a full cycle of a discharge followed by a charge. More specifically, the lithium is depleted more near the negative tab, yet after a full cycle, there is a net migration of the lithium toward the negative tab. This migration has been found to be caused by three separate phenomena. First, the geometry strongly affects the current density distribution which directly correlates to the asymmetric depletion of lithium during the discharge phase. The second driving force discussed is the open-circuit-potential function, the slope of which not only affects the magnitude of the movement, but also is the largest nonlinearity that contributes to the movement of lithium after a full cycle. The third, and smallest contributor to the movement of the lithium is the concentration gradients in the liquid electrolyte. It has been seen that when the OCP is flat and the concentration gradients are reduced by increasing the diffusivity, the lithium will return to its starting position after a full cycle.
Acknowledgments
This work was supported by the Assistant Secretary for Energy Efficiency and Renewable Energy, Office of Vehicle Technologies of the U.S. Department of Energy under Contract no. DE-AC02-05CH11231 and by the Advanced Research Projects Agency – Energy (ARPA-E), U.S. Department of Energy, under Award Number DE-AR0000067.
Disclaimer: The information, data, or work presented herein was funded in part by an agency of the United States Government. Neither the United States Government nor any agency thereof, nor any of their employees, makes any warranty, express or implied, or assumes any legal liability or responsibility for the accuracy, completeness, or usefulness of any information, apparatus, product, or process disclosed, or represents that its use would not infringe privately owned rights. Reference herein to any specific commercial product, process, or service by trade name, trademark, manufacturer, or otherwise does not necessarily constitute or imply its endorsement, recommendation, or favoring by the United States Government or any agency thereof. The views and opinions of authors expressed herein do not necessarily state or reflect those of the United States Government or any agency thereof.