Abstract
The electrochemical window is the potential range in which an electrolyte/solvent system does not get reduced or oxidized. Usually, voltammograms are measured, and the potentials at which specific current densities are reached are identified as the electrochemical limits. We measured electrochemical limits of several electrolytes–including ionic liquids–and show that this approach has disadvantages that can be overcome by an alternate approach of defining electrochemical limits. The choice of the cut-off current density, Jcut-off, is arbitrary and strongly affects the determined electrochemical windows, which are strongly influenced by electrolyte mass transport. Moreover, the Jcut-off method does not provide an accurate estimate of the electrochemical window at electrodes with high surface areas, where the capacitive currents are large. We propose a method that requires no definition of Jcut-off. This method minimizes electrolyte mass transport effects, gives realistic electrochemical stability limits at high surface area electrodes, and is less affected by experimental parameters such as the scan rate. The method is based on linear fits of the current–voltage curve at potentials below and above the onset of electrolyte decomposition. The potential at which the two linear fits intersect is defined as the electrolyte electrochemical limit.
Export citation and abstract BibTeX RIS

This is an open access article distributed under the terms of the Creative Commons Attribution Non-Commercial No Derivatives 4.0 License (CC BY-NC-ND, http://creativecommons.org/licenses/by-nc-nd/4.0/), which permits non-commercial reuse, distribution, and reproduction in any medium, provided the original work is not changed in any way and is properly cited. For permission for commercial reuse, please email: oa@electrochem.org.
Electrolytes and solvents are essential for the proper function of a variety of electrochemical devices, such as batteries and supercapacitors. The voltage polarization in these devices can cause electrochemical degradation of the electrolyte and solvent, resulting in device malfunction. This can be avoided by constraining the working range of the device to the electrochemical window limited by the electrolyte and solvent, i.e., the potential range in which they are chemically stable and do not get reduced or oxidized.1,2 Due to their localized charges, the inherently ionic electrolytes often have a lower electrochemical stability than neutral solvent molecules, and therefore frequently limit the device working range.2 There has been extensive research on modifying the structure of electrolytes to improve their electrochemical stability, and thus expanding their working range.3–7
The determination of the electrochemical window of electrolytes is not well defined. Generally a current–voltage polarization curve is measured, starting at a voltage at which the electrolyte is electrochemically stable, followed by increasing or decreasing the potential to observe the anodic or cathodic decompositions, respectively. The potential at which a specific current density, J, is reached is defined as the cathodic or anodic limit of the electrolyte. This approach has several disadvantages, as noted by several researchers.3–5 Firstly, since the choice of the cut-off current density is arbitrary, different standards have been applied in the literature. Cut-off current densities, Jcut-off, in the range of 0.01 to 5.0 mA/cm2 were reported,3,7–20 resulting in electrochemical windows for individual electrolytes that differ by as much as 0.9 V.5 Therefore, the comparison of data from studies that used different Jcut-off values is not readily possible, making it difficult to gain a collective understanding of the effect of the electrolyte structure on its electrochemical stability. Electrochemical windows determined by the conventional Jcut-off method are strongly affected by mass transport of the electrolyte. Consequently, changing the electrolyte concentration affects the determined electrochemical windows.2 Other experimental parameters, such as the type of the working electrode and the scan rate, also affect the determined electrochemical window, although to a lesser extent.2,5
Another disadvantage of the Jcut-off method is its limited applicability to real-life devices. For this method, it is assumed that the current arises exclusively from electrolyte decomposition, ignoring non-faradaic (capacitive) current.21 This approximation is generally quite good for non-porous electrodes with smaller surface areas such as non-porous glassy carbon, gold, or platinum, where the magnitude of the capacitive current is small. However, many real-life electrochemical devices contain porous carbon electrodes with high surface areas (500–2500 m2/g),22,23 resulting in non-faradaic currents as large as 5.0 mA/cm2.21,24 In such cases, the non-faradaic current is not negligible when compared to the faradaic current produced by electrolyte decomposition and, therefore, use of the Jcut-off method gives unrealistic electrochemical limits. Clearly, more reliable methods for the quantification of the electrochemical stability of electrolytes are needed.
Recently, some of us made a preliminary report of a method for assessing the electrochemical stability of electrolytes that is based on linear fits of the current–voltage curve at potentials below and above the onset of cathodic or anodic decompositions.2 We defined the intercept of the approximately linear portions of the current–voltage curve as the cathodic or anodic limit of the electrolyte. Since no cut-off current density is used in this approach, it eliminates discrepancies that result from the choice of an arbitrary value of Jcut-off. We applied this method previously to determine the cathodic stability of tetraalkylammonium perchlorates in propylene carbonate and suggested that this approach decreases mass transport effects on the cathodic limit of tetrabutylammonium perchlorate.2 In this contribution, we provide a more refined set of instructions on how the linear fit method should be applied, show its applicability for the determination of both cathodic and anodic limits of a variety of electrolytes (including ionic liquids), and quantitatively confirm that this method substantially decreases effects of mass transport on experimentally determined electrochemical limits. The effects of the experimental parameters on the electrochemical stability limits determined with the conventional Jcut-off method and the proposed linear fit method are studied, and the advantages and limitations of each technique are quantitatively discussed. Moreover, we show that the linear fit method can be used in practical devices with high surface area electrodes, such as electric double-layer capacitors, demonstrating the advantages of this approach over the conventional Jcut-off method. Numerical simulations of linear sweep voltammograms of electrolytes, taking into account not only the redox reaction and diffusion but also iR drop and migration, confirm the experimentally observed advantages of the linear fit method.
Experimental
Materials
All reagents were used as received without further purification unless otherwise noted. Anhydrous acetonitrile, anhydrous propylene carbonate, tetrabutylammonium perchlorate (NBu4ClO4), tetrabutylammonium iodide, phenol (>99%), formaldehyde (aqueous solution, 37 wt %), tetrahydrofuran, polytetrafluoroethylene (PTFE, 60 wt % in water), tetraethylorthosilicate (TEOS, 99%), L-lysine (98%), hydrochloric acid (37 wt %), and sodium hydroxide were obtained from Sigma-Aldrich (St. Louis, MO). The ionic liquids, 1-ethyl-3-methylimidazolium bis(trifluoromethylsulfonyl)imide (EMI TFSI), butyltrimethylammonium bis(trifluoromethylsulfonyl)imide (BuNMe3 TFSI), and tributylmethylammonium bis(trifluoromethylsulfonyl)imide (MeNBu3 TFSI), were purchased from IoLiTec (Tuscaloosa, AL). Black Pearl 200 carbon was obtained from Cabot Corporation (Boston, MA). Tetrahydrofuran (HPLC grade, >99.9%) and hydrofluoric acid (48–52 wt%) were purchased from Fisher Scientific (Waltham, MA).
Carbon film preparation
Colloid-Imprinted Mesoporous (CIM) carbon with mesopores of about 24 nm diameter was synthesized according to a previously reported method.25,26 Three-dimensionally ordered mesoporous (3DOm) carbon was prepared through infiltration of a phenol–formaldehyde resol into an ordered silica template made from sedimented silica spheres, as described previously.23 A final pore size of 37 nm was determined through nitrogen sorption, and an ordered structure was observed through transmission electron microscopy and small-angle X-ray scattering. CIM and 3DOm carbon films were prepared by finely grinding the carbon powder with an agate mortar and pestle, followed by addition of an aqueous suspension of PTFE (19:1:20 carbon:PTFE:water by mass) and grinding until a homogenous paste was formed. The paste was rolled out with a mechanical press to a thickness of approximately 250 μm and dried at 110 °C for 24 h under vacuum. The carbon films were then cut into 3.0 mm-diameter circles for use in electrodes.
Electrochemical measurements
Voltammetry experiments were carried out with a CHI600C Potentiostat (CH Instruments, Austin, TX). A three-electrode set up with a 3.0 mm-diameter glassy carbon (GC) disk working electrode (BAS, West Lafayette, IN), a 0.25 mm Pt wire coil (99.998%, Alfa Aesar, Ward Hill, MA) auxiliary electrode, and a Ag+/Ag reference electrode was used (reference solution: 10 mM AgNO3 and 100 mM NBu4ClO4 in acetonitrile). The working electrode was polished on Microcloth polishing pads using 5.0 μm Micropolish II deagglomerated alumina, both from Buehler (Lake Bluff, IL). After polishing, the electrode was rinsed thoroughly, first with deionized water and then with ethanol, followed by drying under a stream of Ar. The reference electrode was prepared as described previously.27 Briefly, a glass tube equipped with a Vycor glass plug was filled with acetonitrile solution of 10.0 mM AgNO3 and 100 mM NBu4ClO4, and an Ag wire was inserted into the tube. The reference electrode was kept in a solution of identical composition for at least 1 week prior to measurements. All potentials reported herein are with respect to 10 mM Ag+/Ag. The anhydrous solvents used in this work were stored and transferred under argon. Prior to measurements, all solutions were purged with argon for 15 min while stirring vigorously to remove dissolved oxygen. Linear fits were performed in Microsoft Excel 2010, and statistical analysis was based on a two-tailed T-test at the significance level of 0.95.
For the preparation of the carbon electrodes, carbon films were immersed in EMI TFSI ionic liquid, followed by application of a vacuum for 1 h to ensure infiltration of the ionic liquid into the carbon pores. Electrodes were fabricated using an experimental procedure published earlier.26 Briefly, each carbon film was mounted on a gold disk electrode (CH Instruments, Austin, TX), and a layer of porous polyethylene film (CelGard 3501, Charlotte, NC) was placed on top of the carbon film to increase the mechanical stability of the electrode. To avoid delamination of the carbon film from the underlying gold, the electrodes were mounted into cylindrical bodies custom-made from Dupont Delrin acetal resin. A screw cap at the opposite end of the electrode pressed the carbon film onto the electrode.
Simulations
All voltammetry simulations were performed using COMSOL Multiphysics version 5.1 software (COMSOL, Burlington, MA). Calculations were performed by utilizing both secondary current distribution physics with transport of diluted species and tertiary current distribution in two-dimensional space. The electrode was assumed to be 0.1 mm in length, with a 0.6 mm distance between the working and reference electrodes. Simulations assume a generic one-electron transfer reaction in a two-electrode system with an ideal reference electrode. Diffusion coefficients used were 0.5 × 10⁻⁹ m2/s for the oxidized and reduced species and 1.0 × 10⁻⁹ m2/s for the counter ion. The exchange current density was 100 A/m2 and the scan rate was 1 V/s for all simulations unless noted otherwise.
Results and Discussion
Figure 1 illustrates how the two methods of Jcut-off and linear fit can be applied to a real sample. Panels 1A and 1B show the current–voltage polarization curve of tetrabutylammonium iodide, NBu4I, near the cathodic limit. According to the Jcut-off method, the potential at which a specific value of Jcut-off is reached is defined as the electrolyte electrochemical limit. In Figure 1A, the Jcut-off values of 0.5 and 1.0 mA/cm2 are highlighted as horizontal dashed lines, and the vertical lines show the potentials at which these Jcut-off values are reached.
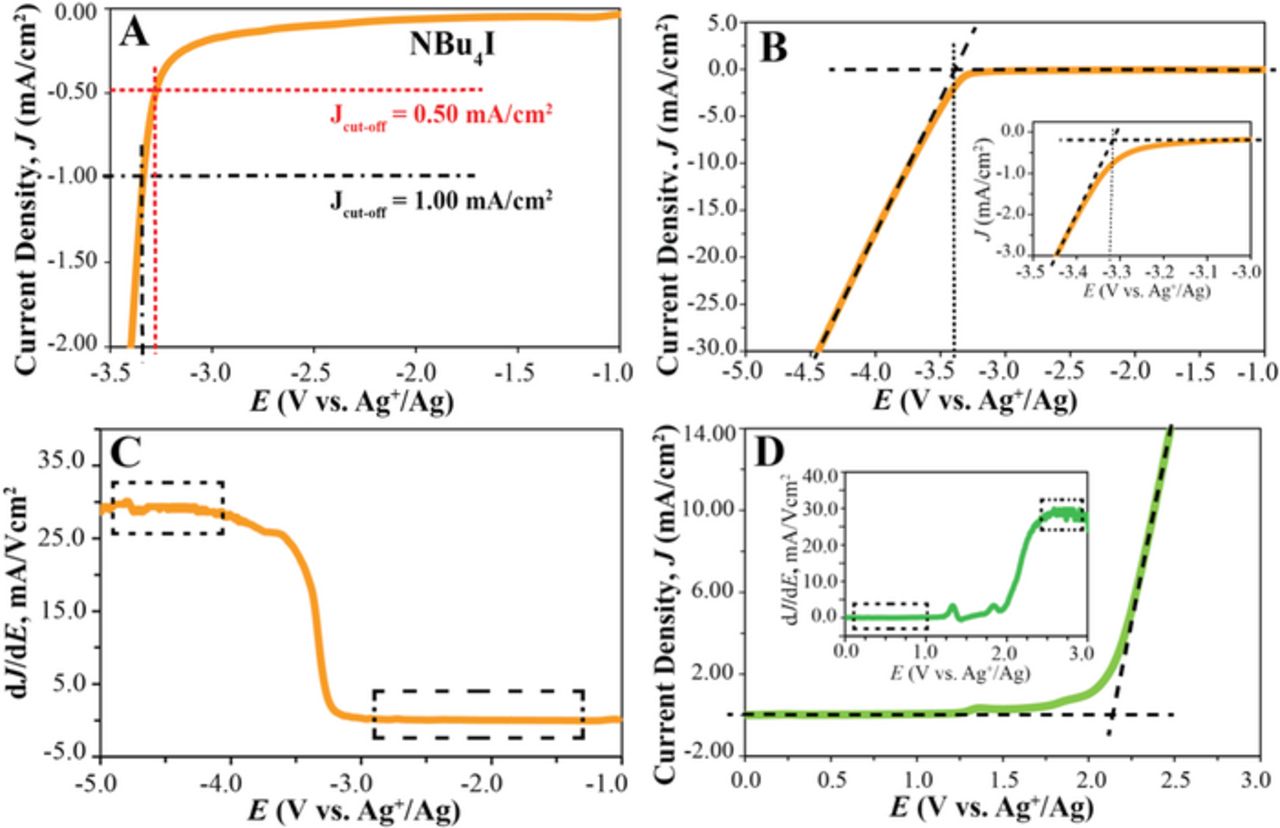
Figure 1. Comparison of the Jcut-off and linear fit methods: (A) and (B) Linear sweep voltammogram of NBu4I (300 mM) in propylene carbonate. (A) illustrates use of Jcut-off values of 0.5 and 1.0 mA/cm2. (B) Dashed lines are linear fits before and after the onset of NBu4I reduction; the vertical dotted line highlights the potential at which the two fits intersect. (C) dJ/dE for the data of panel (B). (D) Linear sweep voltammogram of EMI TFSI (300 mM) in propylene carbonate; linear fits before and after the onset of oxidation shown as dashed lines; inset shows corresponding dJ/dE. Dashed boxes in panels C and D highlight the regions in which the linear fits were performed. (A) to (D): Scan rate, 100 mV/s; Pt coil auxiliary electrode, GC working electrode, and Ag+/Ag reference electrode.
Using the linear fit method as alternate approach to determine the electrochemical limit, two separate linear fits of the current–voltage relationship are applied before and after the onset of electrochemical reduction of the electrolyte2 (Figure 1B, dashed lines). The electrochemical limit is obtained by the intersection of the two linear fits (Figure 1B, vertical dotted line). The linearity of the current density vs. potential curve before and after the onset of electrochemical decomposition can be confirmed by monitoring the slope of the current density–voltage curve, dJ/dE, as shown in Figure 1C. As the potential is swept from −1 to −3 V vs. Ag+/Ag, i.e., before reaching the onset of reduction, dJ/dE is very close to zero, and there are only minimal changes in the magnitude of the slope. As the onset of the electrolyte reduction is reached at approximately −3.2 V, the current density starts to increase, and the curvature of the J vs. E curve changes (i.e., the slope of J vs. E curve increases). A rapid increase in dJ/dE is observed between −3.2 and −3.5 V, a region in which mass transport of the electrolyte is controlled by diffusion and migration. The further decrease in the applied potential results in electrolyte migration becoming the dominant mass transport mode. As a result, the slope of the J vs. E curve is approximately constant (dJ/dE reaches a value of approximately 30 mA/Vcm2 between −4 to −5 V), which makes this the appropriate potential range for the second linear fit. Figure 1C and the inset of Figure 1D also show that the dJ/dE vs. E plot can provide a useful visualization of the onset of the electrochemical reduction or oxidation.
Our first report of the linear fit method did not provide specific instructions on how to perform the linear fits.2 Specifically, it did not comment on the potential range in which the linear fits are preferentially applied, and it did not discuss the correlation coefficients of the linear fits that should be expected. The current density vs. voltage curves for NBu4I shown in Figures 1A and 1B illustrate these aspects. The linear fit of the background current in the range from −2.0 to −3.0 V (five replicates, average coefficient of determination of the linear fit, R2, of 0.954) intersects with the linear fit in the range from −3.3 to −3.5 V (average R2 of 0.965) at −3.349 ± 0.072 V, which we define as the cathodic limit of NBu4I in propylene carbonate.
Altering the range where the linear fit of the (mostly capacitive) background current was applied did not have significant effects on the determined electrochemical limits. Changing the range of the second linear fit to −3.5 to −3.7 V (average R2 of 0.998) or −3.6 to −3.8 (average R2 of 1.000) yields electrochemical limits of −3.365 ± 0.045 and −3.376 ± 0.055 V, respectively. Clearly, the electrochemical limit is affected to a small extent by the potential range of the fit. This can be explained by the dependence of the electrochemical limit on the slope of the J vs. E curve, (i.e., dJ/dE) after the onset of reduction (see Figure 1C). While there are steep changes in dJ/dE right after the onset of reduction (see Figure 1C), the further the linear fit range is from the onset of the reduction, the smaller are the changes in dJ/dE and, therefore, the higher are the correlation coefficients of the linear fits. The range from −4 to −5 V has the least variation in dJ/dE, and thus is suggested for the linear fit. It gives an electrochemical limit of −3.423 ± 0.010 V. Note that the standard deviation of the latter value is much smaller than the corresponding value of 72 mV for the fit in the −3.3 to −3.5 V range. Altering the potential range of the linear fit to −3.5 to −5.0 V (which is still far beyond the onset of the reduction and only shows minimal changes in dJ/dE) did not significantly affect the electrochemical limit of NBu4+. In summary, if not carefully chosen, the potential ranges at which the linear fits are applied can affect the determined electrochemical limits by less than 100 mV. To minimize this effect, we recommend choosing potential ranges in which there are minimal changes in dJ/dE, as, e.g., those highlighted in Figure 1C by dashed boxes. Generally, we obtained linear fits with R2 values larger than 0.990 for all the systems studied in this work.
The linear fit method can also be used to determine the anodic limits of electrolytes, as shown in Figure 1D. The linear sweep voltammogram of 1-ethyl-3-methylimidazolium bis(trifluoromethylsulfonyl)imide, EMI TFSI, is shown in Figure 1D. The dashed lines show the fits used for the determination of the anodic limit. The linear fit method results in an anodic limit of 2.150 ± 0.004 V (vs. Ag+/Ag) for EMI TFSI, whereas the conventional cut-off current density method results in 1.755 ± 0.042 V and 1.969 ± 0.033 V when Jcut-off values of 0.5 and 1.0 mA/cm2 are used, respectively.
Effect of Jcut-off on the electrolyte electrochemical window
Values of Jcut-off ranging from 0.01 to 5.0 mA/cm2 have been used in the literature (e.g., 0.01,7 0.05,3,8 0.1,9,10 0.2,11 0.3,12 0.5,13 1.0,14–20 1.5,12 2.0,28 2.5,12 3.0,12 and 5.019 mA/cm2), although 1.0 mA/cm2 is the most frequently used value. Clearly, the selection of the cut-off current density significantly influences the electrochemical limit. While this conclusion is not new, prior reports with the same conclusion were based on single current–potential polarization measurements and did not include a quantification of the error associated with the determination of the electrochemical limit4,8,12,19 or were based on the comparison of electrochemical limits of the same electrolyte but from multiple studies with different Jcut-off criteria.3,5 However, the effect of Jcut-off cannot be readily distinguished from the effects of different experimental conditions, such as different concentrations and scan rates.
To quantify the effect of Jcut-off on the electrochemical limits systematically, five replicates of the current–voltage curve were measured in this work for a variety of electrolytes and ionic liquids. They were chosen because they are all commonly used in electro-analytical devices22,23,29–31 and electrochemical capacitors3,6,7,32 due to their wide electrochemical windows. The electrochemical limits were determined based on Jcut-off values of 0.5, 1.0, and 5.0 mA/cm2 and are listed in Table I. The use of 0.01 and 0.2 mA/cm2 Jcut-off values was attempted, but these values were too close to the background current density to give meaningful results. For the electrolyte solutions, propylene carbonate was used as solvent due to its wide electrochemical window.2,3,6 Due to solvent-electrolyte interactions, the choice of solvent can slightly affect the electrochemical stability of electrolytes, and, therefore, the solvent in which the cathodic or anodic limits were measured must be reported. In this study, unless noted otherwise, all the electrochemical limits were measured in propylene carbonate.
Table I. Cathodic limits (V vs. Ag+/Ag) from cut-off current density and linear fit methods.
| Cut-off current density method | ||||
|---|---|---|---|---|
| Jcut-off = 0.5 mA/cm2 | Jcut-off = 1.0 mA/cm2 | Jcut-off = 5.0 mA/cm2 | Linear fit method | |
| NBu4I (75 mM)* | −3.293 ± 0.004 | −3.383 ± 0.006 | −3.789 ± 0.022 | −3.414 ± 0.005 |
| NBu4I (150 mM)* | −3.287 ± 0.004 | −3.357 ± 0.004 | −3.633 ± 0.004 | −3.433 ± 0.002 |
| NBu4I (300 mM)* | −3.297 ± 0.032 | −3.360 ± 0.028 | −3.541 ± 0.017 | −3.423 ± 0.010 |
| NBu4I (600 mM)* | −3.393 ± 0.013 | −3.459 ± 0.010 | −3.597 ± 0.013 | −3.473 ± 0.015 |
| MeNBu3 TFSI (300 mM)* | −3.183 ± 0.056 | −3.297 ± 0.024 | −3.565 ± 0.027 | −3.415 ± 0.005 |
| MeNBu3 TFSI (ionic liquid) | −3.639 ± 0.049 | −3.939 ± 0.048 | −5.930 ± 0.126 | −3.494 ± 0.048 |
| BuNMe3 TFSI (ionic liquid) | −3.033 ± 0.033 | −3.311 ± 0.014 | −3.783 ± 0.033 | −3.368 ± 0.019 |
| EMI TFSI (300 mM)* | −2.513 ± 0.008 | −2.559 ± 0.005 | −2.725 ± 0.046 | −2.550 ± 0.019 |
| EMI TFSI (ionic liquid) | −2.381 ± 0.054 | −2.469 ± 0.005 | −2.599 ± 0.023 | −2.555 ± 0.015 |
*Solvent: propylene carbonate. +Scan rate, 100 mV/s; auxiliary electrode, Pt coil; working electrode, GC; reference electrode, Ag/Ag.
Table I confirms that Jcut-off has a large effect on the electrochemical stability limits. For example, a change of Jcut-off from 0.5 to 1.0 mA/cm2 significantly decreased the cathodic limit of NBu4I at all concentrations from 75 to 600 mM, giving 40 to 90 mV changes in the cathodic limit. Further increases of Jcut-off to 5.0 mA/cm2 resulted in 250 to 400 mV changes in the cathodic limit. Similarly, increases in Jcut-off also affected the cathodic limit of MeNBu3 TFSI and EMI TFSI (both in propylene carbonate) by as much as 380 mV. The effect of Jcut-off on the electrochemical stability of the ionic liquids in absence of a solvent was even higher. Changing Jcut-off from 0.5 mA/cm2 to 1.0 mA/cm2 resulted in a 300 mV decrease in the cathodic limits of MeNBu3 TFSI, BuNMe3 TFSI, and EMI TFSI. The potential at which Jcut-off reached 5.0 mA/cm2 for the ionic liquid MeNBu3 TFSI was as high as −5.930 V, which is 2.3 V more negative than the analogous value at 0.5 mA/cm2. These data highlight the key advantage of the proposed linear fit method, which is the independence from a cut-off value.
Effect of electrolyte mass transport
The electrochemical limits determined by the cut-off current density method are strongly influenced by electrolyte mass transport. In this section, we demonstrate that the linear fit method corrects for such effects. The total transport or flux of any chemical species to an electrode is described by the Nernst–Planck equation, which combines the individual contributions from diffusion (resulting from concentration gradients), migration (due to electric fields), and convection (caused by hydrodynamic velocity). For mass transport in one dimension only, the flux, J, of a species is given by33
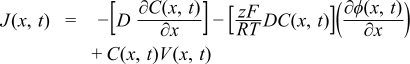
where D and C are the diffusion coefficient and the concentration of the species in consideration, Φ is the electrostatic potential, and V is the hydrodynamic velocity. Typically, voltammograms of redox-active molecules are measured in unstirred solutions and in the presence of high concentrations of supporting electrolyte; this minimizes convection and the migration of the redox-active molecule, making diffusion the main mode of mass transport.33 The shape of the diffusion-controlled cyclic voltammogram (CV) for a fully reversible single-electron transfer reaction and diffusion along one coordinate is shown in Figure 2A (labeled with "Model without distortion from resistance and migration"). Very different voltammetric responses are observed in the case of electrolyte reduction or oxidation (see Figure 1 for examples). Even though electro-decomposition of electrolytes has been experimentally studied for several decades, surprisingly, there has been no theoretical work to date that specifically discusses linear sweep voltammograms that exhibit electrolyte oxidation or reduction. Here, we used COMSOL Multiphysics to perform numerical simulations to illustrate the parameters that affect such voltammograms and the electrolyte electrochemical limits determined therefrom.
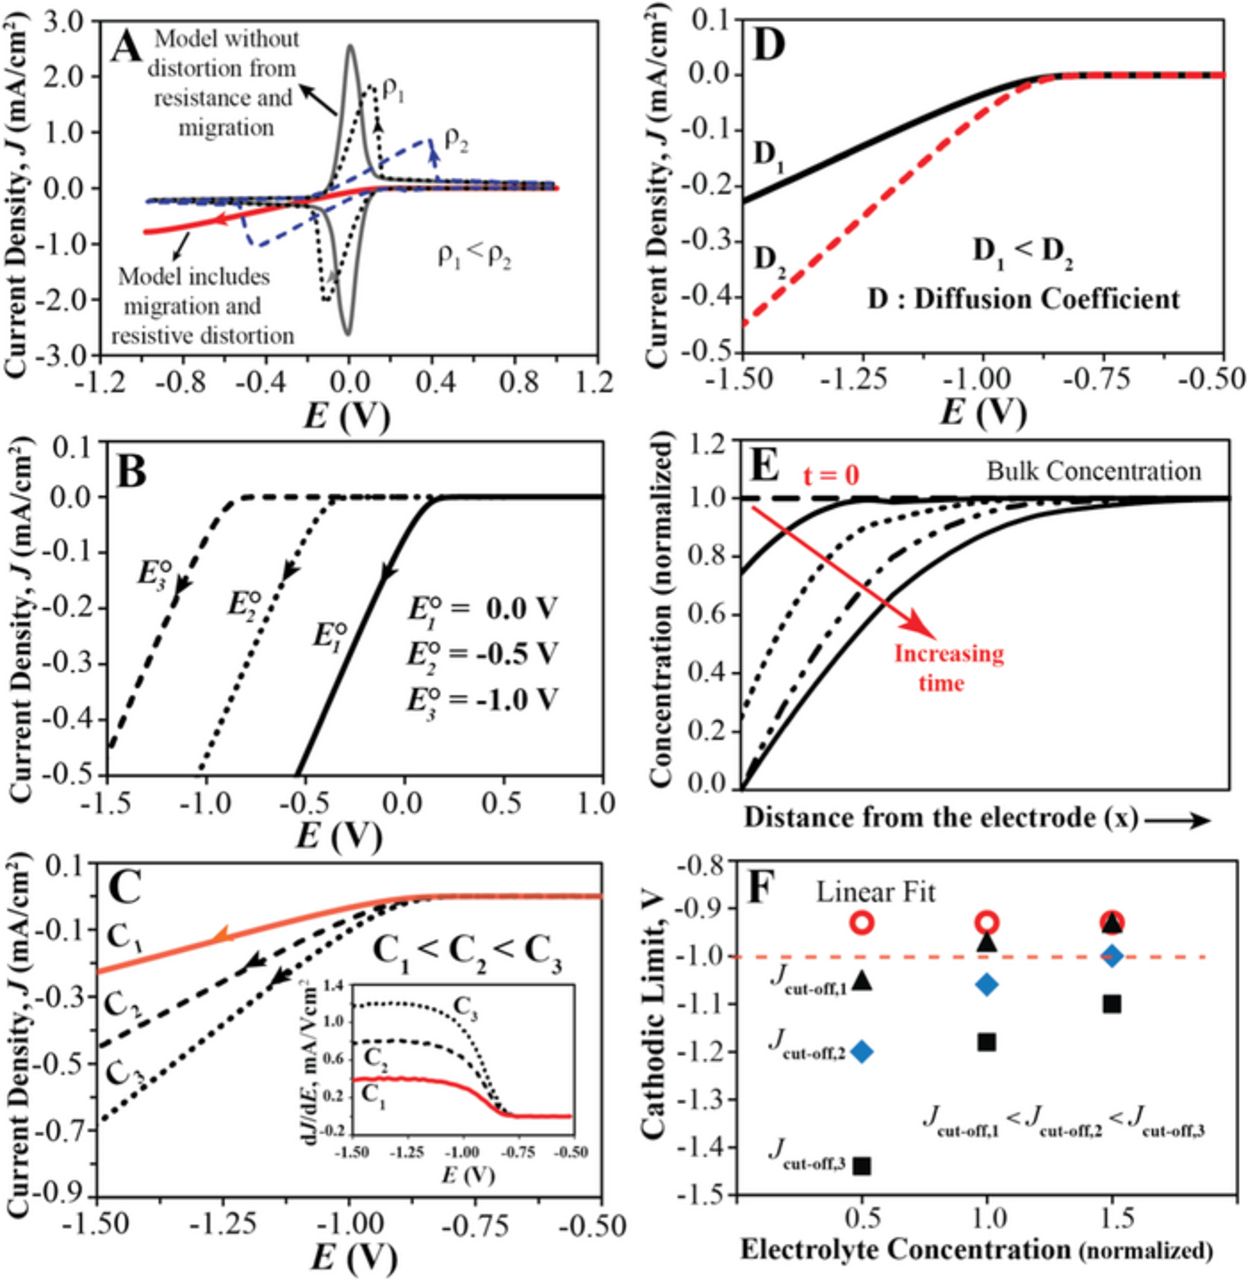
Figure 2. COMSOL simulations: (A) Ideal diffusion-controlled CV shown as solid line, labeled "Model without distortion from resistance and migration". Dashed CVs are affected by resistive distortion; specific resistivities, ρ1 and ρ2, 6.2 and 62.0 Ω·m, covering the typical experimental range of this study. The red solid line shows the CV taking into account also migration. (B) to (D) Linear sweep voltammograms simulated with both diffusion and migration as mass transport modes; (B) for different Eº, (C) Eº = −1.0 V, C equal to 0.5, 1.0, and 1.5 (normalized); (D) Eº = −1.0 V, diffusion coefficients of the oxidized and reduced species, D2 = 4 × 10⁻⁹ m2/s and D1 = 2.0 × 10⁻⁹ m2/s, respectively. (E) Concentration of the oxidized species vs. distance from the electrode at different time points, taking migration into account. (F) Eº = −1.0 V; cathodic limits obtained from the linear fit and Jcut-off methods, shown as a function of electrolyte concentration for Jcut-off of 0.05, 0.1, and 0.2 mA/cm2.
A first correction that has to be applied to linear sweep voltammograms dominated by electrolyte decomposition is the inclusion of resistive distortion. Since there are no ionic species that can carry current other than the redox-active electrolyte itself, solution resistance, R, decreases the potential applied to the solution–electrode interface by a term directly proportional to the current, i. This decreases the slope of the J vs. E curve, resulting in resistive distortion of the voltammetric response.34 The typical effect of resistive distortion on the numerically simulated voltammetric response is shown in Figure 2A, again illustrated for the simplest example of a fully reversible single-electron transfer. Increasing the solution resistivity decreases the height of the peak current, increases the peak separation, and widens the sections of the voltammogram in which the current increases approximately linearly with the applied voltage. Yet, resistive distortion does not fully explain the observed voltammetric response shown in Figure 1.
As a second correction, migration as a mode of mass transport needs to be considered. Unlike in most conventional voltammetry experiments, when electrolyte electro-decomposition occurs the concentration of the reacting species is high compared to the total ion concentration, and diffusion is no longer the sole mode of mass transport. The simulated voltammetric response that takes into account both migration and diffusion agrees well with the experimental observations. Figures 2 illustrates how parameters such as standard redox potentials, concentrations, and diffusion coefficients affect the voltammetric response. For a kinetically facile electro-decomposition reaction, the onset of reduction occurs close to the standard redox potential (see Figure 2B). Figure 2C demonstrates that the electrolyte concentration does not influence the onset of reduction but affects the slope of the linear portion of the voltammogram, where higher concentrations result in steeper slopes. This is consistent with the experimentally observed effect of electrolyte concentration, as evident from Figure 3A, which shows that for 75, 150, and 300 mM NBu4I solutions, the slope of J vs. E increased with increasing NBu4I concentration. Importantly, the slope of the J vs. E curve obtained from the simulation (see inset in Figure 2C) exhibits for all electrolyte concentrations a plateau starting a few hundred mV beyond the standard redox potential, which matches well with experimental observations shown in Figure 1C and Figure 3. The effect of the diffusion coefficients on the simulated voltammograms (see Figure 2D) are completely analogous to those of the electrolyte concentration; larger diffusion coefficients result in faster mass transport and a steeper slope for the linear portion of the voltammogram, but cause no change in the onset of the redox reaction. The parallel effects of diffusion coefficients and concentrations can be readily explained by the direct proportionality of both the diffusion and the migration terms of the total flux on both the diffusion coefficient and the concentration.
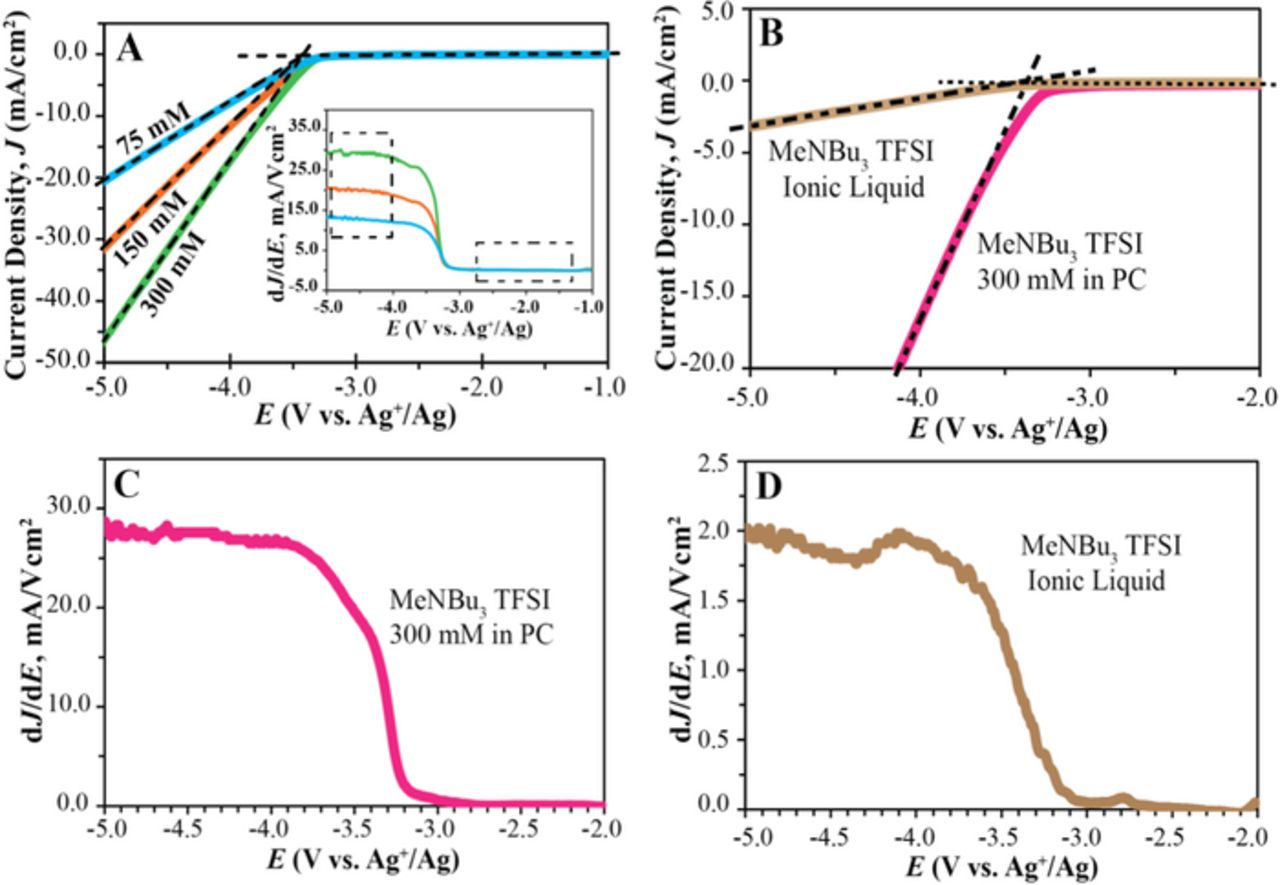
Figure 3. Effect of electrolyte mass transport on electrochemical stability limits. (A) Linear sweep voltammogram of 75, 150, and 300 mM solutions of NBu4I in propylene carbonate (PC). Dashed lines show linear fits before and after onset of NBu4I reduction. Inset: Corresponding dJ/dE curves. (B) Linear sweep voltammogram of MeNBu3 TFSI as pure ionic liquid and as 300 mM solution in propylene carbonate; corresponding dJ/dE curves are shown in Panels (C) and (D), respectively. Scan rate, 100 mV/s; Pt coil auxiliary electrode, GC working electrode, and Ag+/Ag reference electrode.
A key difference between the simulations that take migration into account and those that do not are the wider linear ranges of the slopes of the J vs. E curve, as can be seen in Figure 2A. As illustrated in the electrolyte concentration profiles of Figure 2E (which closely resemble the well-known concentration profiles for linear diffusion systems in which migration does not play a significant role), electrolyte depletion at the electrode surface proceeds quickly and increases over time. Because of the concentration dependence of the flux, this lowers the rate of the redox reaction, and it also increases the iR drop.
To further compare the linear fit and Jcut-off method, electrochemical stability limits were also determined from the simulated voltammograms. As shown by Figure 2F, the electrochemical limits obtained with the linear fit method were not affected by the electrolyte diffusion coefficient or concentration, while quite the opposite was true for electrochemical limits determined with the Jcut-off method, see Figure 2F. In conclusion, numerical simulations confirm that the linear fit method is not biased by electrolyte mass transport, demonstrating the advantages of this method over the Jcut-off method.
The effect of electrolyte mass transport was further studied experimentally. When some of us previously introduced the linear fit method in an attempt to minimize the concentration dependence of the electrochemical limit, we gave examples of cathodic limits for NBu4ClO4 decomposition. However, those early examples did not include a statistical analysis of the error associated with this new method.2 Here, we quantitatively show the effect of electrolyte mass transport on the electrochemical limits obtained from both the Jcut-off and the linear fit method.
Cathodic limits of 75 to 600 mM NBu4I are presented in Table I. At both Jcut-off values of 0.5 and 1.0 mA/cm2, the cathodic limits for 75, 150, and 300 mM NBu4I solutions do not differ significantly from one another, but for the 600 mM solution a lower cathodic limit is determined. (confidence level of 99%). At the higher Jcut-off of 5.0 mA/cm2, higher resistive distortions are observed, and thus the cathodic limits at different concentrations of 75, 150, 300, and 600 mM–which are characterized by different solution resistances–are significantly different from each other.
Using the linear fit method, the fits were applied in the −4 to −5 V region, where the current density exceeds 5 mA/cm2. Notwithstanding, the cathodic limits of the 75 to 300 mM NBu4I solutions as determined with this method are not statistically different from one another. While the limit for the 600 mM NBu4I solution is significantly lower than the ones for 75 to 300 mM NBu4I, the difference is only on the order of 40 to 60 mV.
The cathodic limits of MeNBu3 TFSI were measured both for the pure ionic liquid and a 300 mM solution in propylene carbonate (see Figure 3B). At the Jcut-off values of 0.5 and 1.0 mA/cm2, the cathodic limits for the ionic liquid form are approximately 500 and 700 mV lower, respectively, than for the 300 mM MeNBu3 TFSI solution (see Table I). Figures 3C and 3D show that the onset of the reduction occurs at approximately −3.2 V for both the ionic liquid and the solution. There are no noticeable differences in the electrochemical behavior of MeNBu3 TFSI in the two cases other than the fact that the J vs. E curve is much steeper in case of the 300 mM MeNBu3 TFSI (see Figures 3B to 3D; note different scales for dJ/dE in Figures 3C and 3D). Due to different conductivities, mass transport characteristics in the pure ionic liquid and solution are drastically different. The cathodic limit of the ionic liquid as determined with the cut-off current density method is 500 mV lower than the one determined for the solution. In contrast, the linear fit method minimizes the mass transport and resistive distortion effects, and gives similar values of −3.494 ± 0.048 and −3.415 ± 0.005 V for the pure ionic liquid and the solution form, respectively.
Similar observations were made when comparing the cathodic limits of the ionic liquids MeNBu3 TFSI and BuNMe3 TFSI. The Jcut-off method gives for both Jcut-off values of 0.5 and 1.0 mA/cm2 a difference of 600 mV in the cathodic limits for the two ionic liquids (see Table I and Figure 4). While Figures 4B and 4C show similar onsets of the reduction, they show very different plateau values of dJ/dE for the two ionic liquids (note the different y-axis scales), clearly indicating that a 600 mV difference between the cathodic limits of ionic liquids gives an unrealistic representation of the onset of ionic liquid reduction. The specific resistivity of BuNMe3 TFSI is approximately one order of magnitude lower than that of MeNBu3 TFSI (4.86 vs. 34.72 Ω·m),30,35 resulting in a much larger dJ/dE value for the latter and, consequently, the cathodic limit as given by the Jcut-off method. The linear fit method corrects for the effect of the iR distortion and mass transport and gives more representative cathodic limits of −3.494 ± 0.048 for MeNBu3 TFSI and −3.368 ± 0.019 V (vs. Ag+/Ag) for BuNMe3 TFSI. Similarly, compared to the Jcut-off method, the linear fit method predicts closer cathodic limits for EMI TFSI as a pure ionic liquid and as 300 mM solution in propylene carbonate (see Table I).
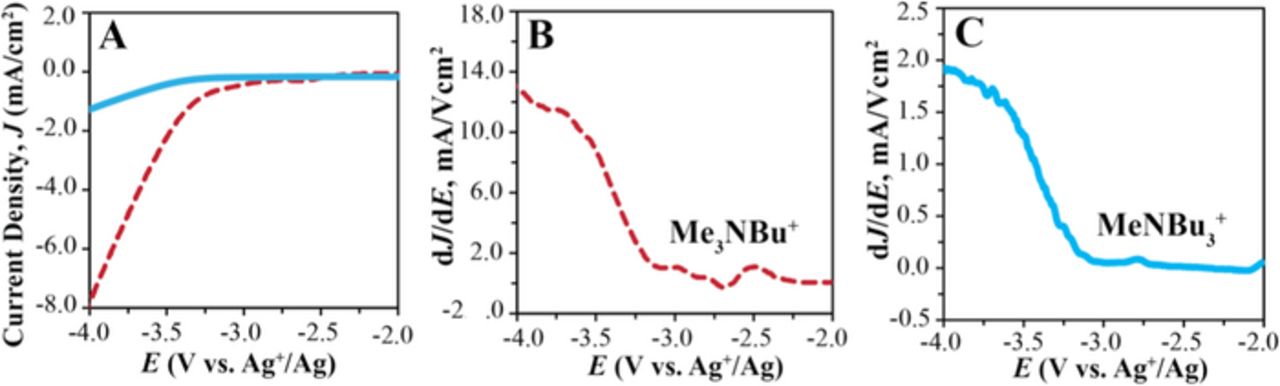
Figure 4. Effect of resistive distortion on electrochemical limits of ionic liquids. (A) Linear sweep voltammogram of MeNBu3 TFSI (solid line) and BuNMe3 TFSI (dashed line); corresponding dJ/dE curves are shown in Panels (B) and (C), respectively. Scan rate, 100 mV/s; Pt coil auxiliary electrode, GC working electrode, and Ag+/Ag reference electrode.
Effect of the scan rate
It is well known that the scan rate can affect current–voltage curves and, consequently, change the electrolyte electrochemical limits determined with the Jcut-off method,5,4 but in the past this effect was not quantitatively studied. In this work, the cathodic limit of NBu4I was measured at scan rates of 1, 10, 100, and 1000 mV/s (see Table II). The scan rate had only a minor effect on the slope of the J vs. E curve and the onset of electrolyte reduction (see Figure 5B) but, as expected, a higher capacitive background current is observed at higher scan rates (see Figure 5A).
Table II. Effect of scan rate on cathodic limit (V vs. Ag+/Ag) of NBu4I.
| Scan rate | ||||
|---|---|---|---|---|
| 1 mV/s | 10 mV/s | 100 mV/s | 1000 mV/s | |
| Jcut-off = 0.5 mA/cm2 | −3.295 ± 0.070 | −3.273 ± 0.010 | −3.145 ± 0.054 | −2.240 ± 0.193 |
| Jcut-off = 1.0 mA/cm2 | −3.385 ± 0.042 | −3.341 ± 0.008 | −3.303 ± 0.019 | −3.015 ± 0.082 |
| Jcut-off = 5.0 mA/cm2 | −3.611 ± 0.063 | −3.539 ± 0.012 | −3.509 ± 0.015 | −3.480 ± 0.023 |
| Linear fit method | −3.513 ± 0.049 | −3.480 ± 0.018 | −3.407 ± 0.010 | −3.422 ± 0.016 |
+300 mM NBu4I in propylene carbonate; auxiliary electrode, Pt coil; working electrode, GC; reference electrode, Ag/Ag.
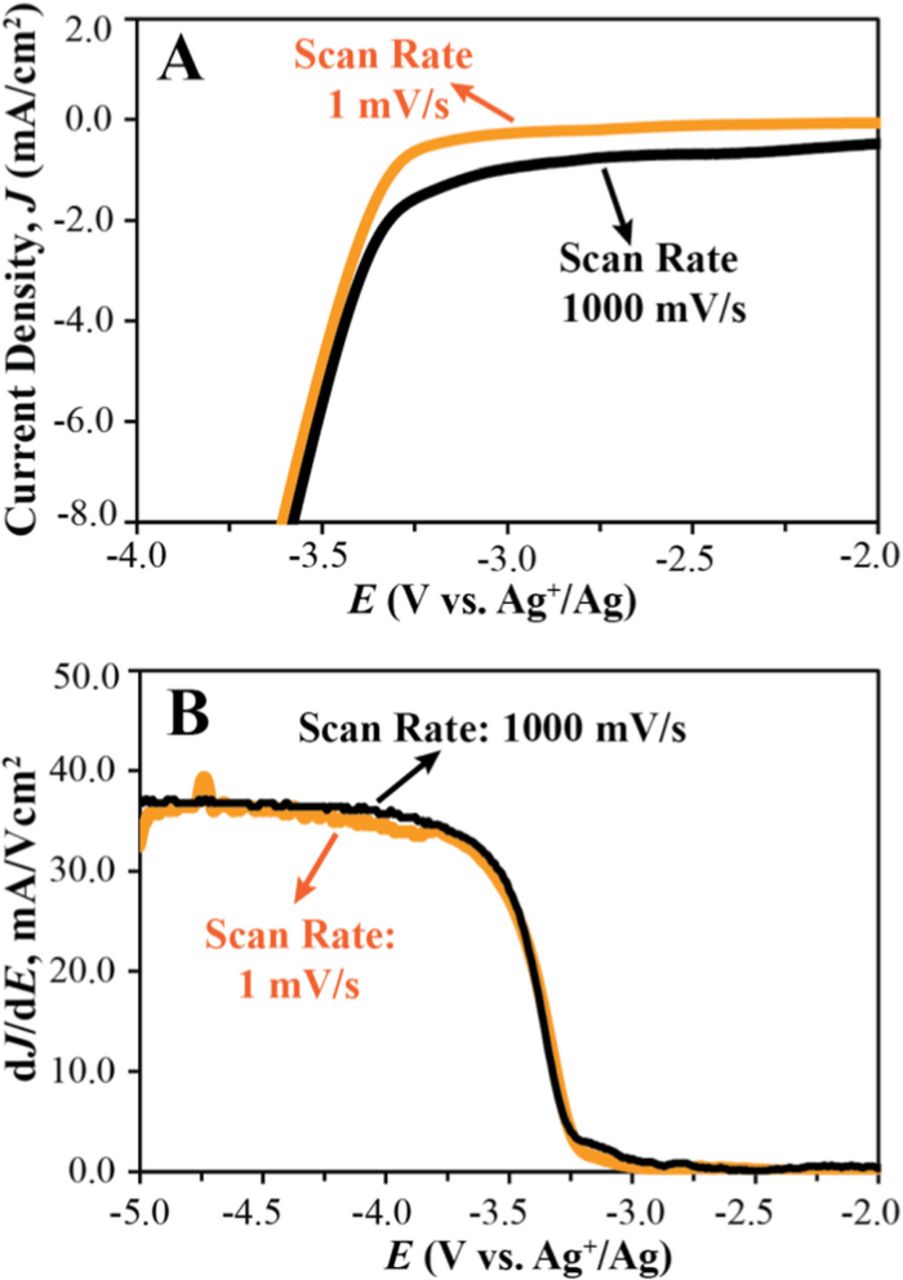
Figure 5. Effect of scan rate on the electrochemical window. (A) Linear sweep voltammogram of 300 mM NBu4I in propylene carbonate at scan rates of 1 mV/s (orange) and 1000 mV/s (black); corresponding dJ/dE shown in (B). Scan rate, 100 mV/s; Pt coil auxiliary electrode, GC working electrode, and Ag+/Ag reference electrode.
Because the Jcut-off method does not correct for the background current, the electrochemical limits determined with this method are affected by the scan rate more than the electrochemical limits obtained with the linear fit method. For example, at a Jcut-off of 0.5 mA/cm2, cathodic limits of −2.240 ± 0.193 and −3.295 ± 0.070 V are determined for the scan rates of 1000 mV/s and 1 mV/s, respectively. The difference of more than 1.0 V in the cathodic stability of NBu4I at these two scan rates is clearly an unrealistic representation of the electrochemical stability of the electrolyte. This effect is decreased at very high Jcut-off values (e.g., 5.0 mA/cm2), where the Faraday current is much larger than the background current and cathodic limits are less dependent on scan rate. The linear fit method gives similar cathodic limits of −3.513 ± 0.049 V and −3.422 ± 0.016 V at the two scan rates of 1 mV/s and 1000 mV/s respectively. In conclusion, the proposed linear fit method is less affected by the scan rate and provides a more realistic evaluation of the electrochemical stability of electrolytes.
Electrochemical limits at high surface area carbon electrodes
Porous high-surface-area carbon materials commonly used in electrochemical capacitors include commercially available activated carbons,22 carbide-derived carbons with small, disordered mesopores,36 nanofibers,37 and porous templated carbons with large, open mesopores.23 To obtain a representative selection, three high-surface-area carbon materials were used for this work, that is, Black Pearl 2000 (a commercially available microporous carbon), three-dimensionally ordered mesoporous (3DOm) carbon,23 and colloid-imprinted mesoporous (CIM) carbon with a disordered pore structure.26
The total current observed at any electrode is the sum of the faradaic (oxidative or reductive) current, and non-faradaic (i.e., capacitive) current.33 During a linear potential sweep of the potential, E, with the scan rate v (where E = vt) within the potential window of the electrolyte (where there is no significant electrolyte decomposition), the capacitive current is given by νCd {1 – exp[-t/(RsCd)]}, where Cd is the electrode capacitance and Rs the voltage independent solution resistance.33 As the scan starts, the non-faradaic current rises from zero to reach a steady value of νCd. Since the electrode capacitance is proportional to the surface area of the electrode, high surface areas result in large capacitive currents. This is clearly shown in Figure 6A, which shows the capacitive current at a non-porous glassy carbon electrode to be much smaller than in the case of the highly porous Black Pearl 2000 carbon. Note that the two electrodes have the same cross-sectional ("geometric") surface area. While the current density at the glassy carbon electrode (defined as current per geometric surface area) is less than 0.05 mA/cm2, current densities as high as 1.0 mA/cm2 are observed for the Black Pearl 2000 carbon electrode.
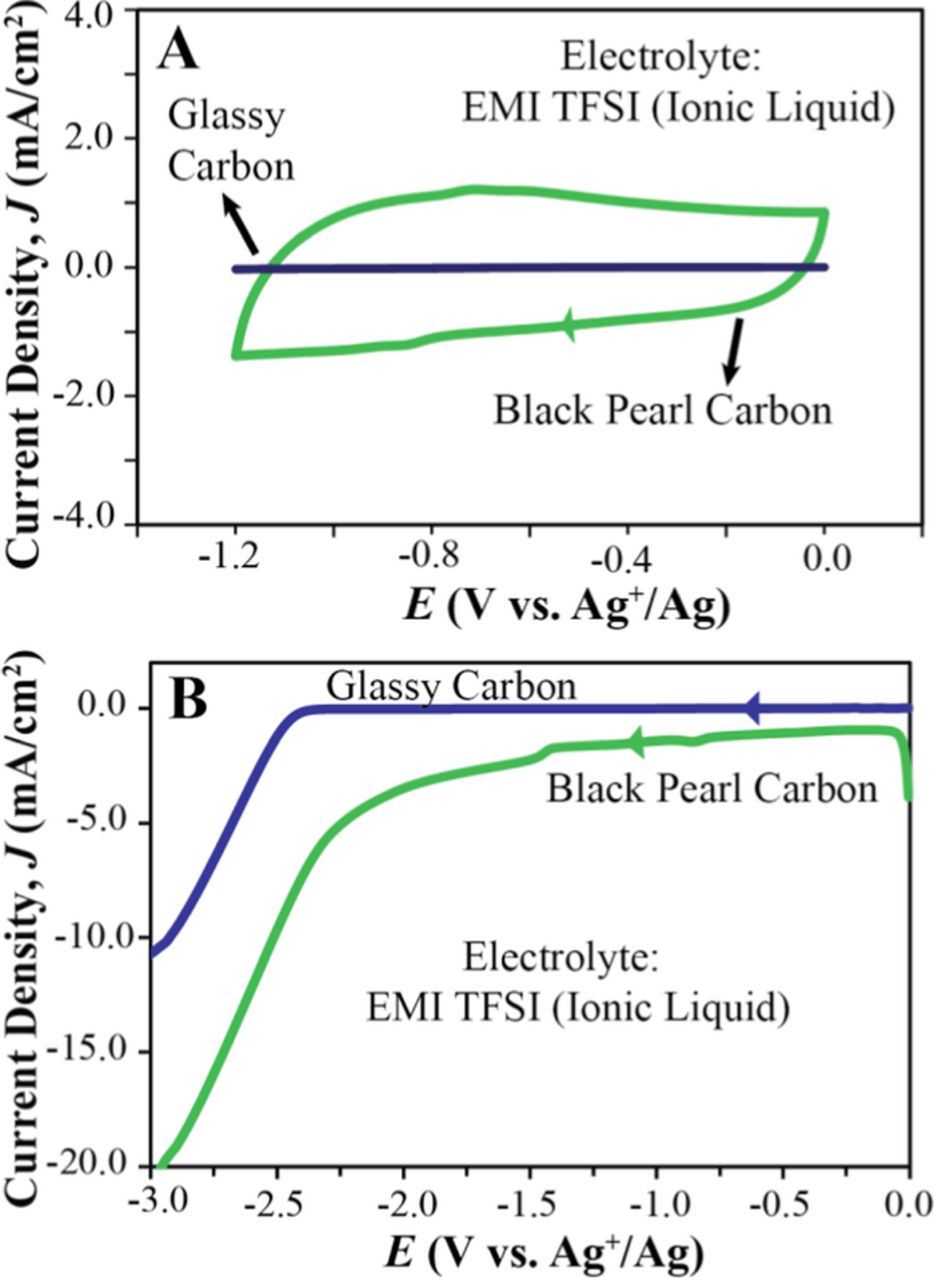
Figure 6. Electrochemical limits at high-surface-area carbon electrodes. CV (A) and linear sweep voltammogram (B) of EMI TFSI at a GC (blue) and a Black Pearl carbon electrode (green). For the CV, the second cycle is shown to avoid first cycle effects. Scan rate, 1 mV/s; Pt coil auxiliary electrode, GC working electrode, and Ag+/Ag reference electrode.
The electrochemical limit of the ionic liquid EMI TFSI (commonly used in electrochemical devices with high-surface-area carbon electrodes22,23) at electrodes consisting of non-porous glassy carbon or of a high-porosity carbon (Black Pearl carbon, 3DOm carbon, or CIM carbon) are shown in Table III for several Jcut-off values. While the onset of reduction occurs at approximately −2.5 V (see Figure 6B), the most commonly used Jcut-off value of 1.0 mA/cm2 predicts for all highly porous carbons unreasonably small cathodic limits in the range of −0.5 to −1.0 V. This is readily explained by the large capacitive current at these high-surface area electrodes.3,24,38 This problem was also observed by Jow and co-workers, who recommended an alternative method for assessing the electrochemical electrolyte stability at electrodes with high surface areas.21,24 They proposed an approach according to which the limit of electrochemical electrolyte stability is defined by the voltage at which the faradaic current associated with electrolyte decomposition reaches one ninth of the capacitive current (i.e., 10% of the total current, also referred to as 1/Rcut-off; see Figure 3 in Ref. 21). Even though this method takes into account the non-faradaic current, introducing an arbitrary cut-off value for Rcut-off opens the door for disagreements on what that value should be. Indeed, Moosbauer et al. already suggested to change the Rcut-off from 0.1 to 0.02 or lower,39 and Weingarth suggested cut-off values of 0.05 for d2R/dV*2 instead.38 In contrast, the linear fit method provides electrochemical stability limits without the need to define any cut-off value, as shown in Table III.
Table III. Cathodic limit of EMI TFSI (V vs. Ag+/Ag) at high surface area carbon electrodes.
| Glassy Carbon | Black Pearl | 3DOm Carbon | CIM Carbon | |
|---|---|---|---|---|
| Jcut-off = 0.5 mA/cm2 | −2.425 ± 0.085 | −0.102 ± 0.128 | −0.185 ± 0.093 | −0.315 ± 0.050 |
| Jcut-off = 1.0 mA/cm2 | −2.500 ± 0.066 | −0.490 ± 0.128 | −0.552 ± 0.131 | −1.012 ± 0.233 |
| Jcut-off = 5.0 mA/cm2 | −2.552 ± 0.045 | −2.298 ± 0.089 | −2.595 ± 0.131 | −2.365 ± 0.380 |
| Linear fit method | −2.510 ± 0.033 | −2.262 ± 0.148 | −2.378 ± 0.067 | −2.330 ± 0.158 |
+Scan rate, 1 mV/s; auxiliary electrode, Pt coil; working electrode, GC; reference electrode, Ag/Ag.
Note that current densities at porous electrodes are calculated here based on the geometric surface area (i.e., the area obtained by projection of the electrode shape on a plane). Due to the micropores and mesopores in the electrode material, the real surface area that is accessible to the electrolyte is much larger than the geometric surface area. Therefore, it is difficult to assess the real current density at these electrodes accurately. The linear fit method does not require converting currents to current densities as the surface area of the electrode appears as a constant in the linear fit equations and will be omitted during the intersection of the two. Therefore, there is no need to know the real surface area of highly porous electrodes, which adds to the convenience of this method.
Conclusions
In this contribution, we illustrated that the determination of electrolyte electrochemical limits with the cut-off current density method has three main disadvantages that can be overcome by the proposed linear fit method. Firstly, the arbitrariness associated with the selection of a cut-off current density results in variabilities of the electrochemical limit of 1.0 V and more, often not providing meaningful electrochemical stability limits. This problem cannot be resolved by recommending one specific cut-off current density for all conceivable systems because this value inherently depends on the electrolyte concentration and diffusion coefficients, as also confirmed by numerical simulations taking into account diffusion and migration as mass transport modes. Choosing a cut-off current density can be avoided by using the linear fit method. The second disadvantage of the Jcut-off method is related to the electrolyte mass transport effects on the current–voltage curve, altering the electrochemical limits determined with the cut-off current density method by as much as 600 mV. The linear fit method minimizes such effects. Finally, the Jcut-off method does not provide a reliable assessment of the electrochemical windows at electrodes with high surface areas, where large capacitive currents are observed, whereas electrochemical windows determined with the linear fit method are minimally affected by capacitive currents.
Acknowledgments
This project was partially supported by a Graham N. Gleysteen Excellence Fellowship and a University of Minnesota Doctoral Dissertation Fellowship to M. P. S. M., and Grant RL-0012-12 from the Initiative for Renewable Energy and the Environment of the University of Minnesota. J. H. appreciates the Krogh family for support with a Lester C. and Joan M. Krogh Fellowship in Chemistry.