Abstract
Gram-scale synthesis of defective graphene foam from low-cost precursors is reported as a catalyst support material for platinum in fuel cell cathodes. The material was produced by combustion of sodium ethoxide, followed by washing and heat-treatment in various gases. The BET surface area is higher than 1500 m2/g. The defects in the material result in excellent distribution of platinum nanoparticles on the surface. The electrochemical performance is compared with platinum-decorated carbon black and commercially obtainable graphene using cyclic voltammetry, linear sweep voltammetry, and membrane electrode assemblies. Pt-decorated graphene foam has larger electrochemical surface area (101 m2/g) and higher mass activity (176 A/gPt). However, durability and fuel cell power density still require improvements. This graphene foam is a potentially useful catalyst support, especially for use in polymer electrolyte membrane fuel cells.
Export citation and abstract BibTeX RIS

This is an open access article distributed under the terms of the Creative Commons Attribution Non-Commercial No Derivatives 4.0 License (CC BY-NC-ND, http://creativecommons.org/licenses/by-nc-nd/4.0/), which permits non-commercial reuse, distribution, and reproduction in any medium, provided the original work is not changed in any way and is properly cited. For permission for commercial reuse, please email: oa@electrochem.org.
Graphene is a promising material in electrochemistry due to its large surface area, high electrical conductivity, thermal conductivity, impressive strength, and wide electrochemical potential window. High quality, single layer crystalline graphene can be obtained by exfoliation of highly oriented pyrolitic graphite (HOPG);1,2 chemical vapor deposition;3 unzipping of carbon nanotubes;4 or thermal decomposition of silicon carbide.5 However, these methods are not suitable for large-scale synthesis of large surface area graphene powder. A common method for the bulk preparation of graphene powder is by synthesis and subsequent reduction of graphene oxide by thermal, or chemical methods.6,7 Although promising, these methods use expensive and complex multistage procedures, the surface area is generally limited to below 1000 m2/g, and the resulting reduced graphene oxide (rGO) is fairly defective. Recently, solvothermal chemistry has been employed for synthesizing graphene, which has made it possible to produce large quantities with varying quality.8–10
Polymer electrolyte membrane fuel cells (PEFCs) are clean and environmentally friendly power sources for stationary, portable, and vehicular applications. They display rapid response times, high power densities and are extremely energy efficient. Currently, carbon-supported platinum is the industry standard electrocatalyst in PEFCs, but the high cost of platinum and deterioration of the electrocatalyst are two of the main obstacles to widespread commercialization. Oxidation of the carbon support is the most serious problem in electrocatalyst deterioration, leading to Pt nanoparticle aggregation, detachment of the catalyst particles from support material, and catalyst poisoning.
There are several reports in which graphene is utilized as catalyst support material for PEFCs, with varying success.11–17 We believe that restacking of the suspended graphene sheets as the electrocatalyst ink dries on the electrode is one of the limiting factors of the performance of graphene in PEFCs to date. To retain the large surface area and maximize the triple-phase boundary for the electrochemical oxygen reduction reaction (ORR), some kind of three-dimensional graphene network is required.
Here, we synthesize graphene foam with a three-dimensional structure,18 via combustion of sodium ethoxide, followed by washing and then pyrolysis in nitrogen and hydrogen atmosphere. The resulting material has very large specific surface area, and after Pt-decoration results in an electrocatalyst with high mass activity for oxygen reduction at the cathode in PEFCs.
Experimental
Chemicals were analytic reagent grade and used as received without further purification. Sodium and perchloric acid were obtained from Aldrich. Anhydrous ethanol, dichloromethane, 2-propanol, 5% Nafion dispersion solution and platinum (II) acetylacetonate were purchased from Wako. Vulcan XC-72 carbon black (CB) and Grade-3 graphene powder (CG) were supplied by Cabot Corp., and cheaptubes.com, respectively. Deionized water was used in all cases.
Preparation of graphene foam
Graphene foam was synthesized by combustion of sodium ethoxide,9,19 which was placed in an ignition dish, and simply burned. The white alkoxide burns with a steady yellow flame, resulting in a black powder. This powder was first crushed, sonicated and washed in deionised water to remove residual sodium oxides, and then dried under vacuum. Subsequently, the sample was heat treated at 800°C for 1 hour, under 100 sccm nitrogen flow. The sample was again washed in deionized water to remove formerly trapped sodium oxides now exposed by the pyrolysis procedure. This results in the first sample; referred to as GF. The second sample, GFII was obtained by heat-treatment of GF under 5% hydrogen / 95% nitrogen gas flow (100 sccm) at 1000°C for 5 hours in order to reduce the oxygen content.
Preparation of platinum-decorated carbons
Platinum decoration was performed by dissolving bis(acetylacetonate)platinum(II) in dichloromethane, then slowly adding the prospective carbon support (CB, CG, GF, or GFII). This dispersion was sonicated for 100 minutes in cold water; removing the solvent via evaporation. After completion, the powdery product was transferred to an infrared lamp furnace, and heated at 210°C for 3 h, then 240°C for 3 h under 1000 sccm nitrogen flow, in order to reduce the platinum (II) to platinum metal nanoparticles.
Materials characterization
Samples were characterized by scanning electron microscopy (SEM, Hitachi S-5200, Japan); transmission electron microscopy (TEM, JEM-ARM200F, JEOL, Japan); BET surface area analysis (Belsorp mini II-VS, Bel Japan, Inc.); X-ray photoelectron spectroscopy (XPS, ESCA-3400, Kratos Analytical Ltd., UK); Raman spectroscopy (DM2500M, Renishaw, UK, using an argon-ion laser at 532 nm); X-ray diffraction (XRD, RINI Ultima III, Rigaku, Japan, Cu Kα-radiation, λ = 1.54 Å); and transmission electron microscopy (TEM, Hitachi, HD-2300A, Japan). Thermo-gravimetric analysis (TGA, Thermo plus PS1500, Rigaku, Japan) was used to calculate the platinum loading, by heating the samples to 800°C at 4°C min−1 in air.
Preparation of the electrode
Working electrodes were prepared according to the recommended method described by the Fuel Cell Commercialization Conference of Japan (FCCJ).20 The Pt-decorated carbon materials were dispersed in a mixture of deionized water, 2-propanol and 5% Nafion solution, in a volume ratio of 19:6:0.1. The resulting electrocatalyst ink was then sonicated with a high energy homogenizer for 30 min. A glassy carbon-disk platinum-ring electrode (0.196 cm2, Hokuto Denko Corp.) was carefully and precisely coated with 10 μL catalyst ink, and then dried at 60°C for 15 min. The resulting density of electrocatalyst material on the glassy carbon electrode was 17.3 μgcm−2.
Electrochemical analysis
Electrochemical measurements were carried out using a typical rotating ring-disk electrode (RRDE) system (HX-107, Hokuto Denko Corp., Japan) in N2-saturated 0.1 M perchloric acid. All potentials were calculated relative to the reversible hydrogen electrode (RHE). The working electrode was a glassy carbon-disk platinum-ring electrode; the counter electrode was a platinum wire; and Ag/AgCl was used as the reference electrode. Cyclic voltammograms (CV) were obtained in the range of 0.05 to 1.2 V vs. RHE, with a scan rate of 50 mVs−1 in N2-saturated solution. Linear sweep voltammograms (LSV) were performed in the range 0.2 to 1.2 V vs. RHE with a scan rate of 10 mVs−1 in O2-saturated electrolyte, at various rotating speeds (400, 900, 1600, and 2500 rpm). Electrocatalyst start/stop durability tests were performed according to a triangular potential cycle protocol method (recommended by the FCCJ),20 from 1.0 V, to 1.5 V, to 1.0 V vs. RHE, each cycle lasting a total of 2 seconds. During durability testing, a gold electrode was used as the working electrode instead of glassy carbon, to prevent corrosion of the carbon electrode.
Membrane electrode assembly (MEA) preparation/characterization
Electrocatalyst ink was prepared with 28 wt% Nafion ionomer ratio. Pt/KB (46.2 wt% Pt, Tanaka, Japan) was used as the anode electrocatalyst, whilst Pt/CB, Pt/CG, and Pt/GFII were used as cathode electrocatalysts. The electrocatalyst ink was sprayed using an automatic spray deposition system (Nordson, C-3J) uniformly onto both sides of Nafion 212 membranes with an electrode area of 0.5 cm2, and with a Pt loading of 0.3 mgcm−2. Hydrophobic carbon paper was used as gas diffusion layer, hot-pressed onto both sides of the MEA at 130°C and 1.6 kN. The MEAs were assembled into a 1 cm2 fuel cell prototype single cell. The MEAs were first conditioned under air and hydrogen flow (100 sccm, 1 atm) at the cathode and anode, respectively, at 200 mAcm−2 for 4 h. All test processes were carried out at 80°C. The data for IV characteristics were obtained using a current pulse generator (HC-111, Hokuto Denko Corp., Japan).
Results and Discussion
SEM images show the morphologies of the four carbon supports. Carbon black (CB, Fig. 1a) has a typical spheroidal structure with a particle size of ∼50 nm. The commercially sourced graphene (CG, Fig. 1b) is a mixture of apparently amorphous carbon and laterally large, thin sheets, presumably comprising several layers of graphene. The nitrogen treated (GF, Fig. 1c-1d) and hydrogen treated (GFII, Fig. 1e-1f) graphene foams both have very similar structures; a highly porous, three-dimensional framework, with micron-scale voids separated by thin carbon walls. The size of the voids is slightly different, but this only reflects variation across the same sample, and is not due to the hydrogen treatment. Higher resolution images pick out the structure in more detail, with thin, micron-scale graphene sheets observed, some of which are electron transparent even in SEM mode, confirming their extremely thin nature. The H2-treated sample (GFII) displayed fewer charging effects during imaging, suggesting that this treatment is successful in removing amorphous carbon and oxygen impurities and therefore increasing the electron conductivity. TEM images (Fig. 1g-1h display the three-dimensional nature, and the extremely thin nature of the walls in more detail. In particular, two individual defective graphene layers can be observed in Fig. 1h.
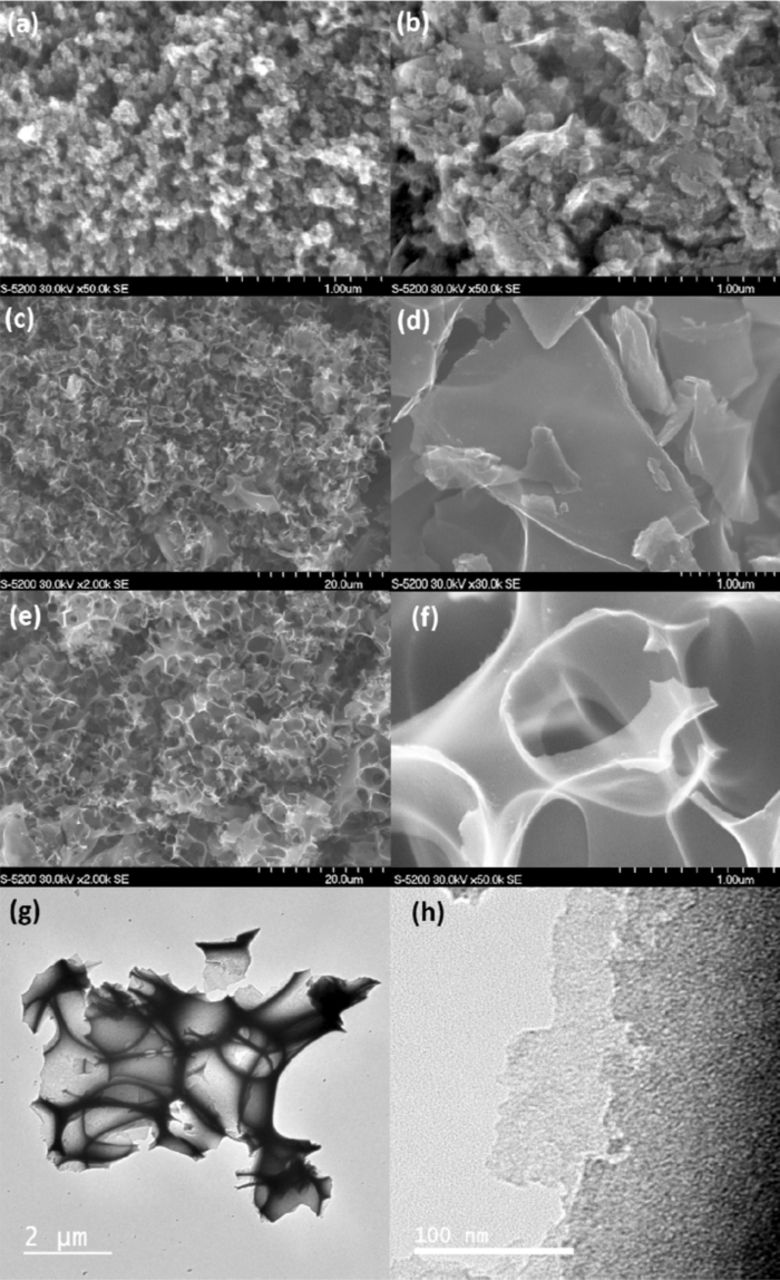
Figure 1. SEM images of (a) carbon black; (b) commercial graphene; (c, d) graphene foam GF; (e, f) hydrogen treated graphene foam, GFII. (g-h) STEM images of GFII.
The specific surface area and pore size, respectively, were calculated using the BET nitrogen gas adsorption method as 237 m2/g and 10.4 nm for CB; 652 m2/g and 8.7 nm for CG; 1549 m2/g and 2.1 nm for GF; and 1586 m2/g and 3.4 nm for GFII. The surface area of the graphene foam is much higher than that of CB or CG. This is attributed to the 3D topography which prevents the restacking generally observed in conventional graphene powders, limiting their surface area. The pore size distribution (Figure 2) suggests that both CB and CG have a significant number of pores greater than 20 nm in radius. However the graphene foam pore size is much smaller than this, although it increases slightly after high temperature hydrogen gas treatment. This suggests that hydrogen treatment is effective in cleaning the sample, removing oxygen atoms, and therefore opening up pores. Assuming that the maximum surface area of single-layer graphene is 2630 m2/g,1 the measured surface area corresponds to ∼1.7 graphene layers. This is supported by atomic force microscopy on graphene foam samples,18 which reveals a thickness of around 2 nm, corresponding to several graphitic layers.21

Figure 2. (a) Pore size distribution. (b-e) XPS C1s spectra. (f-i) XPS O1s spectra.
XPS was performed for elemental analysis. The oxygen contents for CB, CG, GF, and GFII are; 8.1, 6.6, 8.6, and 7.4 at%, respectively. GF has the highest oxygen content, but this is slightly reduced by hydrogen treatment. This is in reasonable agreement with EDX analysis, which gave oxygen contents of 5.3, 8.5, and 4.9 at% for CG, GF, and GFII, respectively. Figures 2a-2d compare XPS C1s spectra of the four support materials, which are all very similar, except that CB seems to have a slightly greater proportion of CO bonds. Figures 2e-2h compare O1s spectra. The main difference is that there appear to be a greater proportion of specifically C=O and O-H bonds in the graphene foam samples compared with carbon black and commercially available graphene.
XRD patterns are shown in Figure 3a. Crystalline materials have sharp XRD peaks, whilst amorphous materials have broad peaks. In graphitic systems the crystal planes are observed at (002) corresponding to the graphitic interlayer spacing; and (100) corresponding to the in-plane hexagonal atom arrangement. CB has a broad (002) peak centered at 24.5°; and a smaller, broad (100) peak at 44°, suggesting that it is a relatively amorphous system. CG has a very sharp (100) peak at 26.5°, and also has a broad (002) peak at 44°, showing that the crystallinity is more well-defined. Both GF and GFII have almost identical spectra with broad (100) peaks at 21.6° and just-discernable broad (002) peaks centered at ∼45°. The graphitic spacing for CB, CG, GF, and GFII calculated from these peaks are 0.36, 0.34, 0.41, and 0.42 nm, respectively; larger for the graphene foams than the other samples, and reflecting the amorphous nature of the material. The (002) peak is expected to be weak in the graphene foam samples, since the graphene layers are separated by several microns due to the 3D topography. However, the (100) peaks are extremely broad. This belies the highly defective nature of this material, as expected considering the catalyst-free method and low synthesis temperature. Despite this, the results are similar to those reported for rGO in the literature.22
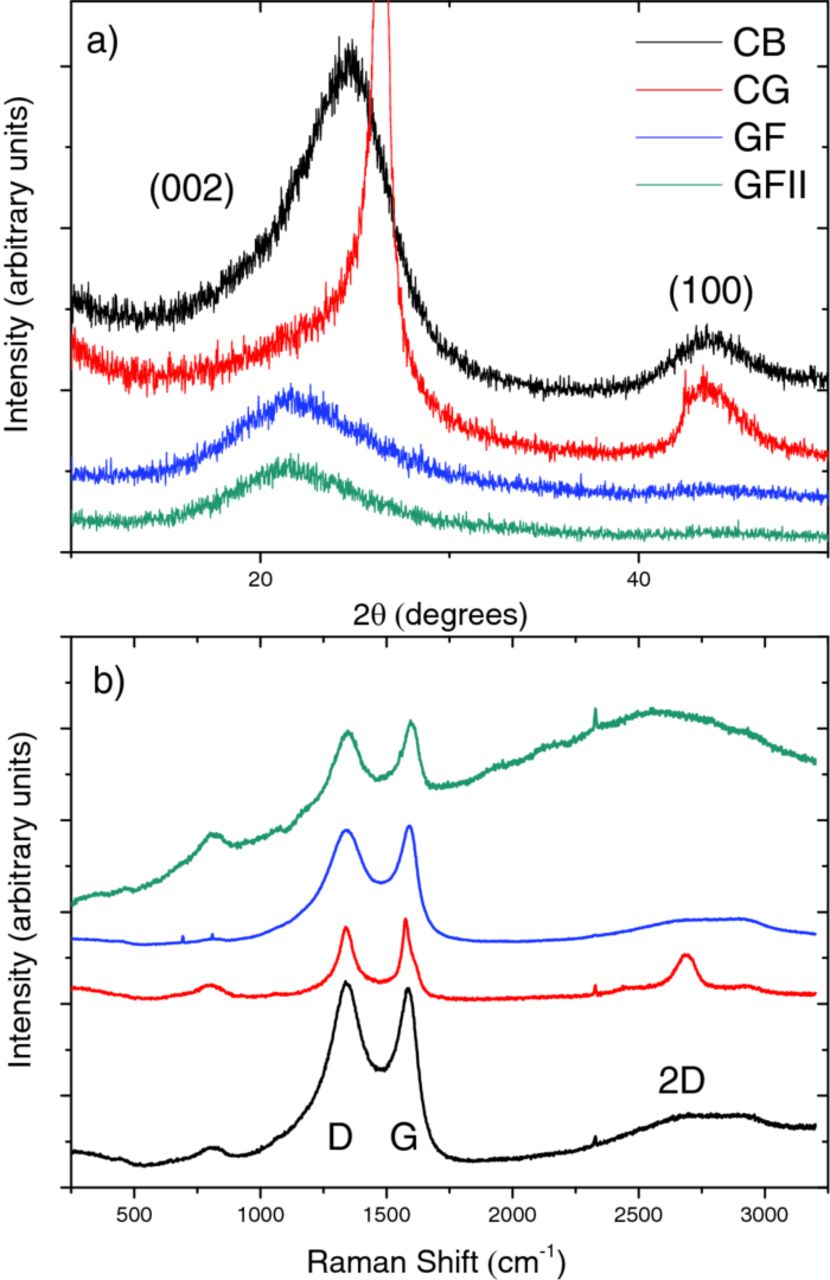
Figure 3. (a) XRD, and (b) Raman spectra of CB, CG, GF and GFII.
Figure 3b shows Raman spectra. There are three main peaks; the G peak (1595 cm−1) is due to bond stretching of pairs of sp2 atoms; the D peak (1337 cm−1) associated with the breathing mode of sp2 aromatic rings, activated by defects; and the 2D peak (2740 cm−1), which is an overtone of the D peak, but visible without the presence of defects.23 The ratio between the intensities of the D and G peaks (ID/IG) can give information about the in-plane crystallite size, and therefore extent of disorder. The value of this ratio is 1.03 for CB, 0.89 for CG, 0.97 for GF, and 0.97 for GFII. This suggests that CB is the most defective carbon (in contrast with the XRD results), with CG being the most graphitized (as expected), with GF and GFII somewhere in-between. Hydrogen treatment at 1000°C seems to have negligible effect on crystallinity. The 2D peak is a good indicator of graphene-like properties, and is clearly visible in CG. It is barely present in CB, as expected. In GF, the 2D peak is just discernable; however it is not visible in GFII, possibly due to the large degree of background noise in this measurement. Given that these samples are synthesized at relatively low temperature with no catalyst, and that the oxygen content is fairly high, it is no surprise that the 2D peak is small. However, the Raman signal is consistent with reports of rGO in the literature,24 of which our graphene foam seems to be of similar quality.
Approximately 20 wt% platinum particles were decorated on CB, CG and GF, as outlined in the experimental methods section. As the surface area of the defective graphene foam samples was so high, the loading was increased to 33 wt% for GFII in order to produce similar Pt nanoparticle size to CB and CG. TEM images of the resulting Pt/C samples are shown in Figure 4. Pt/CB shows typical results for this type of support, with a Pt particle size of 2.93 nm, obtained using Scandium image processing software. There is some clustering of the Pt nanoparticles. Pt/CG shows a good distribution of Pt, with a Pt particle size of 2.35 nm. Pt/GF has very good Pt distribution (possibly due to the relatively high oxygen content offering binding sites for Pt nucleation), with a smaller particle size of 2.29 nm (due to the larger surface area). Pt/GFII has a similar distribution of Pt nanoparticles as Pt/CB and Pt/CG, with a similar particle size of 2.95 nm.
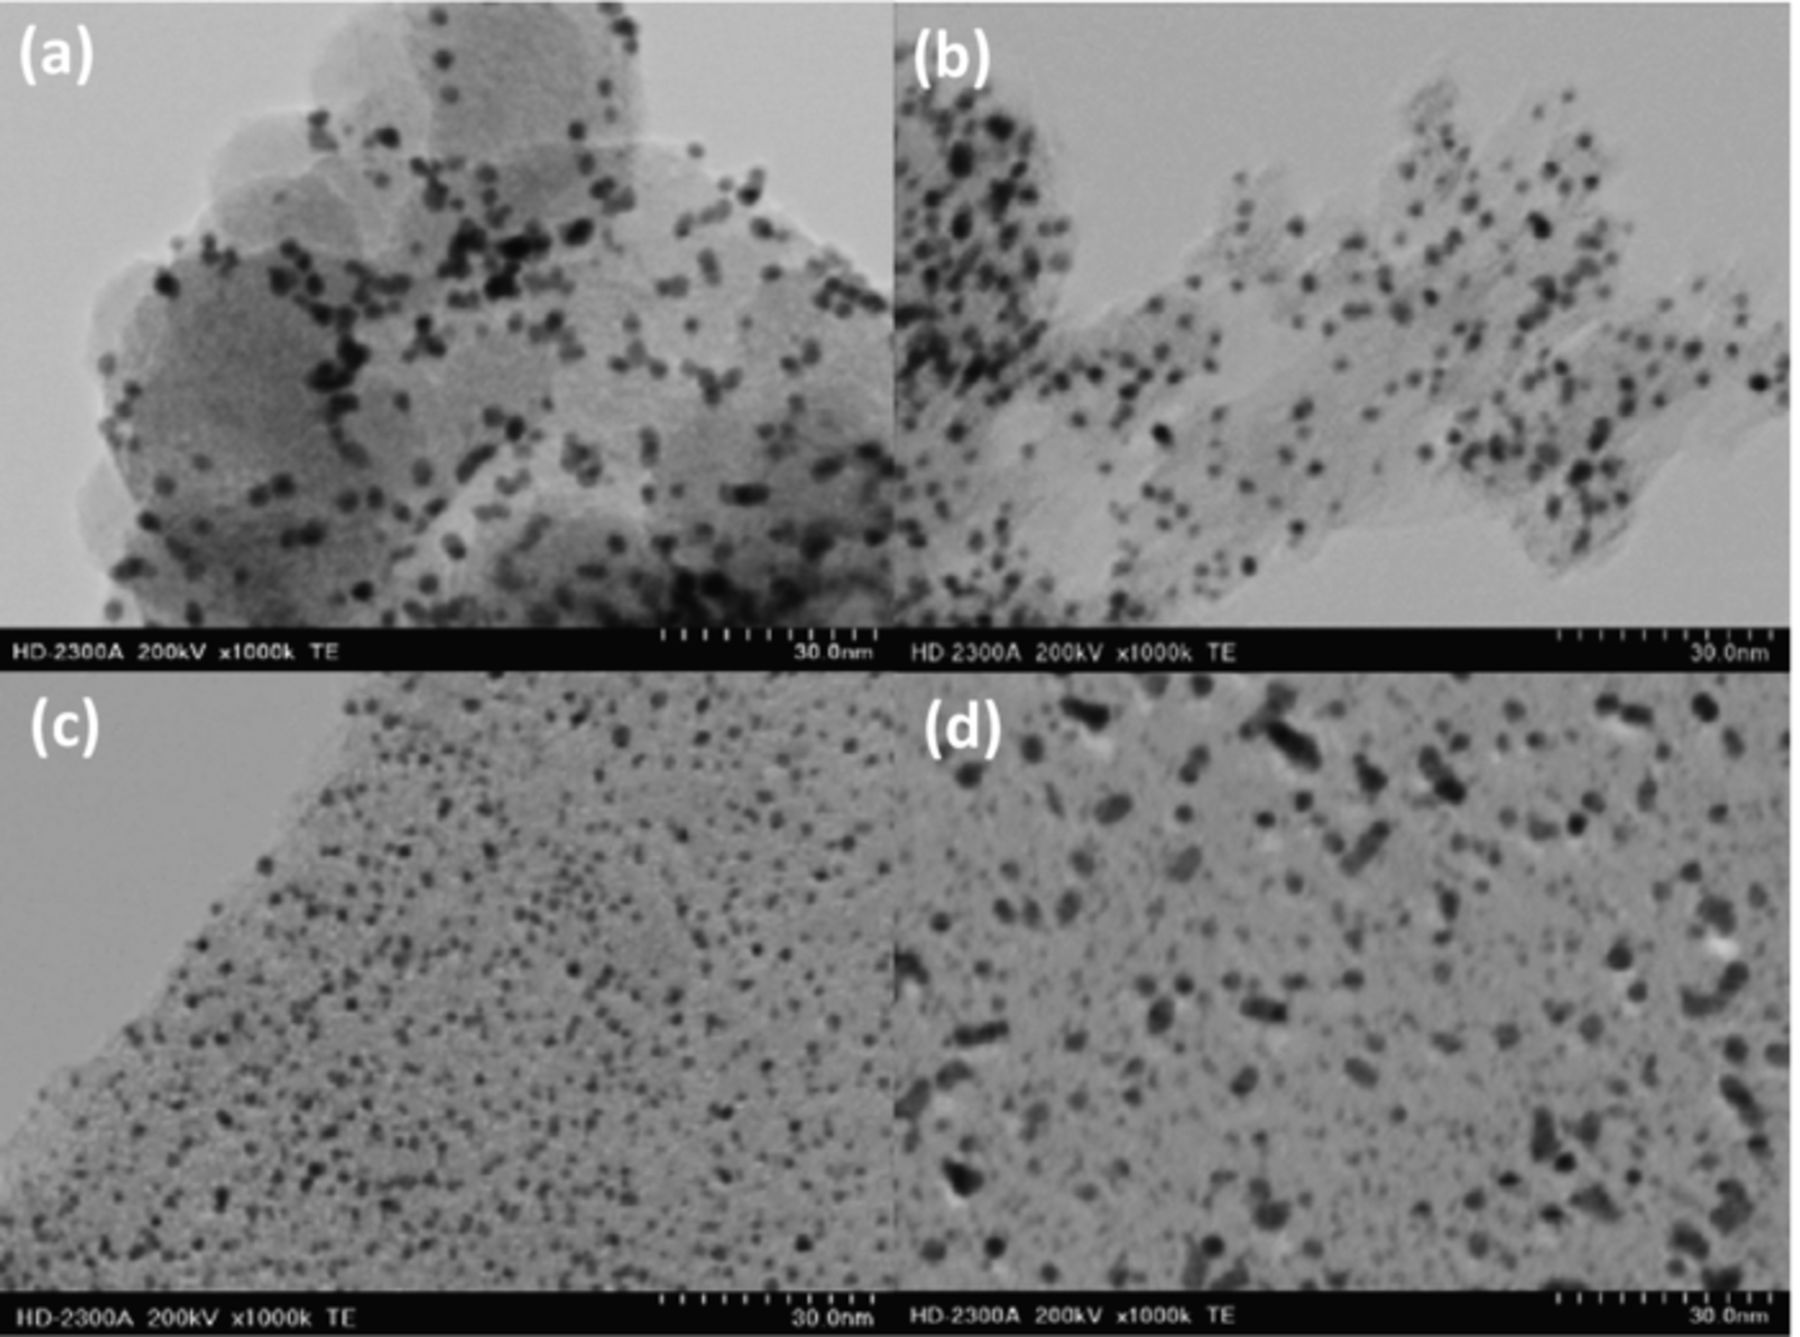
Figure 4. TEM images of (a) Pt/CB, (b) Pt/CG, (c) Pt/GF, and (d) Pt/GFII.
XRD patterns of the four Pt/C samples are shown in Figure 5a. The diffraction peak at 2θ = 39° corresponds to Pt(111) planes of the face-centered cubic structure of crystalline platinum. Both Pt/CB and Pt/CG show sharp Pt(111) peaks, typical of Pt/C electrocatalysts. This peak is much broader in Pt/GF, due to the smaller Pt nanoparticle size. For Pt/GFII the peak is similar to that of both Pt/CB and Pt/CG, showing that the higher Pt loading was successful in replicating the Pt particles on Pt/CB. The Pt crystallite sizes were derived using the Scherrer equation25 to be; 2.9 nm (Pt/CB), 2.5 nm (Pt/CG), 1.7 nm (Pt/GF), and 3.0 nm (Pt/GFII), in good agreement with the results obtained from the TEM images.
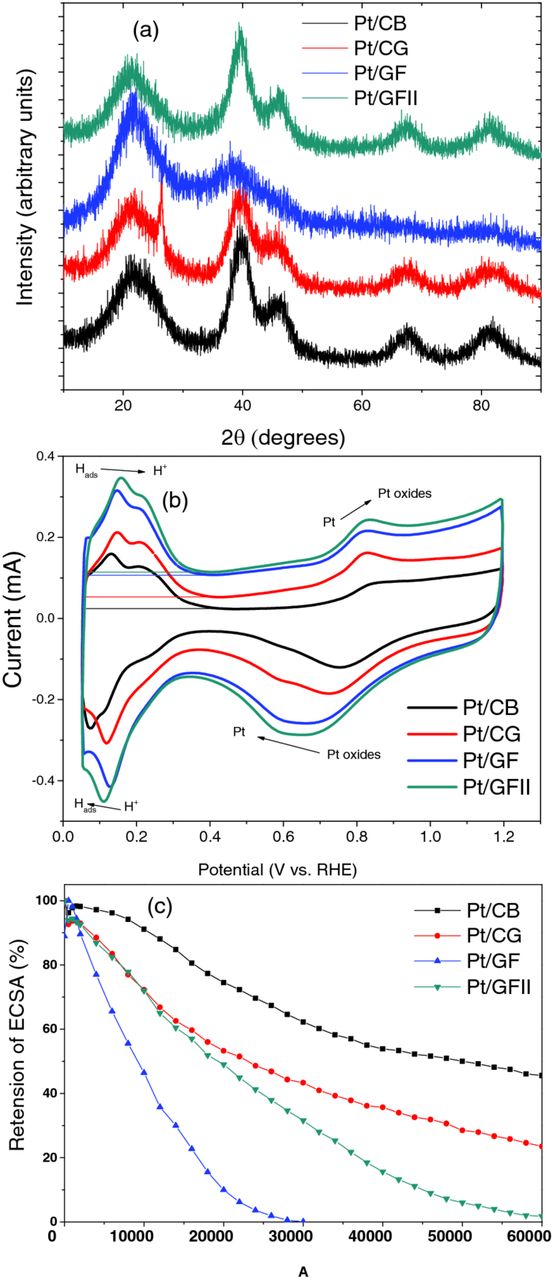
Figure 5. (a) XRD patterns, (b) cyclic voltammograms, and (c) ECSA retention with number of start-stop cycles for Pt/CB, Pt/CG, Pt/GF, and Pt/GFII.
Cyclic voltammetry (CV) results are shown in Figure 5b. The double layer capacitance increases from CB to CG, GF, and GFII, which is consistent with the increase in physical surface area of the samples. The accessible electrochemical surface area (ECSA) of platinum was calculated from the area under the hydrogen desorption curve (top right). The resulting charge corresponds to the number of hydrogen atoms desorbed, and therefore the number of adsorption sites. Using a conversion of factor of 210 μCcm−2, the active electrochemical surface area of the electrode can be estimated.26 The ESCA values found here are: 68.0 ± 5.4 m2/g (Pt/CB), 73.1 ± 3.5 m2/g (Pt/CG), 95.1 ± 4.8 m2/g (Pt/GF), and 100.7 ± 8.0 m2/g (Pt/GFII). Clearly the graphene foams have much higher ECSA, indicating that they have potential for use as catalyst supports.
The relative durabilities of the electrocatalysts were compared by recording the retention of ECSA over 60,000 cycles using accelerated start/stop tests, as shown in Figure 5c. After the test, Pt/CB retains 45.6 ± 7.2% ECSA, with extremely low degredation rate during the early cycles. Pt/CG has 30.9 ± 5.2% retention, with a much faster degredation rate in early cycles. The faster degredation may be due to the higher crystalinity of the sample, as evidenced by XRD and Raman, leading to weaker interation between the platinum nanoparticles and the surface. Pt/GF quickly lost all of its activity after just 30,000 cycles. This is attributed to facile oxidization of the GF support, as observed by the appearance of a strong redox couple in the CV measurements (not shown), usually associated with oxygen functional groups. Additionally, the smaller Pt size may contribute to the faster degredation rate. High temperature hydrogen treatment to form GFII doubles the durability, with Pt/GFII retaining some activity up to 60,000 cycles, possibly due to the greater resistance to oxidation compared to GF, afforded by heat-treatment in hydrogen gas. However, the durability of Pt/GFII is still well below those of Pt/CB and Pt/CG, and optimization is clearly needed. Improving the durability, and investigating the applicability of such materials for use in fuel cells will be one of the major goals of future work on this electrocatalyst. This will be achieved by graphitizing the samples at higher temperature, or though nitrogen doping in order to increase the binding energy between Pt and the graphene surface.
TEM images of the electrocatalysts after durability testing are shown in Figure 6a-6d (compare with the pre-test images in Figure 4). Particle size distribution plots are shown in Figure 6e-6h. All four samples appear to show some Pt nanoparticle detachment/dissolution, and agglomeration (as expected for such a harsh potential cycling test), clearly observed in both the TEM images and the particle size distribution plots. However, the graphene foam samples also still have reasonable amounts of platinum nanoparticles with good spacial distribution after cycling in the TEM images. This is also reflected in the particle size distribution plots, where the increase in particle size is not as extreme as in the cases of CB and CG. This is in contrast with the poor electrochemical durability of GF and GFII. This suggests that the loss in activity may be due to oxidation of the support, rather than loss of platinum, supported by the appearance of a strong redox couple in the CV measurements. Therefore we may be able to improve the durability of these electrocatalyst layers by by improving the resistance to oxidation, for example by graphitization at high temperature. Some delamination of the electrocatalyst ink from the gold electrode was also observed on inspection of the electrode after the measurements. We are currently attempting to prevent this by optimization of the Nafion ratio, and by reducing the graphene foam particle size.
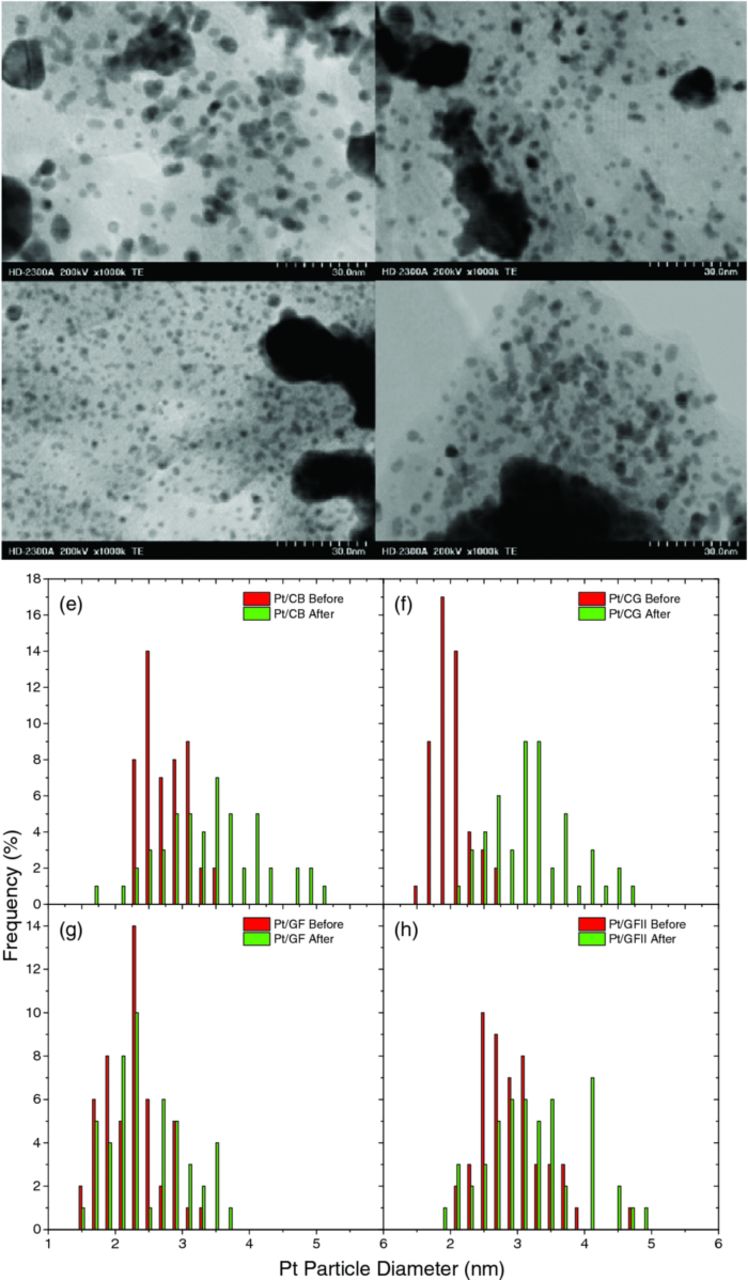
Figure 6. (a-d) Post-durability cycling TEM images, and (e-h) particle size distribution plots before and after durability cycling, for Pt/CB, Pt/CG, Pt/GF, and Pt/GFII, respectively.
Linear sweep voltammograms (LSVs) were performed in O2-saturated 0.1 M HClO4 (Figure 7a). The LSV for Pt/CB is typical, with an onset potential (where a current density of 2 μA/cm2 was obtained) of 1.08 V, a specific activity (the current per unit ECSA, measured at 0.9 V) of 205.2 ± 8.8 μAcm−2, and a mass activity (the current per unit mass of Pt) of 137.8 ± 14.8 AgPt−1. Pt/CG has an onset potential of 1.06 V, a specific activity of 205.7 ± 8.8 μAcm−2, and a mass activity of 168.7 ± 10.1 AgPt−1. The onset potential is slightly worse than Pt/CB, the specific activity is similar, and the mass activity is slightly higher, showing that commercially available graphene is comparable to carbon black as a Pt support for the ORR. Pt/GF has an onset potential of 1.05 V, a specific activity of 111.1 ± 11.2 μAcm−2, and a mass activity of 113.5 ± 9.1 AgPt−1. These values are all lower than the other electrocatalysts. Additionally, the current density in the mass transport limited current region is much lower than the other samples, which may be due to low electonic conductivity (due to high oxygen content). Finally, Pt/GFII has an onset potential of 1.08 V, a specific activity of 174.5 ± 3.1 μAcm−2, and a mass activity of 176.1 ± 10.7 AgPt−1. The onset potential is equal to that of Pt/CB, the specific activity is slightly lower, but the mass activity, one of the main markers of the effectiveness of an electrocatalyst, is significantly higher than all the other samples. The current density in the mass transport limited current region is much higher than for Pt/GF, possibly due to the reduction in oxygen content. These results demonstrate that graphene foam subjected to high temperature hydrogen gas treatment has potential to be used as an electrocatalyst support in PEFCs, once the issue of durability is dealt with.
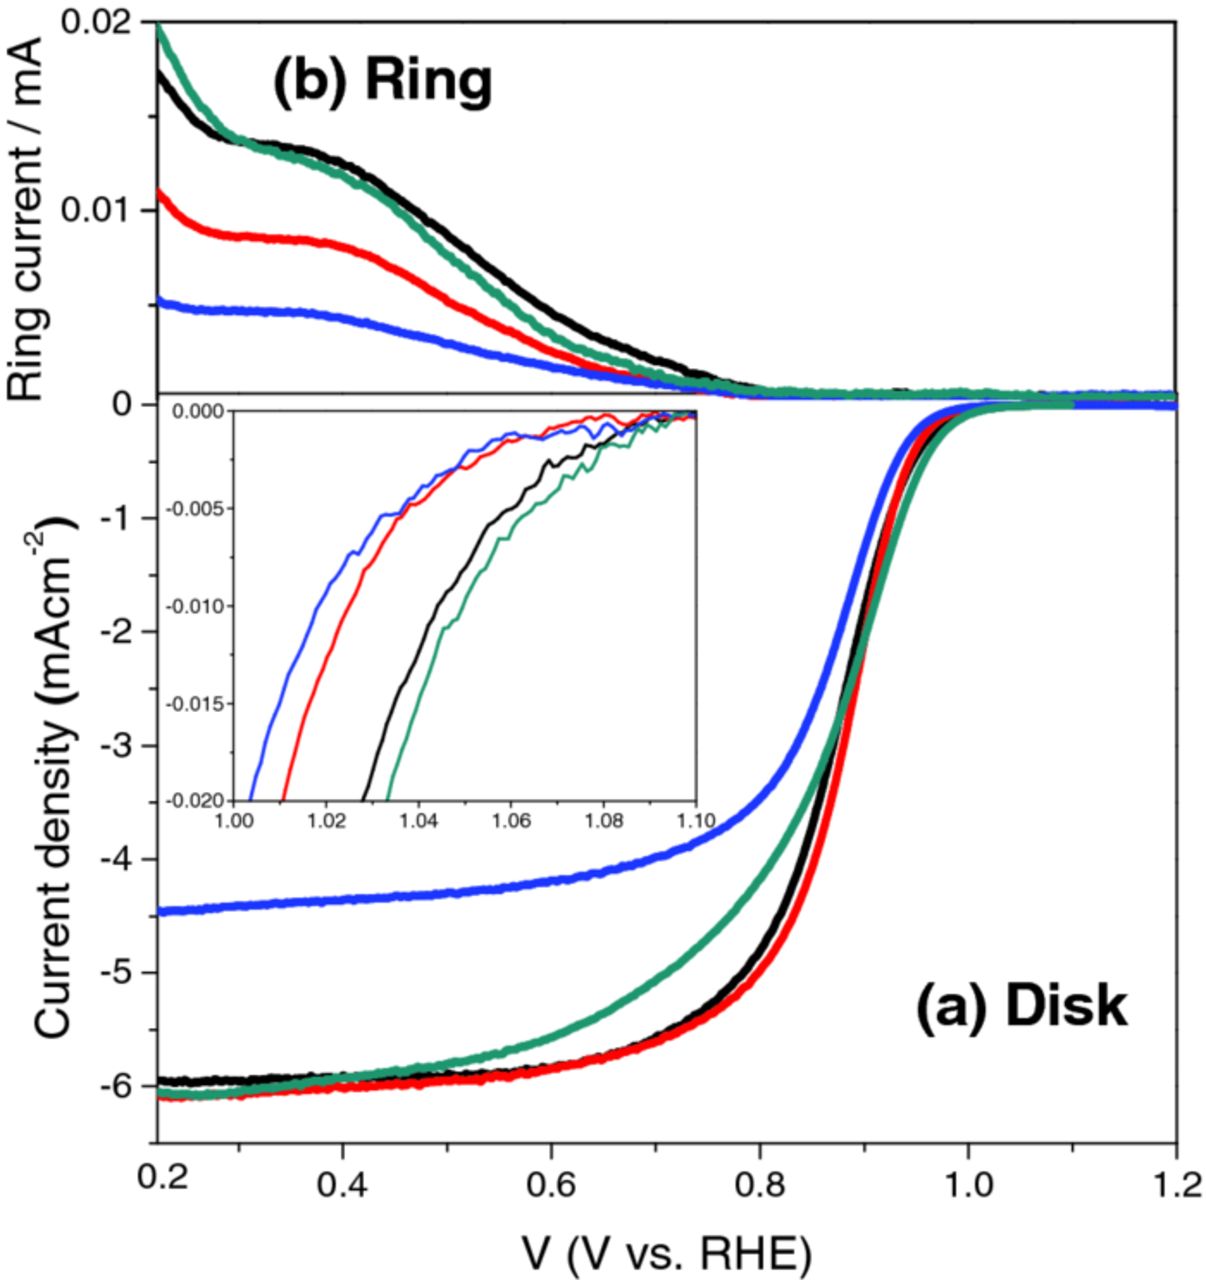
Figure 7. (a) Rotating disk current density in 0.1 HClO4 at 25°C with a scan rate of 10 mVs−1 and a rotation speed of 1600 rpm. (b) Ring current.
The ORR reaction can occur via a 2-electron pathway which results in the formation of H2O2 (which is detrimental to PEFC performance), or the desired 4-electron pathway which results in the formation of H2O. The electron transfer numbers were calculated from amount of hydrogen peroxide produced at the ring electrode (Fig. 7b) to be 4.0 to 3 significant figures for all samples at 0.8 V, as expected. We are also currently investigating the effect of platinum electrocatalyst loading and will present our results in a future publication.
Membrane electrode assemblies (MEAs) were fabricated in order to test the full cell characteristics. Only Pt/CB, Pt/CG, and Pt/GFII were incorporated into MEAs due to the unsatifactory half-cell results of Pt/GF. The I-V polariztion curves and power densities are presented in Figure 8. In the IV curves, Pt/CB has the best performance at high current density. This highlights the fact that carbon black is a tough benchmark to beat. The performance of Pt/CG and Pt/GFII are strongly mass transport limited in this region, despite having similar perfomance in the LSVs. This may be because MEA preparation is optimized for carbon black; in particular the Nafion ratio. The graphene materials have different microstructure and surface area, and are expected to require a higher Nafion ratio. This unoptimized ink would affect especially the mass transport limited region. We are currently optimizing Nafion ratio and Pt-loading. Promisingly, in the low current density region (inset), both Pt/CG and Pt/GFII have lower activation polarization losses than Pt/CB, further highlighting that optimization could significantly improve MEA performance. The MEA power densities for Pt/CB, Pt/CG, and Pt/GFII are 300 ± 5.5, 260 ± 10.7, and 200 ± 6.9 mW/cm2, respectively.
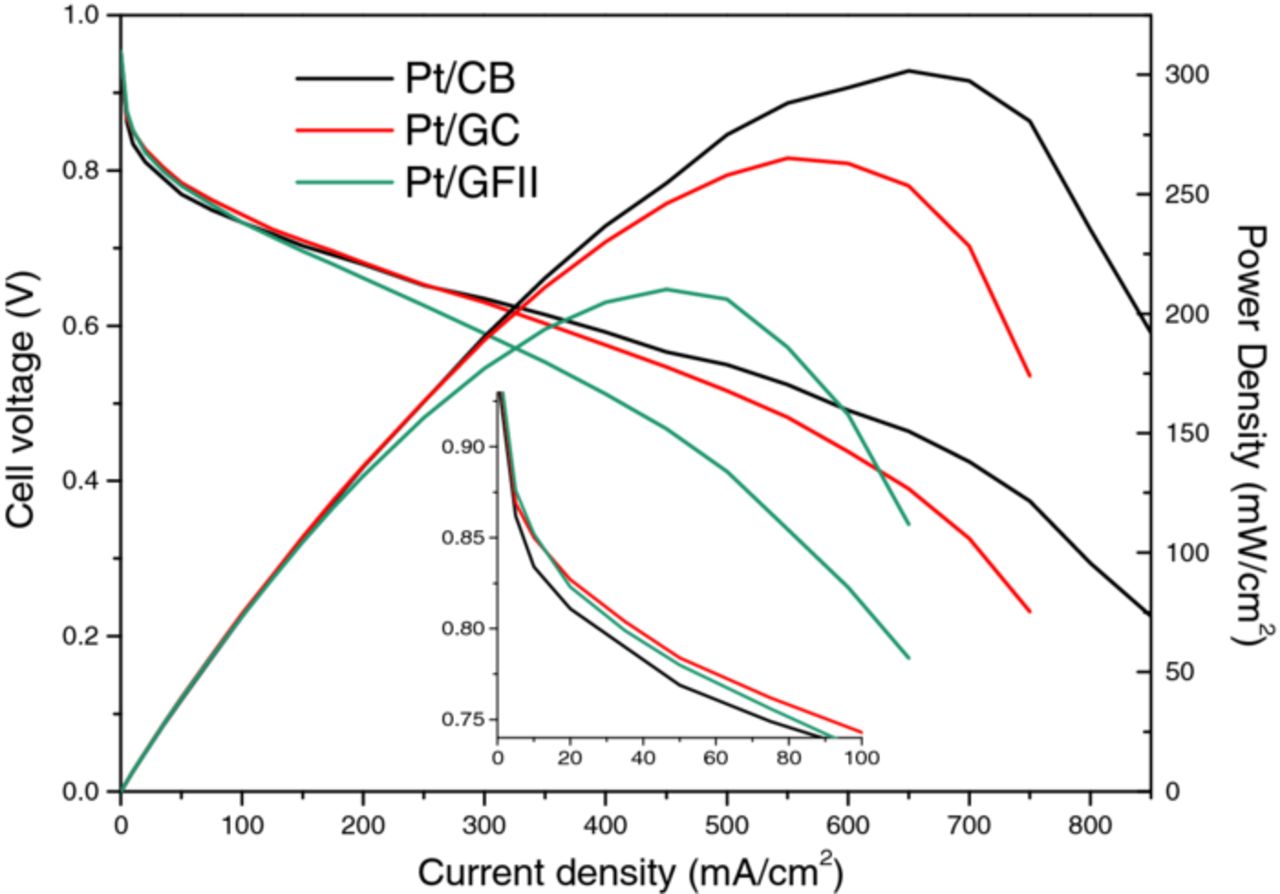
Figure 8. MEA polarization curves for Pt/CB, Pt/GC, and Pt/GFII.
Conclusions
In conclusion, we synthesized a low cost defective graphene foam with large surface area, suitable for use as an electrocatalyst support. This was decorated with platinum nanoparticles, then compared with carbon black and a commercial graphene. The graphene foam performed well, especially after high temperature hydrogen gas reduction treatment. The ECSA was 50% higher (101 m2/g) and the mass activity was 30% higher (176.1 AgPt−1) than for Pt/CB during half-cell ORR testing; however the durability needs to be improved. Promisingly, in membrane electrode assemblies, the graphene foam showed better performance than carbon black in the activation polarization region, but significantly worse performance in the mass diffusion limited region. We are currently attempting to improve the performance of the graphene foam by high temperature graphitization, reducing particle size, varying Pt loading, and optimization of the electrocatalyst ink ratios.
Acknowledgments
The authors gratefully acknowledge the support of the International Institute for Carbon Neutral Energy Research (WPI-I2CNER), sponsored by the World Premier International Research Center Initiative (WPI), MEXT, Japan; as well as the International Research Center for Hydrogen Energy (Kyushu University) for funding. Additionally we thank the China Scholarship Council for the PhD funding of Liu.