Abstract
In this paper, direct-modeling-based Lattice Boltzmann Method (LBM) combined with in-situ flow visualization, is used to explore fundamentally the transport of liquid-water inside the gas-diffusion layers (GDLs) used in polymer electrolyte fuel cells. Studies of the water evolution, water saturation, and breakthrough pressure inside a GDL with single and multiple injection points under land and channel geometries are explored. The model and experiment demonstrate good agreement between geometries of GDLs provided in this study which were obtained by a three-dimensional (3-D), reconstructed micro-structure from micro X-ray computed tomography (CT). The overall predictions of water evolution within the GDL agree well with the data visualized from the X-ray CT experiment for all cases studied. It also reveals that the liquid-water saturation profiles inside the GDL and breakthrough pressure are different when the location of the water injection point is altered, thereby providing analysis as to the impact of microporous layers or catalyst-layer functioning. Moreover, the uncompressed GDL undergoes a significantly different mechanism of water transport than that of the compressed GDL. Furthermore, the predictions show that the wettability variation is one of the key factors of the saturation characteristics.
Export citation and abstract BibTeX RIS

This is an open access article distributed under the terms of the Creative Commons Attribution 4.0 License (CC BY, http://creativecommons.org/licenses/by/4.0/), which permits unrestricted reuse of the work in any medium, provided the original work is properly cited.
Improvement of the transport of liquid-water in polymer-electrolyte fuel cells (PEFCs) is essential for their wide-spread commercialization;1–3 it is a critical subject that has been greatly studied due to its importance in PEFC performance at high current densities.4–7 To achieve maximum removal of liquid-water, it is important to optimize the gas-diffusion layers (GDLs). GDLs for PEFCs are porous layers between the catalyst layer and the gas flow field that allow for the transport of product water and heat from the catalyst layer as well as the transport of reactant gases to the catalyst layer. They are composed of carbon-fiber-based cloths and paper. The hydrophobic characteristics of the GDL can accelerate the removal of liquid-water during PEFC operation.8 In general, the GDL carbon fiber's wettability depends on a degree of graphitization during pyrolysis process.9 To create hydrophobicity, GDLs are usually treated with a 5–20 wt% loading of a non-wetting polymer such as polytetrafluoroethylene (PTFE). However, the non-uniformities in the coating and drying process causes the overall structure to have mixed wettability.10,11 Further compounding their optimization, the internal wettability of these materials is hard to measure.
Several studies have experimentally investigated liquid-water transport inside the GDLs.12–17 These included the measurements of local liquid-water saturation and liquid-water distribution in the GDL under different operating conditions using an in-situ experimental setup and X-ray computed tomography (CT), where 3-D images visualized the liquid-water distribution in the GDLs. This technique has become an important tool in characterizing morphology and studying transport properties within the GDL pores. For example, Zenyuk et al.14 used microscale X-ray CT to investigate GDL geometry and provide a detailed analysis of the effect of land and channel area on the spatial liquid-water distribution under different levels of compression. Shum et al.16 used synchrotron-based micro X-ray CT to visualize and quantify the water distribution within a GDL subject to a thermal gradient. They plotted liquid-water saturation as a function of through-plane distance to quantitatively show the water redistribution. Eller et al.17 investigated the liquid-water saturation and liquid permeability within a GDL, which was treated with a microporous layer (MPL), under different cell operating conditions. They also used X-ray CT to understand the structural properties of GDLs and depict the transport of liquid-water under defined conditions. Shearing et al.18–21 characterized 3-D microstructural evolution processes of electrodes associated with heating and operation in-situ by using the nano X-ray CT. They concluded that the detailed microstructure derived from this technique can also be used as the geometry for an electrochemical or a numerical simulation. The X-ray CT capabilities are also being used in combination with CFD simulations related to transport in porous media.22–24 Although liquid-water transport within GDLs has been studied extensively with experiments, an expedient method for this investigation is still necessary to avoid the cost and time requirement associated with the complication of experimental methods. Due to the difficulty of the experimental investigation during the operation, the numerical modeling approaches become favorable. The results from modeling that rely on experimental data can also determine the correct parameter functionalities such as contact angle or capillary pressure.
Direct numerical simulation is a widely used technique that helps understanding water management problems inside the PEFCs and related technologies such as in the fields of petroleum and geology.25–27 The convective flow encountered in a PEFC is mainly pressure driven, thus it is typically described with Darcy's law.28 This is because in the porous system, conventional CFD with full Navier-Stokes equations are not computationally tractable due to the structure's complexity (only simple pore structures have been simulated29–52), thus a volume average approach is taken. Due to flow across complex geometries of GDLs, a traditional mesh-based approach to solving these problems is highly dependent on the quality of the mesh. This results in researchers spending much time working on the meshing operation rather than solving the problem. The Lattice Boltzmann Method (LBM) has become an important technique for tackling water-transport problems, especially for the parts of the PEFC that are difficult to observe directly, such as the GDL.53–55 LBM has many advantages over conventional CFD for modeling liquid-water transport within complex geometries. LBM is also widely used in other fields of research such as mixing and agitation, aerospace, marine, and energy.56–60 This method uses the lattice nodes and voxels of the geometry as the grid instead of the traditional meshed geometry (i.e. Cartesian mesh or finite volume), which can reduce pre-processing and computational times.56 LBM technique does not require the complex mesh generation process for computation.56,57 In a previous study,61 we used this computational technique to investigate liquid-water breakthrough dynamics and the motion of liquid-water across a GDL with varying wettability, where the model was validated by comparison to ex-situ breakthrough pressure data. The results revealed that breakthrough pressure and liquid-water evolution vary with the wettability of the GDL. The simulation accurately predicted experimental results, revealing that the LBM can be a useful numerical technique for understanding overall water transport in a porous system. There have been various computational works pertaining to liquid-water transport, utilizing LBM simulation,62–66 which can model the movement of liquid-water or water transport dynamics while predicting liquid-water saturation. However, their GDL geometries were not replicas of real samples and few works have clarified the mechanism of water transport through the GDL. Garcia-Salaberri et al.67,68 also used LBM with X-ray tomography to study the effective diffusivities of GDLs in dry and water-invaded conditions, which include the study of capillary pressure and saturation distribution. They also recommended that the quantitative and qualitative discrepancies between simulated and real liquid-water profiles observed in X-ray CT studies are quite substantial.
In this study, CFD with LBM is used to extend the model to study the geometrical land and channel effects on the liquid-water distribution in a GDL. In addition, both modeling and data used multiple injection locations so as to understand better the impact of microporous layers and in-plane liquid flow in GDLs, which are more representative of actual PEFC operation. The model is validated against the 3-D X-ray CT images, where the dry GDLs are also taken as input geometries for the computational model. As mentioned above, LBM is suitable for complex geometries, including microscopic simulations. The main objective of this study is to predict the liquid-water progression through a GDL at different injection pressures under locations. There are four cases of interest in this study as shown in Fig. 1. Case 1 is an uncompressed GDL with single injection hole under the channel as shown in Fig. 1a. Case 2 is similar, but with a compressed GDL, as shown in Fig. 1b to elucidate the impacts of compression. Figure 1c presents Case 3 of this work, which is a compressed GDL having two injection points under the channel. Case 4 is also a compressed GDL with two injection points, but where one is under the land and the other under the channel, as shown in Fig. 1d. A comparison and analysis of numerical predictions with in-situ experimental data is reported and discussed. The overall results of this study contribute to a fundamental understanding of water transport in GDLs using a combination of CFD-LBM modeling and experimental visualizations of GDL morphology and water distribution.
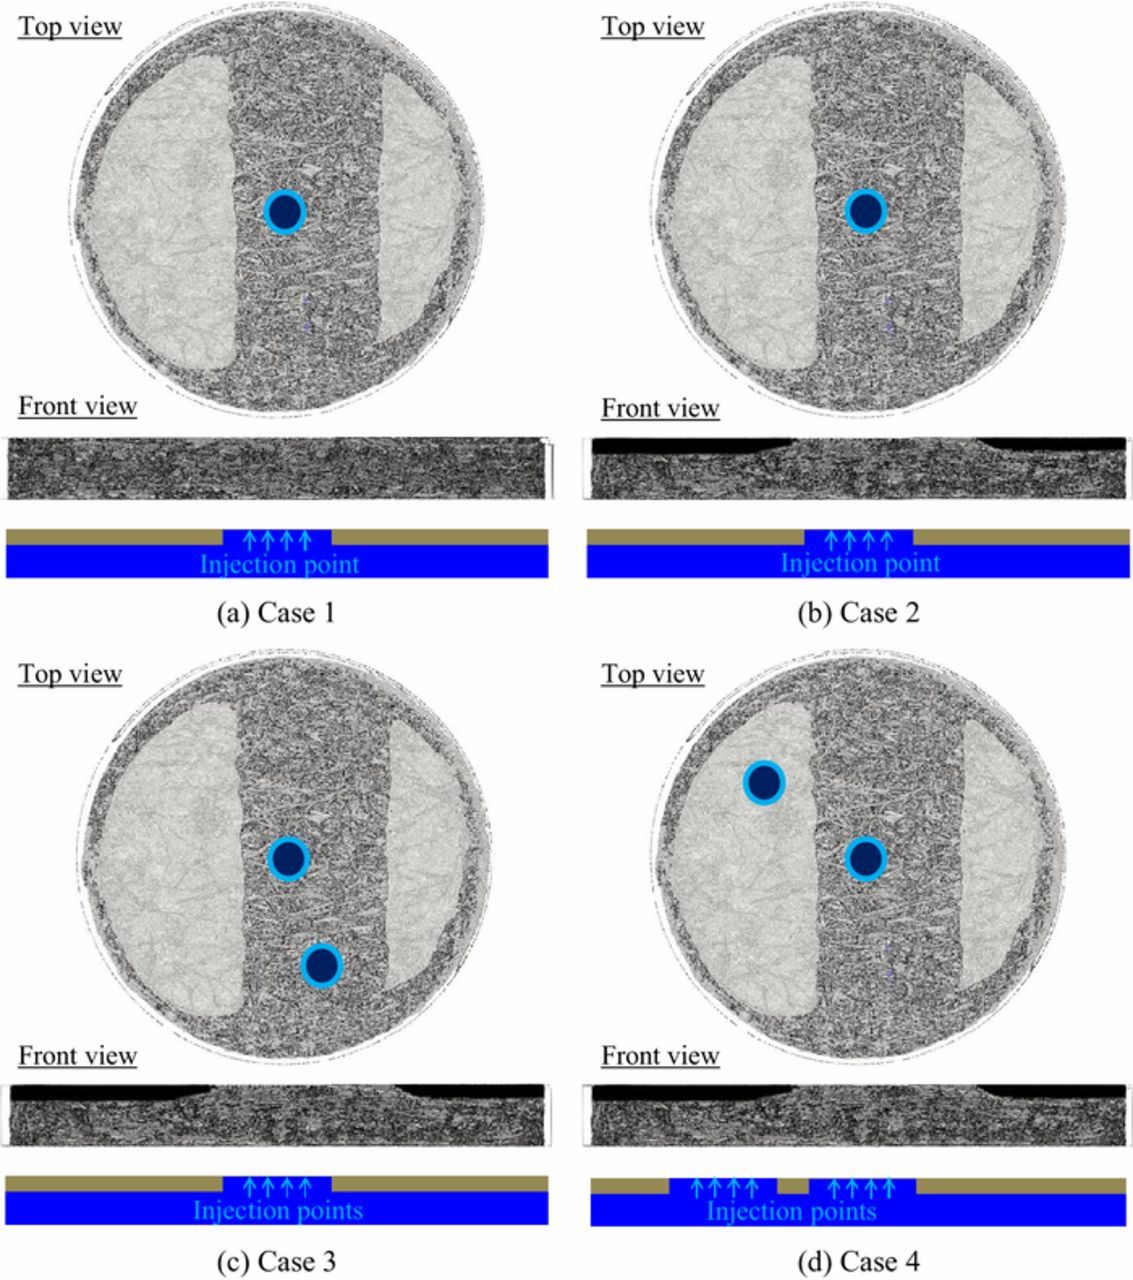
Figure 1. The four experimental and numerical procedures used in this study: (a) Case 1, Uncompressed GDL with single injection hole under channel, (b) Case 2, Compressed GDL with single injection hole under channel, (c) Case 3, Compressed GDL with two injection holes under channel, and (d) Case 4, Compressed GDL with first injection hole under channel, and second injection hole under land.
Model Development
Lattice boltzmann method (LBM)
The Lattice Boltzmann Method (LBM) is a CFD technique for engineering analysis. The LBM is used to solve several complex fluid flow problems including multiphase flow and free surface models with complex geometries such as that of a GDL. The particle-based approach can easily handle fluid domain meshing of surface complexity. This method uses the concept of streaming and collision of particles, which incorporates the physics of microscopic and mesoscopic processes such that the macroscopic, averaged properties obey the applicable macroscopic equations.69–74 The Boltzmann transport equation describes the statistical distribution of particles in the space, time, and velocity in the form of a particle distribution function. The LBM makes use of the statistical distribution function with real variables, conserving mass, momentum, and energy.71 More details concerning the LBM and transport equation for this method were discussed in previous publications.58–60
Computational model
3-D, time-dependent simulations of liquid-water saturation inside a GDL for PEFCs with a free surface model were run for a GDL sample, SGL10BA, which was injected with water in a variety of configurations. For the 3-D model used in this work, a commercial LBM solver, XFlow 2017x (Build 102.03),57 was chosen to perform the calculation. This solver uses 3 spatial dimensions and 27 discrete velocities (i.e. D3Q27). The lattice element size was 1 μm, giving a total number of 17,117,826 to 23,403,898 elements, depending on the size and resolution of the computed geometry. The time step was set to 0.1 μs. The liquid-water was injected under the sample at the same locations and pressures as in the experiments (i.e. beginning at 500 Pa and increasing by 500 Pa until breakthrough pressure is reached). The surface tension of liquid-water was set to 0.072 N/m, which corresponds to the surface tension of water in contact with air at 25°C. Surface tension is also responsible for the contact angle (θ) where a surface meets a GDL surface. This is determined by the interactions across the fluid-fluid and fluid-solid interface. The GDL contact angle in the simulation was assumed to be constant and uniform at 130°. The maximum computational time was 12 hours using 20 cores in a single node of an Intel Xeon 2.8 GHz with 256 GB RAM.
Experimental
Micro X-ray computed tomography (CT)
The experimental data was collected using the Advanced Light Source (ALS) Beamline 8.3.2 at Lawrence Berkeley National Laboratory (LBNL) in Berkeley, CA, USA. X-ray scans were performed at 14 keV with 1,025 projections and an exposure time of 500 ms. The beamline configuration included a 0.5 mm LuAG scintillator, 5x lenses, and a sCMOS PCO. Edge camera. This resulted in a square field of view of 3.3 mm with a resolution of 1.33 μm. The experimental setup was a custom apparatus as described in Ref. 14 and depicted in Fig. 2. At the bottom was an aluminum stage with a hollow column and holes at the top so that water could be injected into the sample. Furthermore, a hydrophobic membrane was placed on the top of the aluminum stage with a one or two holes at different locations to simulate single and double injection sites. The capillary pressure in the sample was controlled via the height of the water column. The samples were circular pieces of SGL10BA (SGL CARBON GmbH − Fuel Cell Components, Meitingen, Germany); each with a diameter of 3.2 mm and a thickness of 400 μm. The sample was placed over the holes at the top of the stage. To emulate the land/channel effects of an actual PEFC, a stamp with a 1 mm groove was placed on top of the sample. A Kapton cap was then used to cover and maintain the alignment of the top of the stage, the sample, and the stamp. For each sample, a reference scan of the dry state, followed by scans of the sample at various capillary pressures, was acquired.
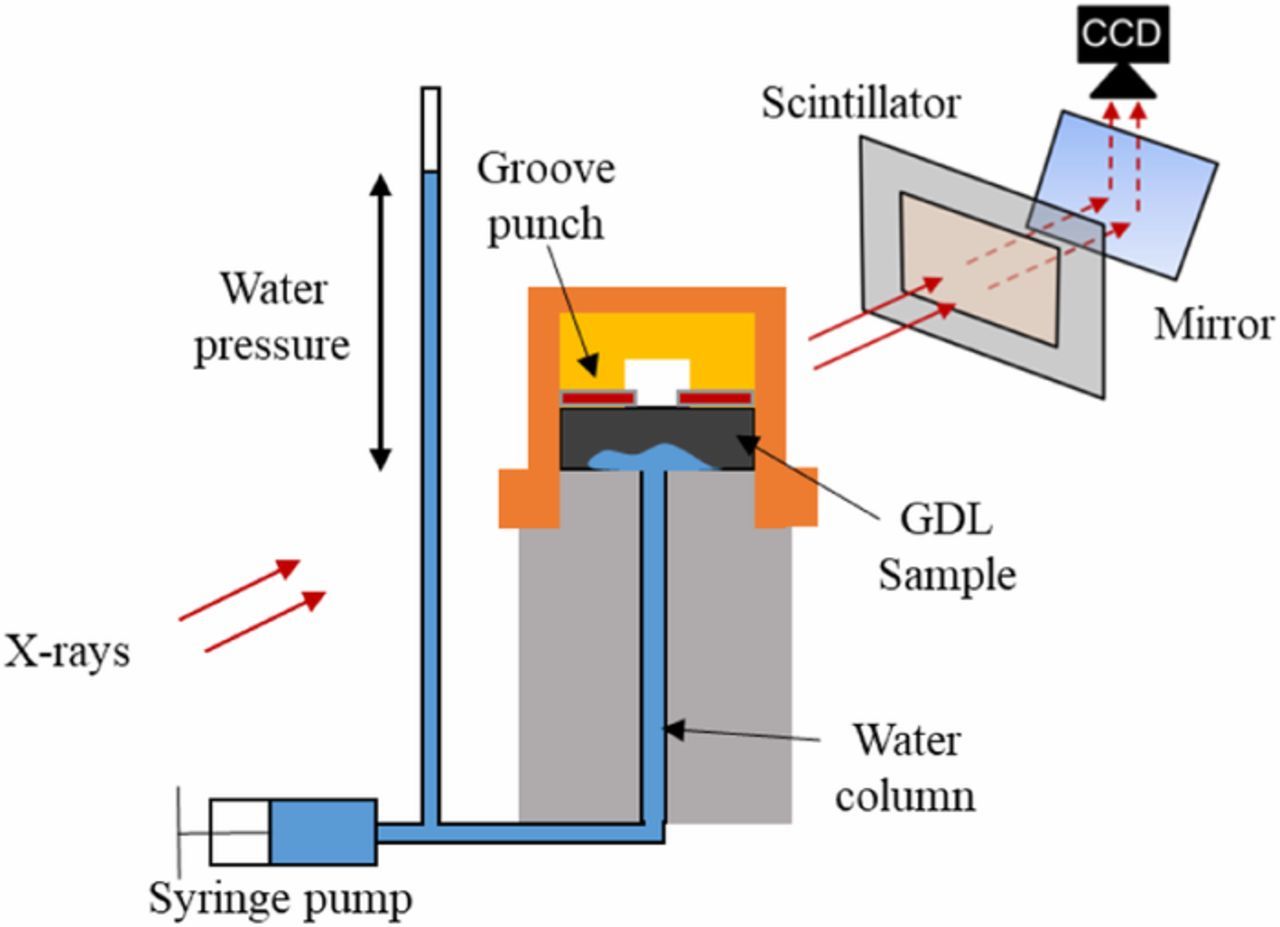
Figure 2. Experimental apparatus used to evaluate liquid-water saturation and capture experimental data.
Image processing
Pre- and post-processing of data was done using Fiji75 while the reconstruction step was conducted using Octopus 8.5.76 In post-processing, all image stacks were first converted from 32-bit grayscale to 8-bit grayscale and then thresholded using the Otsu algorithm (thus isolating the pore phase). For each sample, the dry stack was then subtracted from each of the wet stacks (thus isolating the solid and water phases). To remove noise (primarily the remaining solid phase) from the water phase stacks, Fiji's 2D binary operation "Open" was used with 12 iterations and a neighbor count of 4. A single Open iteration consists of a single iteration of the erosion operation followed by a single iteration of the dilation operation. The "Isosurface" operation from the BoneJ77 plugin was used to generate STL files from the solid and water phase stacks. A value of 4 was used for resampling for the isosurface.
Liquid-water saturation measurement
The liquid-water saturation was measured in a GDL domain, as shown in Fig. 3. The GDL images and liquid-water saturation were obtained from micro X-ray CT. GDL sample SGL10BA (carbon paper material) was used with a diameter of 3.20 mm, an average thickness of 400 μm, a reported uncompressed porosity of 0.88, and a PTFE loading of 5%.14 For the compressed GDL, the average thickness in this study was 290 μm with a compression pressure of 1.25 MPa at 27.5% compression (interpolated).14 In this experimental setup, the GDL was sandwiched between two aluminum plates. A grooved 1 mm punch was used to mimic the PEFC land/channel geometry. Water was injected into the GDL through the bottom plate via uniformly drilled holes of 0.25 mm diameter. The water injection pressure was controlled by a syringe pump and water column. After initial testing of a wide range of injection pressures, the water injection pressure for the GDL liquid-water saturation studies was varied from 500 Pa to the breakthrough pressure.
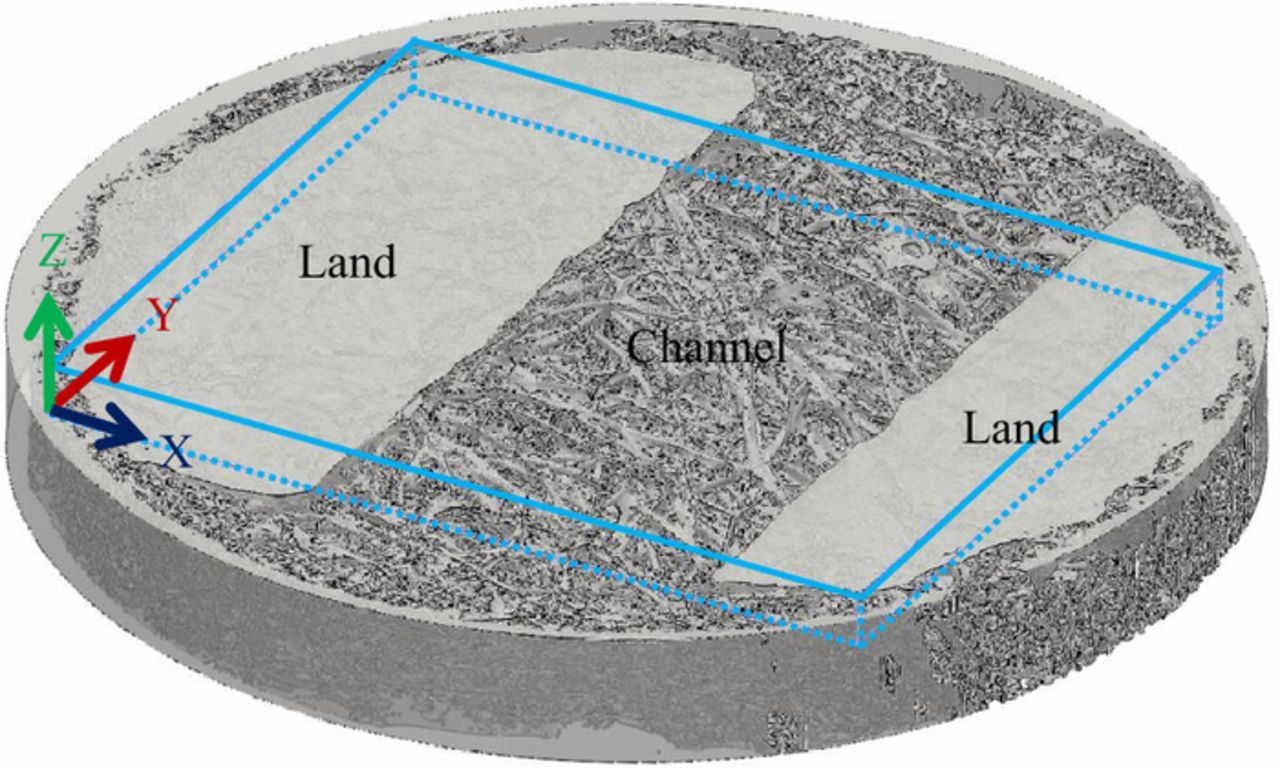
Figure 3. The micro-structure of GDL sample SGL 10 BA from micro X-ray Computed Tomography with the rectangular fluid domain and the coordinate axis x, y, and z.
To calculate the liquid-water saturation profiles, the GDL domain was created in a rectangular shape with the size of 2,400 × 2,400 μm, and the thickness was varied by the samples. The axis origin was located at the bottom left corner, as shown in Fig. 3. A MATLAB program was used to obtain the liquid-water saturation profiles for these experiments, which were calculated from the steady-state average intraporous liquid volume fractions within each plane (x-z plane) for 1,000 planes along the y-direction and subsequently plotted along the x-dimension. For CFD simulations, XFlow 2017X determined the liquid-water saturation in each plane, the profiles of which were plotted as done with the experimental data.
Results and Discussion
Water progression through uncompressed GDL (Case 1)
Figure 4 compares CFD predictions with experimental results of liquid-water saturation, defined as the total volume of liquid-water divided by total volume of pores, in an uncompressed GDL with a single injection hole in the bottom center (Case 1). In this study, the injection pressure was varied at 1,000, 1,500, 1,750, and 2,000 Pa., and the GDL contact angle in the simulation was fixed at 130°. The results show that the height of the liquid phase increases with pressure and the liquid-water fills the larger pores under the channel domain. The breakthrough pressure for this sample is around 2,000 Pa, and it is shown to have a porosity of 0.75. Figure 4a shows the lateral spread of liquid-water at the interface between the GDL and injection plate due to the wide interfacial gap, a result of the lack of compression. The amount of liquid-water under the channel is higher than under the land domain. This is because the injection is located under the channel, which causes the water to easily move through the pores under the channel rather than under the lands. Thus, the pressure under the channel is lower. Such an arrangement could be representative of a poorly compressed PEFC or perhaps one with a very hydrophilic catalyst layer or a gap due to material degradation or under high current where the channel region is more active. The experimental liquid-water saturation profiles recorded at different inlet pressures are given in Fig. 4c. This graph shows liquid-water saturation versus the length of the GDL sample in the x-direction for pressures from 1,000 to 2,000 Pa. Again, these liquid saturation profiles at steady state were determined by calculating the average volume fraction of liquid in the in-plane (x-z planes) along the through-plane of y-direction and plotting the averages along x. Note that the porosity profile of the GDL sample was calculated before water was injected. According to the graph, the saturation reaches a maximum of about 25% at the middle left of the channel domain and 10% in the land domain. The plot also shows that the liquid-water saturation is a function of pressure as higher liquid-water saturation levels are observed for higher injection pressures.
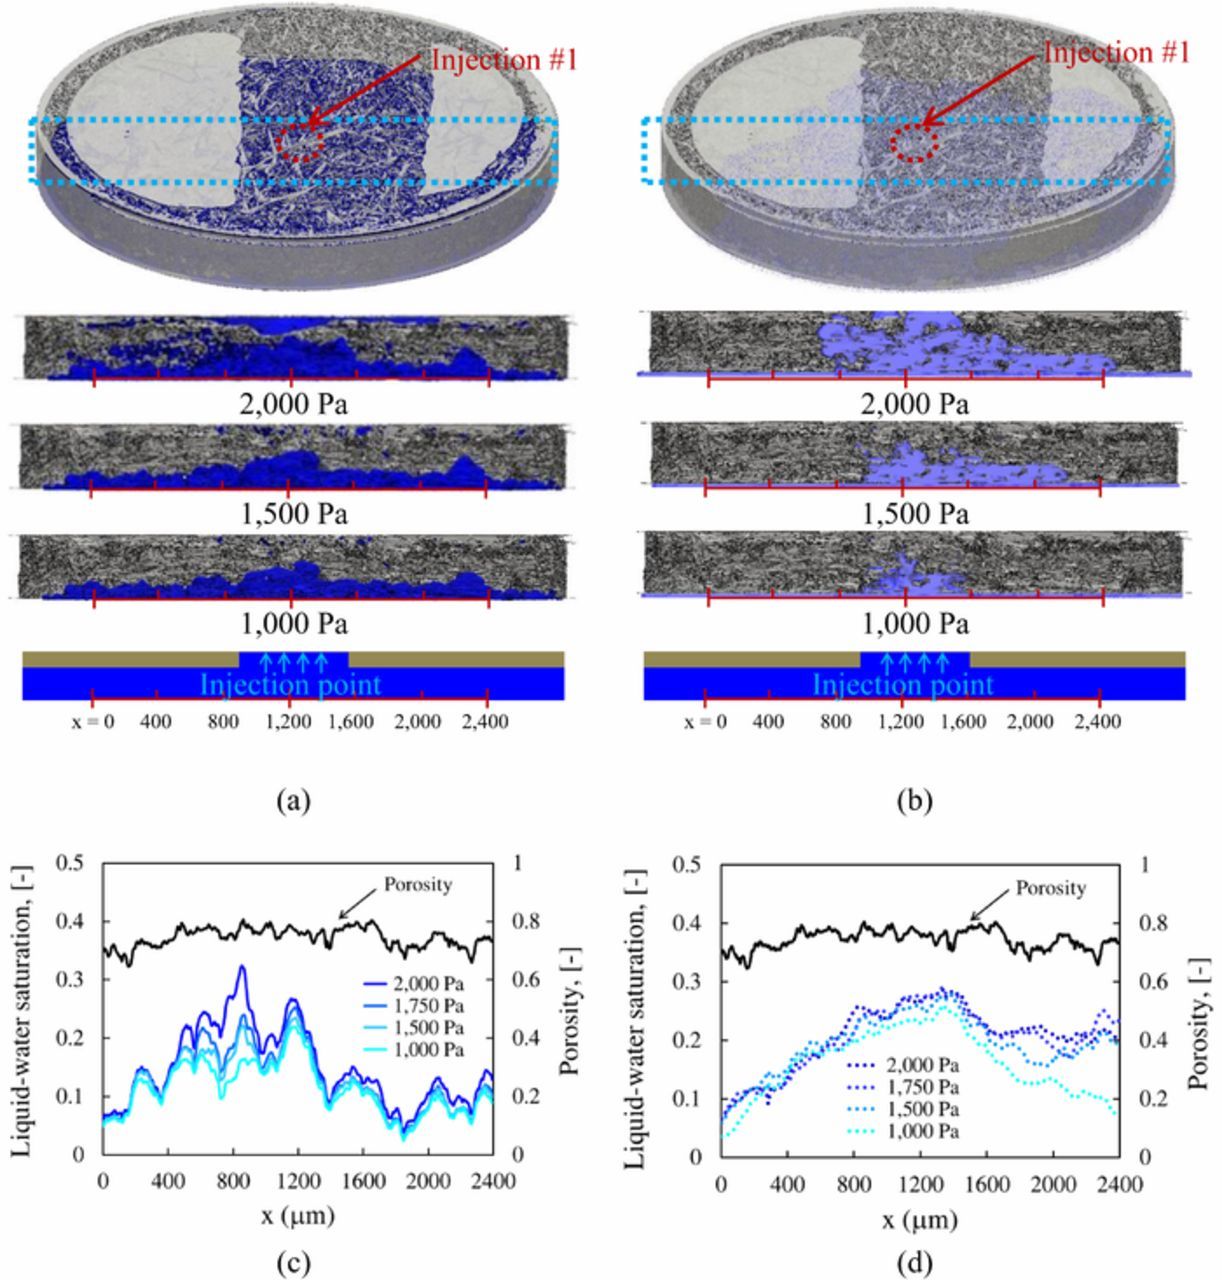
Figure 4. Experimental and simulated liquid-water saturation inside the uncompressed GDL with single injection hole in bottom center under channel (a) Cross sectional volume of liquid phase of experimental with the pressure of 1,000, 1,500, and 2,000 Pa, (b) Cross sectional volume of liquid phase of CFD simulation with the pressure of 1,000, 1,500, and 2,000 Pa, (c) Experimental liquid-water saturation profiles, and (d) Simulated liquid-water saturation profiles.
In the CFD simulation, the gap between the GDL and injection plate was set at 3 μm to mimic experimental conditions. Figure 4b presents the simulated cross-sectional liquid-water progression through the GDL. When liquid-water is first injected, it spreads across the interfacial gap before advancing toward larger pores within the GDL. The shape of liquid-water differs from that of the experiment, and liquid-water growth remains highest beneath the channel domain. Although there is space under the sample, the volume of liquid-water in this area is still less than that observed because the roughness of the GDL interface creates non-uniformity in the interfacial gap size. Figure 4d shows the prediction of liquid-water saturation along the length of the GDL sample. The predictions confirm that most liquid-water occupies the pores under the channel. The maximum saturation is about 30% at the middle of channel domain, which exceeds the experimental value. However, the gap beneath the uncompressed GDL affects the CFD model validation. The gap size is unknown and affects the amount of liquid-water under the uncompressed GDL before progression through the GDL begins. Therefore, the GDL should be compressed just enough to eliminate the interfacial gap and prevent the accumulation of excess liquid-water under the sample.
Water progression through compressed GDL, single injection hole under channel (Case 2)
To explore a more representative PEFC case, 27.5% compression is applied to the sample. After compression, the porosity of the sample is reduced from 0.75 to 0.70. Figure 5 compares experiments and CFD simulations of water saturation in the compressed GDL with a single injection hole in the bottom center (under the channel) at injection pressures of 500, 1,000, 2,000, 2,500, and 3,000 Pa. The observations from X-ray CT show that the manner of liquid-water progression in this case is similar to that of Case 1. The results also reveal the absence of excess liquid-water inside the gap area, as shown in Figs. 5a and 5b. There is significant liquid-water saturation under the channel area due to the higher GDL porosity under the channel and the position of the injection. It can be clearly seen that compression leads to a decrease of the liquid-water saturation in the entire GDL gap between the GDL and injection plate. This is due not only to a decrease in the gap itself but also to a decrease in pore-size (see Fig. S1). This decrease in pore size increases the lateral transport resistance. Furthermore, there is good agreement between the CFD simulations and experiments. The experimental data reported by Garcia-Salaberri et al.67 are inconsistent with this study, Case 2. For example, the larger liquid-water saturation profiles in those experiments, which is caused by the open channel at the top of sample holder and larger injector diameter (diameter of 1.50 mm vs. 0.25 mm). Even though the experiments conducted here were close to their experiments, our experimental design can study the effect of geometrical lands/channel and the effect of multiple injection points. Note that they used the different GDL sample (Toray TGP-H-120), which also indicates some of different behavior between our work and their work. From Figs. 5a and 5b, the liquid-water saturation profiles in the GDL along the length (x-direction) can be observed to quantify and validate the liquid-water saturation distributions.
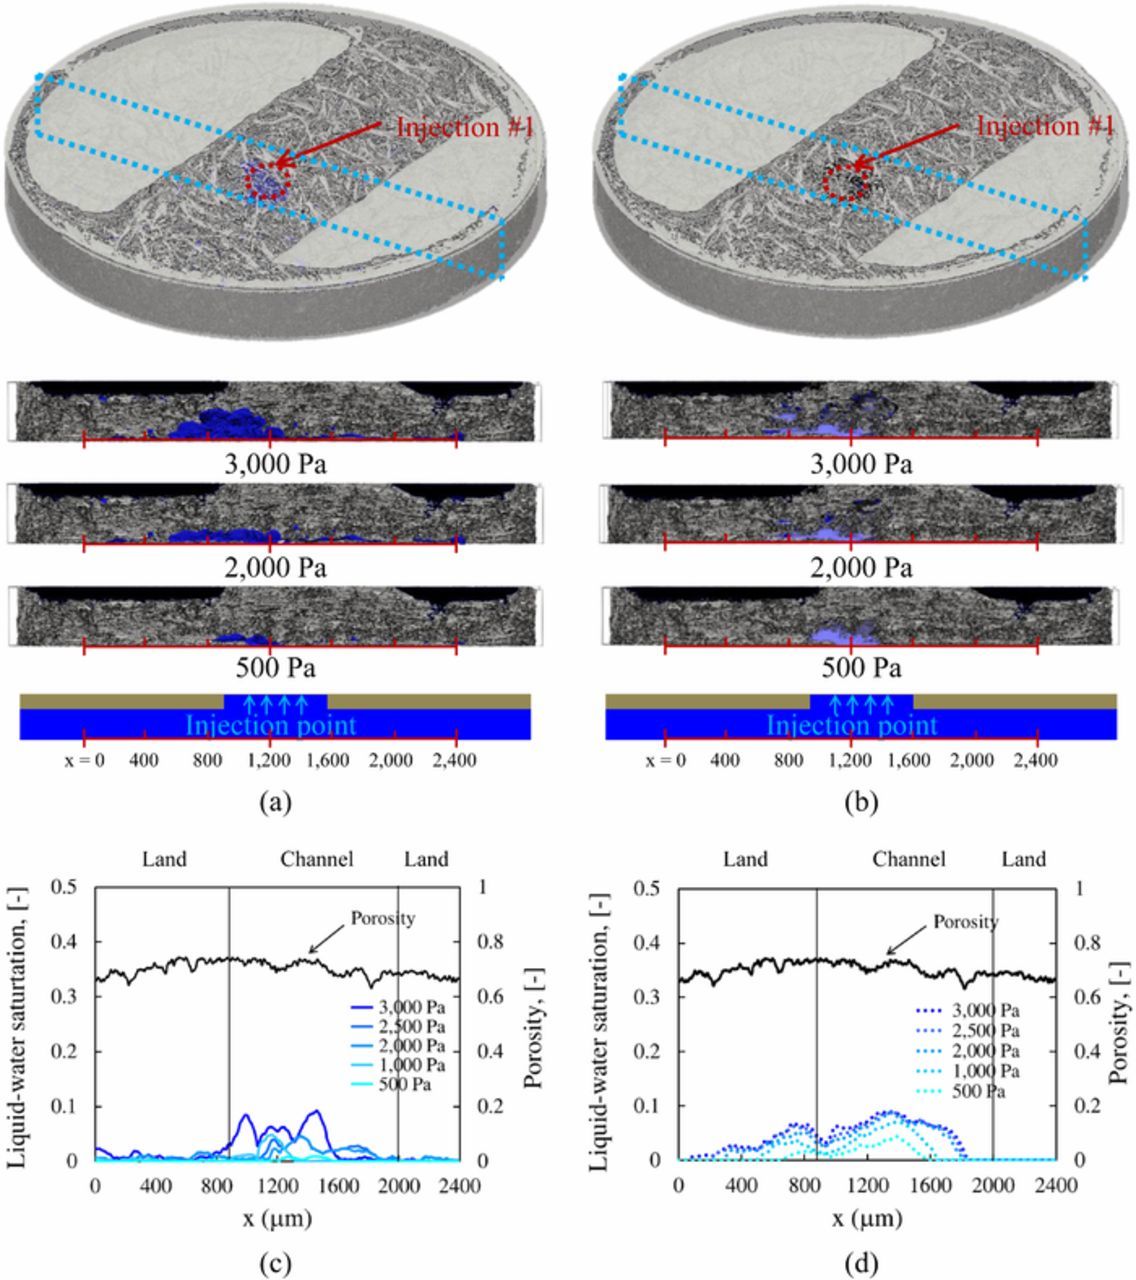
Figure 5. Experimental and simulated liquid-water saturation inside the compressed GDL with single injection hole in bottom center under channel (a) Cross sectional volume of liquid phase of experimental with the pressure of 500, 2,000, and 3,000 Pa, (b) Cross sectional volume of liquid phase of CFD simulation with the pressure of 500, 2,000, and 3,000 Pa, (c) Experimental liquid-water saturation profiles, and (d) Simulated liquid-water saturation profiles.
Figures 5c and 5d present the comparison of experiments and CFD simulations of liquid-water saturation profiles under the compressed GDL with a single injection hole (Case 2). The liquid-water saturation profiles confirm the higher accumulation of liquid-water under the channel than under the lands. The experimental saturation profiles show that the total volume fraction of liquid-water reaches a maximum of about 10% under the channel domain and less than 2% under the land domain, as shown in Fig. 5c. The model predictions of water evolution show the similarity of the shape of liquid-water as experiment, especially when the pressure is below 1,000 Pa, as shown in Fig. 5. For this case, the compressed GDL structure diminishes the liquid-saturation profiles and increases the breakthrough pressure because it is more difficult for liquid-water to move through the restricted pores. With this approach, the breakthrough pressure has been increased from 2,000 to 3,000 Pa. Although the breakthrough pressure is increased, the narrowing of the dominant water pathways and lower overall saturation should result in better PEFC performance, which was demonstrated recently in similar findings of GDLs with porosity variations.78 Furthermore, the liquid-water saturation far from the injection almost vanishes as the GDL becomes less porous (because there is no longer an interfacial gap) and lateral transport resistance increases (because of decreasing pore-size (see Fig. S1)). So, the compressed sample is better than the uncompressed where the water is a layer and takes the transport pathways under the channel.
Water progression through compressed GDL with two injection holes (Cases 3 and 4)
To explore the lateral movement of water in the GDL and the influence of multiple injection sites, which may occur as one goes from a GDL to a GDL with a microporous layer perhaps, the next studies utilized two injection holes with one under the channel and the other either under the channel (Case 3) or under the land (Case 4). For Case 3, the liquid-saturation profiles are shown in Figs. 6c and 6d. The experimental data and computational prediction both reveal the similarity of the shape and location of the liquid-water saturation. When the injections start to feed the liquid-water, the liquid-water begins to flow up from the two injections and percolates vertically above injection locations until breakthrough (3,000 Pa) is reached, as shown in Figs. 6a and 6b. Interestingly, they do not strongly influence each other at this distance of 800 μm. This then demonstrates that even though the GDL is anisotropic with higher in-plane permeability, the dominant flow pathway is still straight through. Such a finding agrees with previous analysis of the impact of multiple versus single injection, albeit in ex-situ setup without visualization capabilities, where the multiple sites were hypothesized to mainly interact at the injection side and not within the GDL.79
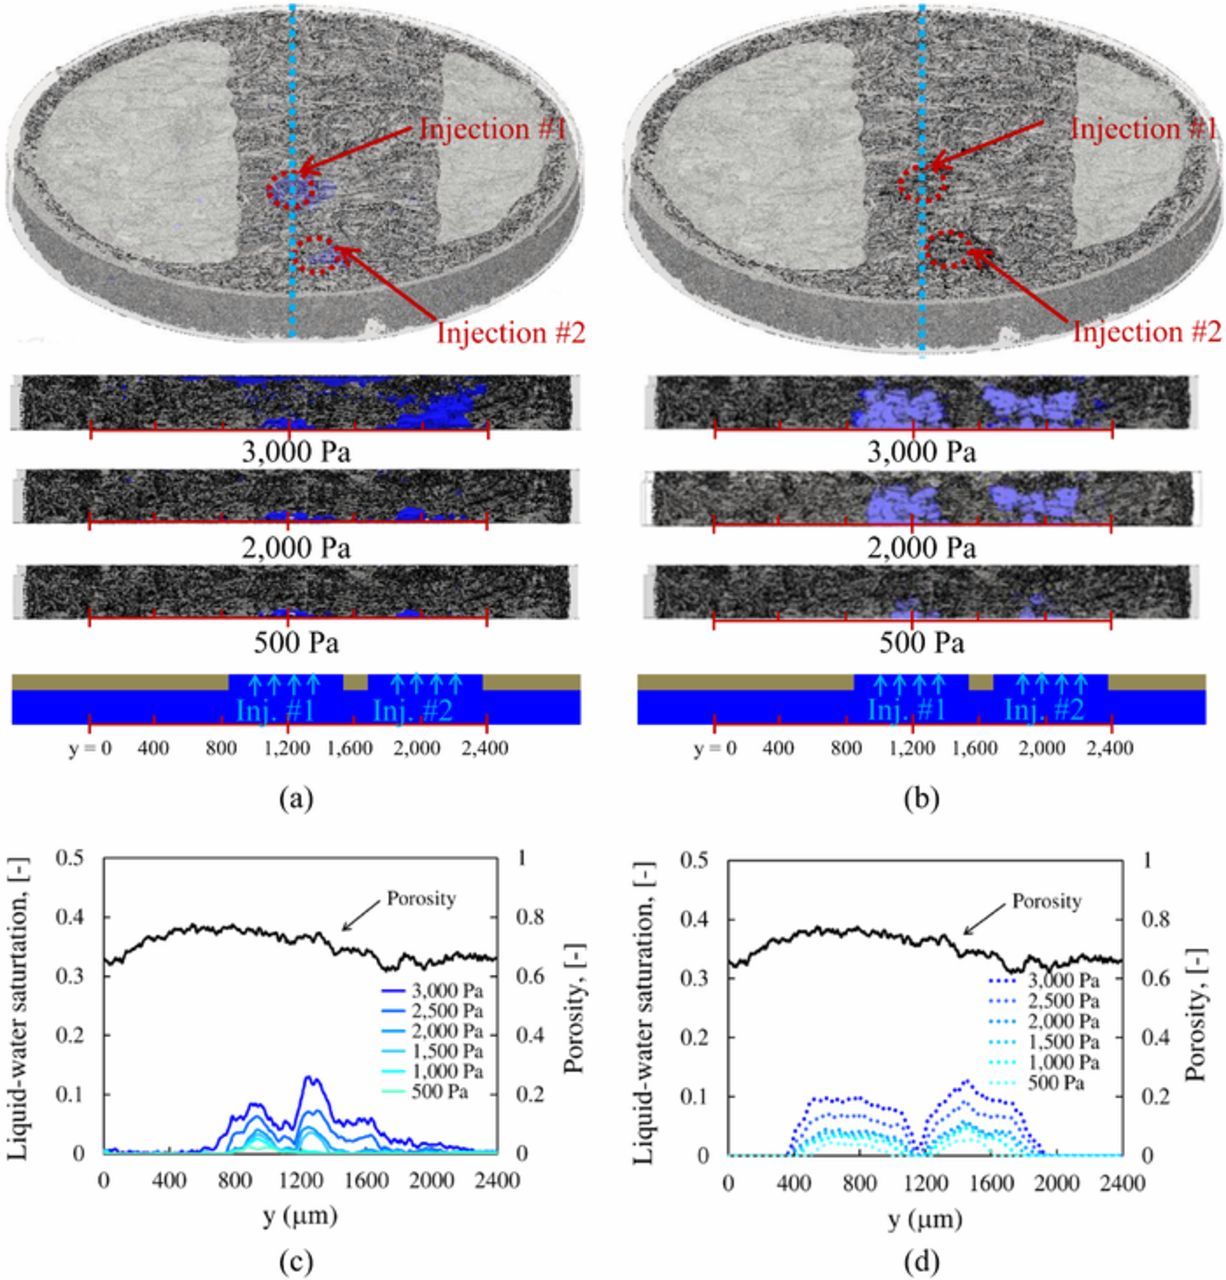
Figure 6. Experimental and simulated liquid-water saturation inside the compressed GDL with two injection holes in bottom under channel (a) Cross sectional volume of liquid phase of experimental with the pressure of 500, 2,000, and 3,000 Pa, (b) Cross sectional volume of liquid phase of CFD simulation with the pressure of 500, 2,000, and 3,000 Pa, (c) Experimental liquid-water saturation profiles, and (d) Simulated liquid-water saturation profiles.
Figures 6c and 6d compare experiments and CFD simulations of liquid-water saturation at steady state for varied pressures at 500, 1,000, 1,500, 2,000, 2,500, 3,000 Pa. The overall prediction of liquid-water saturation profiles is similar to the experimental data. However, the amount of liquid-water saturation from predictions are higher than the experimental data at x-coordinates from 400 to 800 μm. According to the porosity profile, the porosity in this area is higher and simulations suggest that water can percolate easily in this region. Furthermore, the results show the relationship between liquid-water saturation and porosity of the dry sample. When the porosity is decreased in the areas through which water flows, it is more difficult to push the water through, as higher pressure is required. Thus, with the same pressure, higher porosity results in more liquid-water saturation. For example, in this case, the liquid-water saturation profiles show slightly reduced progression at x-coordinates beyond 1,800 μm due to the lower porosity (porosity reduced to 0.6), which results in difficulty percolating liquid-water.
Similar to Case 3, Case 4 explores two injection sites but where one is under the land. Again this could be indicative of a GDL with a microporous layer that provides selective injection sites. Note that the diameter of the second injection is half that of the first injection. The GDL was compressed to a thickness of 290 μm. Figures 7a and 7b present the comparison between experimental data and CFD simulations at pressures of 500, 2,000, and 4,000 Pa. The cross-section that represents the planes is used to measure the liquid-water saturation profiles from experiments and CFD simulations. The visual observation reveals that the liquid-water emerges under the land area first and does not fully progress through the GDL. This is because the porosity of the GDL under the land area is reduced due to compression and it is possible that there is a small tendril that goes to the top of the land and then feeds back to the channel. It also has the effect of capillary action in the narrow spaces of channel and the size of the injection holes. Upon increasing pressure, the liquid-water fills pores under the channel area until breakthrough occurs (about 4,000 Pa).
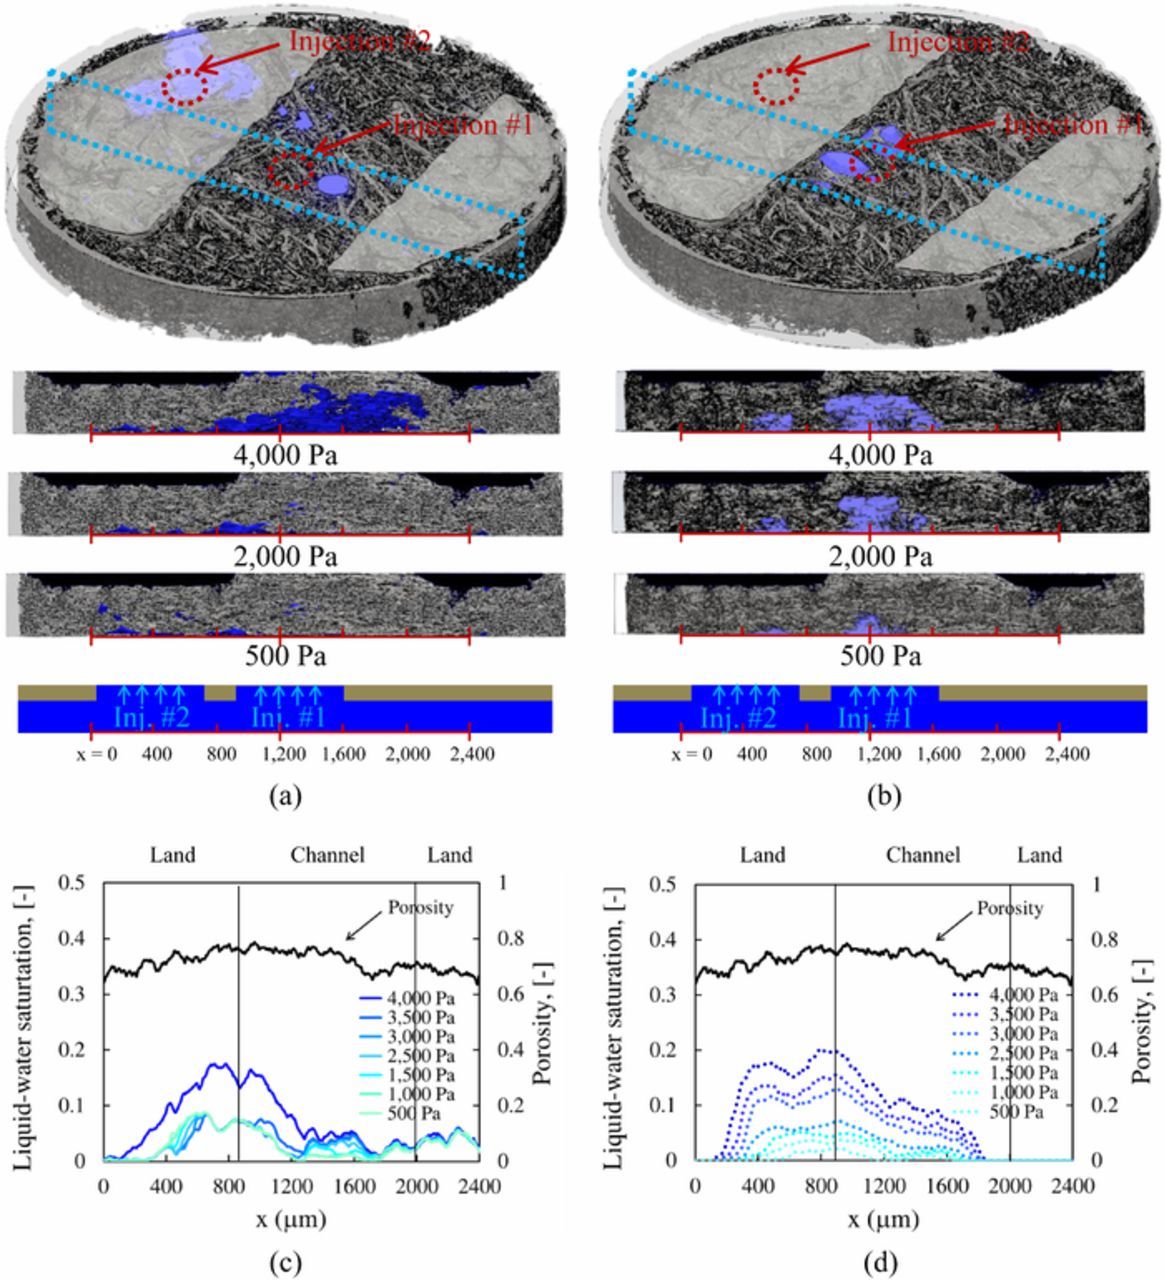
Figure 7. Experimental and simulated liquid-water saturation inside the compressed GDL with one injection point under channel, and second injection point under land (a) Cross sectional volume of liquid phase of experimental with the pressure of 500, 2,000, and 4,000 Pa, (b) Cross sectional volume of liquid phase of CFD simulation with the pressure of 500, 2,000, and 4,000 Pa, (c) Experimental liquid-water saturation profiles, and (d) Simulated liquid-water saturation profiles.
Figures 7c and 7d present the comparison of experiments and CFD simulations of liquid-water saturation profiles with pressures varied from 500 to 4,000 Pa. The experimental and simulated saturation profiles are comparable at all pressures. The saturated region becomes wider in the area between the channel and land domains at x-coordinates from 300 to 1,800 μm, thereby filling more of the pore space. A significant liquid-water saturation can be found at pressures greater than 3,500 Pa. A large amount of water accumulates in the high-porosity area between land and channel from 400 to 1,200 μm in the x-direction; the liquid-water saturation reaches about 20% in this area. Usually, in this area, the liquid-water flows easily. For pressures less than 3,500 Pa, the liquid-water saturation reaches about 10% in the channel domain and 5% under the lands. The results also reveal a liquid connection through the entire length of the sample, allowing for water transport between two injectors. This differs from the previous case (Case 3) in which they do not influence each other reciprocally. The liquid-water transport between the injection holes is influenced by intermolecular forces and the hydrophilicity of surrounding GDL surfaces. This is because of the high porosity in this area and the location of one of the injectors in the land domain. Again, the water can move easily across the GDL via the higher-porosity pathways under the channel. So, when the liquid-water is flowing under the GDL at land-channel domain edges, liquid-water can percolate into the channel domain easily, which results in water transference between the two injection holes.
Error analysis
The error associated with the CFD simulation and experimental data was examined using statistics. The percent error indicates the degree of random fluctuations, which is reported in Table I. The percent error was calculated as the difference between two plots at each voxel in the computed domain, and take the average over all elements. The results from the CFD simulation have relatively low percent error of liquid water saturation at high pressure, especially at or beyond the breakthrough pressure, because deviations remain constant despite the increased magnitude of saturation. Furthermore, the error between experimental data and CFD simulations could also be due to the non-uniform wettability in the GDL sample, which led to the substantial difference of liquid water distribution and its saturation in some locations. Even though the error is higher at low pressure, the CFD simulation can provide a possible distribution pattern and transport pathway of the liquid water progression through the GDL sample.
Table I. Percentage error between CFD simulation and experimental data.
| Case 1 | Case 2 | Case 3 | Case 4 | ||||
|---|---|---|---|---|---|---|---|
| Pressure [Pa] | Error [%] | Pressure [Pa] | Error [%] | Pressure [Pa] | Error [%] | Pressure [Pa] | Error [%] |
| 1,000 | 29.67 | 1,000 | 36.20 | 1,000 | 38.01 | 1,000 | 36.98 |
| 1,500 | 36.51 | 2,000 | 26.30 | 1,500 | 34.75 | 1,500 | 33.22 |
| 1,750 | 36.08 | 2,500 | 27.58 | 2,000 | 23.56 | 2,000 | 29.54 |
| 2,000 | 26.99 | 3,000 | 3.04 | 2,500 | 22.42 | 2,500 | 20.06 |
| 3,000 | 8.48 | 3,000 | 21.91 | ||||
| 3,500 | 20.94 | ||||||
| 4,000 | 6.21 | ||||||
Quantitative analysis of the effect of porosity on liquid-water saturation
Figure 8 presents the quantile-quantile (Q-Q) plots of experimental data to confirm the correlation between porosity and liquid saturation. There are 1,800 randomized positions for each case which are used to analyze and report the quantitative data of pore space where liquid-water saturation is occupied. The overall profiles confirm that there is a strong relation between porosity and liquid saturation. At the same pressure of water injection, the liquid-water saturation is greater in the location where the porosity is higher. When the water pressure is increased, the overall water saturation also increases. For an uncompressed GDL (Case 1), the results indicate significant higher liquid-water saturation compared to other cases under compressed GDL (Cases 2 to 4). This is because more water can enter to the GDL through a wide interfacial gap as explained earlier. Cases 2 and 3 show the comparison of the profiles between one and two injection locations. Note that both cases have the injection hole located under the channel areas. The profiles of liquid-water saturation against porosity in Cases 2 and 3 look alike for all injected pressure, but the values of liquid-water saturation from Case 3 are higher than Case 2. This is because the amount of liquid water injected through the GDL is larger than single injection point from Case 2.
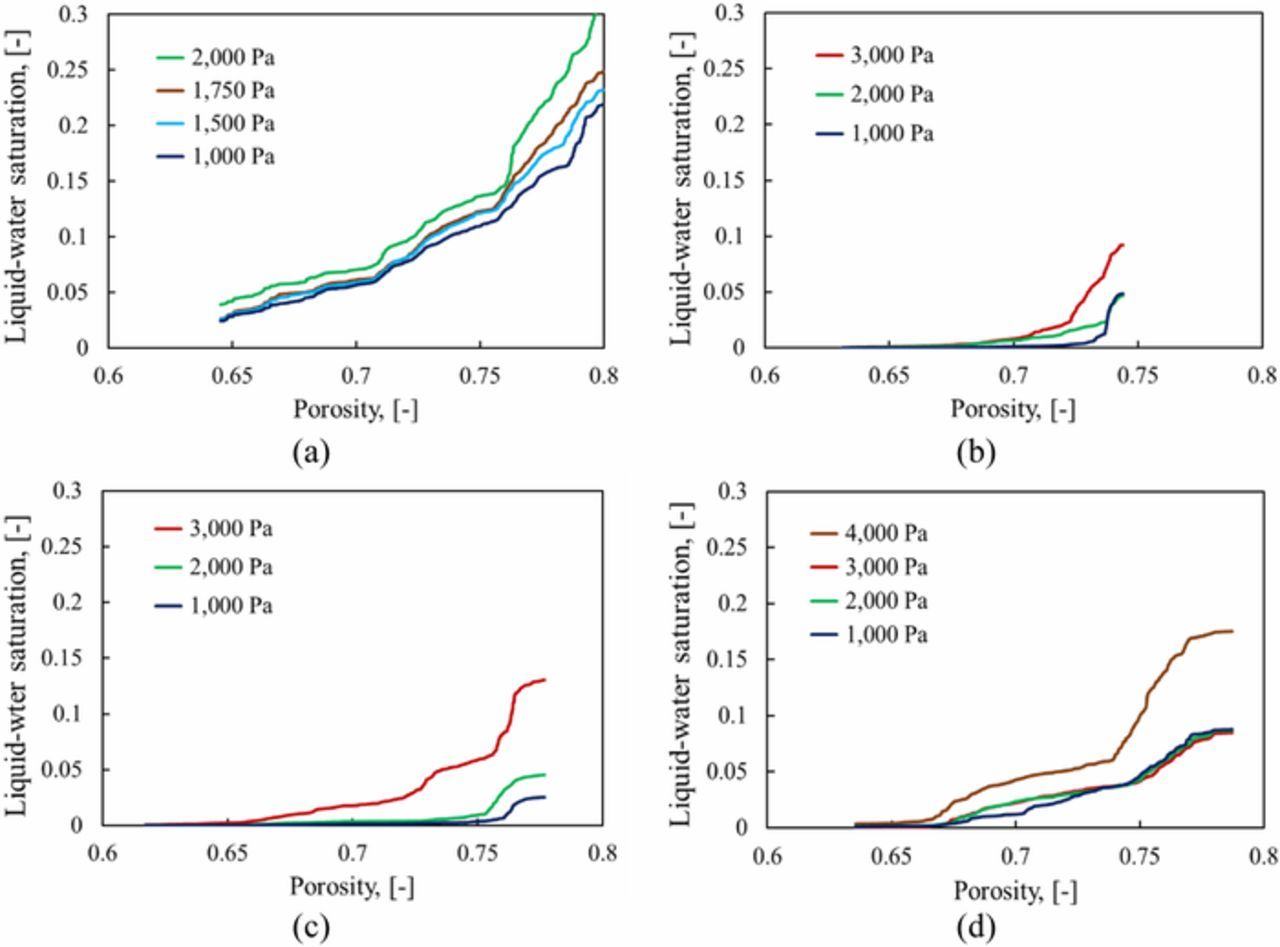
Figure 8. Quantile-quantile (Q-Q) plots of liquid water saturation with the porosity presented of (a) Case 1, (b) Case 2, (c) Case 3, and (d) Case 4.
Figure 8d displays the liquid-water saturation profiles against porosity at different injected pressure conditions for Case 4. In this case, there are two injection points, but one injector is located under the land area, as shown in Figure 1d. The liquid-water saturation profiles of this case are different than in Case 3 (two injectors under the channel). Having one injector located under the land area causes the liquid-water saturation increases in those locations where the porosity is lower (0.74 < ɛ < 0.67). These profiles do not appear in Case 3 (two injection holes under the channel area) until it reaches the breakthrough pressure of around 3,000 Pa. Keep in mind Case 4 has the highest water breakthrough pressure. This is due to the impact from the liquid water as it moves through the hole under the land. The GDL does not reach the break-through pressure because the land stops it, then the water fills the voids under and around channel injection hole until a breakthrough occurs.
The effect of wettability on liquid-water saturation
The wettability of carbon fibers can be controlled by degree of graphitization and surface treatments during the manufacturing process. Changes in the wettability of carbon fibers from the surface treatment can affect the liquid-water saturation and breakthrough pressure in the GDL.80–82 To explore this effect, the contact angle of carbon fibers was varied at 90°, 130°, and 150° with the model. The testing condition and GDL sample from Case 3 were used for this study. The liquid-water was fed from two injection holes at a pressure from 500 to 3,000 Pa. Figure 9a presents the overall liquid saturation profile against pressure at different contact angle. This figure explains how pressure could change the quantity of liquid water injected to the GDL and the wettability can control the amount of liquid water at the same pressure. The results reveal that at the same pressure, the amount of liquid saturation will increase with a decrease in the contact angle. When the pressure is increased at the same wettability, the liquid saturation increases. Figure 9b shows the local liquid saturation profile along the x-direction with constant total liquid saturation of around 0.035. The wettability has been varied and therefore the pressure of each contact angle will be different. The selected pressure for the contact angles of 90°, 130°, 150°, of the experiment are 1,500, 2,000, 2,500, and 2,500, respectively. The results show that the local liquid saturation profiles are not exactly the same (identical) at different wettability while the amount of liquid water inside the GDL is controlled. Moreover, the shape, also is not similar when it is compared with the profiles with the same pressure. As shown in Figure 9c, that is compared in the liquid saturation profile along x-direction at different wettability under the constant pressure. Figure 9c presents the effect of wettability at the same pressure under the breakthrough pressure (2,000 Pa), the result shows that the water percolates vertically above the injection locations and does not progress through the GDL because the pressure is insufficient for breakthrough to occur. At contact angle of 130°, both the experiment and CFD simulation illustrate the similarity of the shape and growth of the liquid phase, as shown in Figs. 6a and 6b, which is remarkable seeing as the measured contact angle also contains surface pinning and interactions. Thus, one might consider that such forces also dominate within the GDL as well. The changes in wettability on the surfaces of carbon fibers result in change of water behavior, varied shape, and growth of water. The high-hydrophobicity case (150° contact angle) presents less water saturation than the others (90° and 130°) as more energy is needed to push the water through the GDL. With the lower wettability of solid structure (90° contact angle), the liquid saturation is higher than the other cases because the liquid-water easily moves through and fills the structure.
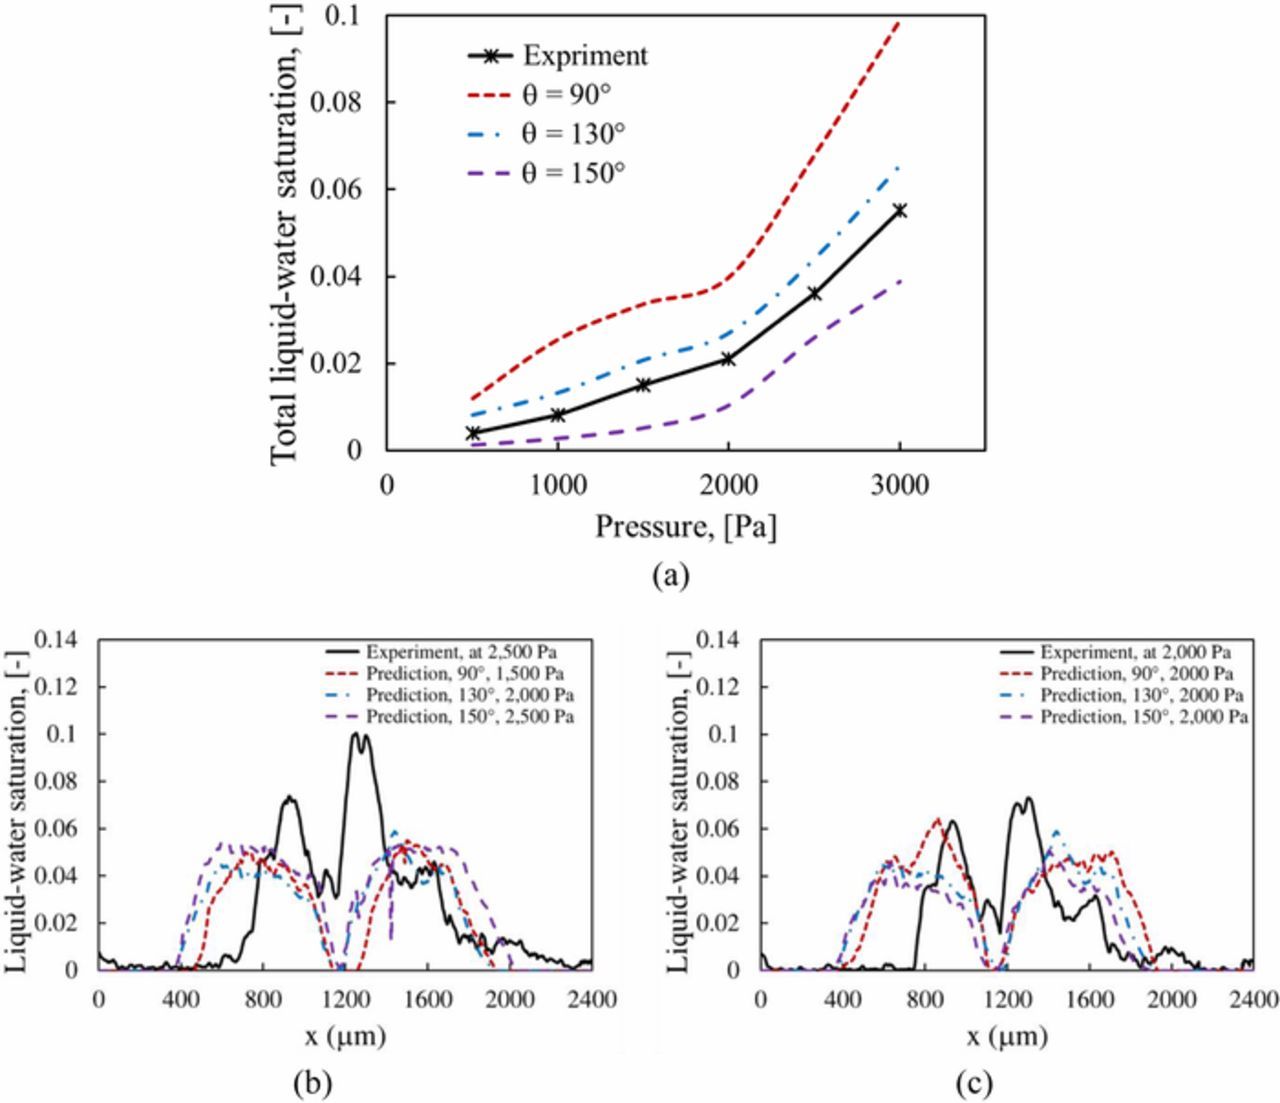
Figure 9. The effect of wettability on liquid-water saturation comparison between experimental data and CFD simulation for SGL 10BA, (a) under injection pressure from 500 to 3,000 Pa with different contact angle, (b) under the constant total liquid water saturation of 0.035 with different contact angle, and (c) under constant injection pressure of 2,000 Pa with different contact angle.
The benefit of this model is the change in the contact angle of GDL surface allows for the study of the effect of wettability alteration, which can help material designers work out the unsatisfactory features of the material and assist the on-going process before laboratory testing. The results also reveal that the contact angle is an important factor. For example, the increase in hydrophilicity causes the formation of a liquid film, leading to substantially less gas pathways and more lateral flow. With higher contact angles, the saturation seems to be more sensitive to the wettability since more pressure is required to push the liquid water through the GDL. In future work, we wish to verify whether CFD simulations can be confidently used to predict accurately the contact angle of the GDL if such information is unavailable. Moreover, the results from our CFD simulation can reflect to the PEFCs performance and design optimal of GDL structure.83
Conclusions
In this work, three-dimensional direct numerical simulation using the Lattice Boltzmann Method was used to explore liquid-water transport inside gas-diffusion layers used in polymer-electrolyte fuel cells. It was observed that efficient water progression across a GDL is dependent on sufficient compression in order to avoid flooding of the catalyst layer, but the land areas of the flow plate, which provide this compression, stifle transport and force lateral water movement. This presents a problem for the design of fuel cell flow plates that can be handled with CFD simulations. A model was validated by comparison to in-situ experimental data involving multiple injection points during X-ray tomography. The liquid-water saturation can be calculated from this visualization and it agreed well with the simulations. The motion of liquid-water saturation in the pore structure was predicted using the geometry taken by micro X-Ray CT. The local saturation of liquid-water inside the GDL samples varies with the change of injection locations, including under land and channel, because the pore space, shape, and size of porous materials used in PEFCs are variable and irregular for uncompressed and compressed samples. The results reveal the correlation between liquid-water saturation and porosity for the compressed sample, resulting in lateral transport pathways. The similarities between simulated water saturation profiles and experimental data strongly suggests that the LBM technique can be utilized in enhancing our fundamental understanding of the transport of liquid-water and air inside the gas diffusion layers used in PEFCs.
Acknowledgments
This project was supported by the Ford Motor Company. The authors acknowledge Dassault Systèmes Simulia S.L.U. for providing XFlow software. The Advanced Light Source is supported by the Director, Office of Science, Office of Basic Energy Sciences, of the U.S. Department of Energy under Contract No. DE-AC02-05CH11231. AZW and IVZ also acknowledge support from Fuel Cell Performance and Durability Consortium (FC-PAD), which is supported by the Fuel Cell Technologies Office, Office of Energy Efficiency and Renewable Energy, of the U.S. Department of Energy under Contract No. DE-AC02-05CH11231.
ORCID
P. Satjaritanun 0000-0001-6458-2845
I. V. Zenyuk 0000-0002-1612-0475
A. Z. Weber 0000-0002-7749-1624
S. Shimpalee 0000-0002-7418-9526