Abstract
Decades of Li-ion battery (LIB) research have identified mechanical and chemical culprits that limit operational lifetime of LIB electrodes. For example, severe capacity fade of unmodified LiXMn2O4 electrodes has been linked historically with Mn dissolution and, more recently, fracture of the electrochemically active particles. Mitigation approaches targeting both effects have prolonged cycle and calendar life, but the fundamental mechanistic sequences linking fracture to capacity fade in LiXMn2O4 and many other cathode materials remain ambiguous. Here, we investigate specifically the temporal correlations of fracture, capacity fade, and impedance growth to gain understanding of the interplay between these phenomena and the time scales over which they occur. By conducting controlled excursions into the cubic-tetragonal phase transformation regime of LiXMn2O4, we find that fracture contributes to impedance growth and capacity fade by two distinct mechanisms occurring over different time scales: (1) poorly conducting crack surfaces immediately hinder electronic conduction through the bulk of the electrode, and (2) capacity fades at a faster rate over multiple cycles, due plausibly to dissolution reactions occurring at newly formed electrode-electrolyte interfaces. The deconvolution of these effects in a well-studied cathode material such as LiXMn2O4 facilitates understanding of the complex relationship between mechanics and electrochemistry in LIB electrodes.
Export citation and abstract BibTeX RIS

This is an open access article distributed under the terms of the Creative Commons Attribution 4.0 License (CC BY, http://creativecommons.org/licenses/by/4.0/), which permits unrestricted reuse of the work in any medium, provided the original work is properly cited.
The need for long-lasting and portable energy storage in numerous applications has prompted extensive research in identifying and mitigating aging mechanisms in Li-ion batteries (LIBs).1,2 Among these mechanisms, fracture of active particles has been observed and correlated with capacity fade for many electrode compounds,3–8 including both cathode and anode systems. There are several reasonable scenarios by which fracture may contribute to performance loss. Active material fragments may separate electronically from the current collector or the electronically conductive matrix.5,9–11 Alternatively, exposure of fresh fracture surfaces may accelerate side reactions such as electrolyte oxidation,12,13 or internal cracks may block ionic diffusion at various length scales.8,14–16 Although these suggestions are satisfactory and probably identified correctly for many systems, most experimental studies do not control or monitor fracture during cycling, and thus do not address the time scales over which fracture affects impedance and capacity. As mechanical and chemical degradation both occur over the lifetime of a cell, such time-resolved information is critical to identify clearly the mechanistic links between fracture and performance. To characterize the mechanistic effect of fracture for a given electrode system fully, fracture must be induced in a controlled manner that allows for temporal decoupling from other sources of degradation.
The complex but well-studied aging behavior of the LiXMn2O4 (LMO, 0 < X < 2) spinel cathode material makes this compound a good choice for such controlled fracture experiments. Because LMO demonstrates good Li+ mobility,17 reasonable energy density,18 and low toxicity,19 decades of research have been devoted to understanding its phase behavior and addressing its poor capacity retention. In the 1990s, several aging mechanisms specific to LMO were discovered under a variety of cycling conditions. First, lithiation of cubic LMO into the 1 < X < 2 regime induces a collective Jahn-Teller distortion20–22 to a tetragonal spinel phase at 2.9 V with a discontinuous change in lattice parameter ratio c/a of ∼16%.21 This transformation normally causes fracture and capacity fade of the spinel particles, although formation of nanoscale ferroelastic domains can lead to stable cycling if the starting material is the orthorhombic polymorph of Li2Mn2O4.23,24 Second, dissolution of Mn into the electrolyte occurs via the disproportionation reaction25 2Mn3+ → Mn4+ + Mn2+ for average Mn oxidation state below 3.5+ (which also occurs at 1 < X < 2).
In practice, for commercial cells employing cubic LMO and a delithiated anode such as graphite, the amount of available working lithium is not sufficient to support cycling through average compositions of 1 < X < 2. Still, capacity fade issues persist even within the 0 < X < 1 regime. Jang et al. demonstrated a connection between the initial capacity fade trajectory at 0 < X < 1 and the concentration of Mn2+ dissolved in the liquid electrolyte, and further hypothesized that rising impedance was caused by electronic contact resistance formed at the interfaces between the carbon matrix and dissolving LMO particles.26 They later noted that the loss of lithium, manganese, and eventually oxygen from the LMO lattice correlated with acid production caused by electrolyte oxidation above 4.2 V or the existence of impurity water in the cell.27 Later, Thackeray et al. reported the existence of trace tetragonal spinel phase in cycled LMO particles maintained well above 2.9 V, indicating that this destructive cubic-tetragonal transformation could occur even at 0 < X < 1 due to inhomogeneous Li+ "overlithiation" at end of discharge.28,29 Their understanding was that frequent formation of small tetragonal domains on the surfaces of LMO particles could lead to structural degradation or gradually accumulated fatigue. Other authors suggested disordering of Li+ and Mn3+/4+ atomic positions,30 uncontrolled conversion of the spinel phase to other non-active materials,31 and occurrence of a transient hexagonal phase at the endpoints of the 0 < X < 1 cycling range.32 In many cases, these capacity fade mechanisms were closely related to oxygen non-stoichiometry and small fluctuations in average Mn oxidation state.33,34 In light of these proposed degradation pathways, many studies demonstrated improved capacity retention in the 0 < X < 1 range via cationic or anionic doping35–39 or using electrolyte additives to suppress the dissolution of active material.40 However, the mechanistic links between fracture and performance loss are still not understood fully.
The thermodynamic phase behavior of LMO provides multiple levers with which fracture can be induced. In a previous study,41 we demonstrated that we could induce fracture and associated acoustic emissions in LMO/Li cells by temporarily cycling at higher C-rates (current values denoted with respect to 1C, or the current required to discharge the cell in one hour) within the range 0 < X < 1 (4 V). That observation was consistent with the C-rate dependent "electrochemical shock" concept developed in detail by Woodford et al.42–45 However, their simulation results indicated that such diffusion-induced stress was small when compared with stresses caused by the cubic-cubic spinel phase transformation occurring in the 0 < X < 1 range;44 the transformation stresses in the cubic-tetragonal regime are larger still. In the present work, we deliberately created controlled fracture events via the cubic-tetragonal transformation at 1 < X < 2, using LMO/Li half-cells. We arbitrarily inserted these "deep discharge cycles" between many constant-current cycles in the range 0 < X < 1. After inducing these controlled fracture events, we monitored changes in capacity and impedance behavior to determine the effect of fracture on the electrode performance, as well as the mechanisms by which fracture degrades the electrode. Overall, we found that this strategy was much more aggressive than C-rate modulation in inducing fracture, and likewise resulted in more significant changes in electrochemical performance.
In this work, we draw on the impressive volume of previously established knowledge of capacity fade mechanisms in LMO to interpret the electrochemical responses to controlled fracture events implemented herein. We thus identify mechanisms by which fracture of these cathode particles leads ultimately to capacity loss and impedance growth over many electrochemical cycles. This development of our fundamental understanding of electrochemomechanical fatigue will benefit future engineering of electrode materials, both for conventional batteries and for emerging all-solid-state battery systems.
Methods
Sample preparation
Composite LiMn2O4 electrodes (LiMn2O4, carbon, binder) cast on aluminum foil were purchased from MTI Corporation (Richmond, CA) and cut into discs 12 mm in diameter. Active material loading of 94.2 wt% and composite film thickness of 85 μm were specified by the manufacturer. The total mass of LiMn2O4 present in each disc was ∼16 mg, with particle diameters spanning from the sub-micrometer range to ∼10 μm. In an argon-filled glove box, the electrodes were assembled into LiMn2O4/Li half-cells using stainless steel 2032 coin cell hardware and a liquid electrolyte of 1.2 M LiPF6 in 1:1 (by volume) ethylene carbonate/diethyl carbonate solution.
Electrochemical testing was conducted on a Solartron 1470E with a frequency response analyzer. After electrochemical cycling, the cells were returned to the glove box and opened carefully with a specialized tool designed to prevent shorting (DPM Solutions, Hebbville, NS, Canada). The extracted LMO cathodes were rinsed with diethyl carbonate and dried in the glove box antechamber prior to post mortem imaging.
Cycling schedules and deep discharge cycles
While X-ray diffraction studies have measured the change in lattice parameter a during the cubic-cubic transformation (0 < X < 1) as ∼1.2%, the Jahn-Teller distortion during delithiation through the 1 < X < 2 range exhibits up to 3.0% shrinkage in the a direction and 12.3% expansion in the c direction of the crystalline lattice.21 Such large and anisotropic volume changes lead to high stresses at the phase boundaries.44,46 Since this cubic-tetragonal phase transformation of LiXMn2O4 occurs at ∼2.9 V, the open circuit voltage should be maintained above this value for normal 0 < X < 1 cycling. We thus implemented what we term "deep discharge cycles" into the 1 < X < 2 regime during an otherwise "normal" 0 < X < 1 cycling scheme, which created the conditions necessary to propagate the cubic-tetragonal phase transformation. Here, we conducted electrochemical tests on two groups of cells, denoted by their cycling schedules as Group SDD (single deep discharge) and Group MDD (multiple deep discharge). Thus the phrases "single deep discharge" and "multiple deep discharge" refer to the number of cycles for which the cell voltage was decreased to 2.5 V, thereby providing sufficient overpotential to lithiate through the 2.9 V phase transformation. Figure 1 shows the Group SDD and Group MDD sequences in voltage vs. time format. Table I summarizes the key differences between these cycling schedules.

Figure 1. Cycling sequence for (a) cells subjected to single deep discharges (Group SDD) and (b) cells subjected to multiple deep discharges (Group MDD), illustrated as voltage vs. time. The dotted red boxes in each panel indicate the specific regions shown in the next panel. The inset in the bottom-right panel shows the sinusoidal voltage applied during impedance measurements.
Table I. Comparison of single deep discharge and multiple deep discharge schedules.
| Cycling schedule | Baseline C-rate | Deep discharge cycle numbers | Cells presented | Duration of each hold at 2.5 V(h) |
|---|---|---|---|---|
| Single deep discharge (SDD) | C/5 | 31 | Cell SDD-A | 30 |
| Cell SDD-B | 90 | |||
| Multiple deep discharge (MDD) | C/9 | 12–15, 24–27, 44–47, 56–59 | Cell MDD-A | 10 |
Group SDD
Group SDD cells were subjected to 30 baseline cycles at C/5 (5 hours for each charge or discharge) in the 3.5 V–4.4 V window. Upon reaching the cutoff voltage after each charge and discharge, the cells rested under open circuit conditions for 30 min, and then were held at 4.15 V and 3.9 V, respectively, for 30 min. At the end of each potentiostatic hold, an impedance measurement with sinusoidal amplitude 10 mV was conducted at 10 points per decade from 106–10−2 Hz. After these 30 cycles, a single deep discharge cycle was conducted, in which each cell was discharged at C/9 to 2.5 V. As lithiation through the 1 < X < 2 range exhibited slow reaction kinetics and did not near completion before the 2.5 V cutoff, cells SDD-A and SDD-B were held at 2.5 V for 30 h and 90 h, respectively. The cells were then charged to 3.9 V at C/9 and held at 3.9 V for 5 h, after which the cells were cycled 20 times at C/5 as before in the 0 < X < 1 range.
Group MDD
Group MDD cells were cycled seven times at C/9 in the 3.5 V–4.3 V window. Upon reaching the cutoff voltage after each charge and discharge, the cells were held at 4.3 V and 3.5 V, respectively, until the current dropped to C/190. On cycle 8, the cells were charged at C/9 to 4.0 V and the following potentiostatic intermittent titration technique47,48 (PITT) sequence was conducted in tandem with multiple impedance measurements. After equilibrating at 4.0 V until the current decayed to C/370, an impedance measurement with sinusoidal amplitude 10 mV was conducted at 10 points per decade from 106–10−3 Hz. The cell was held for an additional 30 min at 4.00 V, and the potential was stepped instantaneously to 4.02 V. Current response during the potentiostatic step was collected at 1 data point per 20 s, such that only long-time-scale data would be used for PITT analysis. The cell was again held at 4.02 V until the current decayed to C/370, and this impedance and potential step sequence repeated in 20 mV increments until the final step to 4.1 V. Typical relaxation time before the current cutoff was 2–7 h for each step, and the total amount of time that elapsed during the full measurement sequence at all six potential values was ∼1.5 days. After impedance measurement at 4.1 V, the cycling continued at C/9 starting in the charging direction for four additional cycles. A similar group of potential steps and impedance measurements followed these four cycles at C/9.
After the second group of PITT and impedance measurements, the cells were cycled four times at C/9 in the 2.5 V–4.3 V window. This change of the low potential limit to 2.5 V represents four consecutive deep discharge cycles. The same format of C/190 current cutoff was applied to the 2.5 V potentiostatic step, but a termination criterion of 10 hours was added to place an upper limit on the time duration of the experiment. The cells consistently reached the 10-hour limit before reaching the C/190 current cutoff. After these four deep discharge cycles, the same potential steps and impedance measurements followed. The pattern of a set of cycles followed by PITT and impedance measurements was repeated, and the potential range of each set of cycles was either uniformly 2.5–4.3 V or uniformly 3.5–4.3 V. All deep discharge cycle sets consisted of four cycles, but the normal cycle sets varied in number of cycles. The full electrochemical schedule for Group MDD cells is included in the Supplementary Material. Impedance data collected for Group MDD cells are presented herein, while PITT data are presented in the Supplementary Material.
Definitions and terminology used in electrochemical calculations
Distribution of relaxation times (DRT)
The electrochemical impedance spectra presented herein consist of several highly convoluted signals that could not be separated easily with the often-used complex non-linear least squares (CNLS) fitting available in commercial software. To improve visual resolution and facilitate quantification of these impedance signals, we used distribution of relaxation times (DRT) analysis in the 100 Hz < f < 104 Hz frequency range typically associated with interfacial electrode resistance. We discussed DRT analysis in our previous work;41 more complete discussions of DRT and its applications to batteries and fuel cells are available elsewhere.49–51 In interpreting the results for the present work, it is sufficient to note that the integrated area of a given peak in the DRT format equals the total resistance caused by the corresponding impedance mechanism, analogous to semicircle diameter in the complex plane representation. Moreover, the DRT can be used only to analyze impedance features of the form R||CPE (R = resistor, CPE = constant phase element) which would appear semicircular in the complex plane. In some cases noted herein for which CNLS fitting was more appropriate, we instead conducted CNLS fitting with ZView (Scribner, Southern Pines, NC).
Capacity definitions
Because the electrochemical sequences used herein were unusual, the meaning of capacity also requires careful definition. In all cases, we report capacity in the way that is most useful in enabling meaningful interpretation of our results.
Group SDD discharge capacity as reported herein is a summation of three components: (1) Total charge passed during the 4.15 V potentiostatic step (current is consistently in discharge direction following open circuit relaxation from 4.4 V); (2) Total charge passed during impedance measurement (negligible but included for completeness); and (3) Total charge passed during galvanostatic discharge to 3.5 V. For all normal 0 < X < 1 cycles, the third capacity contribution was the largest component, while for the deep discharge cycle, the potentiostatic step (at 2.5 V rather than 4.15 V) was the largest.
Since each 0 < X < 1 discharge began with a potentiostatic step, often still exhibiting significant current at the 30 min cutoff, neglecting the charge passed during this step would prohibit meaningful interpretation of the remaining capacity value corresponding to the galvanostatic step. Therefore, reporting the capacity as the aforementioned sum allows us to track the total charge passing into and out of the system, and is the best representation of the total amount of LMO available each cycle. Charge capacity defined within this manuscript for Group SDD was calculated in a similar way, by adding to the galvanostatic segment the contributions from the potentiostatic and impedance steps at 3.9 V.
Group MDD cycling was a standard CCCV (constant-current constant-voltage) procedure until the introduction of the more complex PITT and impedance sequence. Therefore, we define the discharge capacity for Group MDD cells according to the usual convention of the battery community; discharge capacity for Group MDD cells accounts only for the charge passed during each galvanostatic segment.
Coulombic efficiency
Coulombic efficiency calculated for Group MDD cells accounts for charge passed during both the constant-current and constant-voltage steps. Since many of the cells presented herein exhibited significant capacity fade, we did not calculate Coulombic efficiency as -Qdischarge/Qcharge for each cycle, where Q is capacity. Since charge capacity and discharge capacity are not measured at the same time, we found that this usual representation of Coulombic efficiency was controlled mostly by capacity fade, and did not provide useful information about current lost to parasitic reactions. Therefore, we interpolated linearly between charge capacity data to subtract the effect of capacity fade occurring within each cycle, such that the discharge capacity of cycle i was compared to an effective charge capacity at cycle i + 1/2:
![Equation ([1])](https://content.cld.iop.org/journals/1945-7111/165/11/A2458/revision1/d0001.gif)
This modified definition of Coulombic efficiency allowed us to focus our discussion on parasitic reactions without including the effect of concurrent capacity fade.
Microscopic characterization
Two scanning electron microscopes (SEMs) were used in this study. Ion milling and concurrent imaging were conducted on a Helios Nanolab 600 Dual Beam Focused Ion Beam Milling System (FIB) using 2.8 nA ion beam current for the milling step. Imaging not involving ion milling was conducted on a Zeiss Merlin High-Resolution SEM. In both cases, imaging was conducted in secondary electron mode using a 5.0 kV electron beam.
Results and Discussion
Microscopic evidence of fracture post-cycling
We conducted post mortem SEM imaging of a cell subjected to 67 electrochemical cycles, including 16 deep discharge cycles (Cell MDD-A). Figure 2a shows a representative particle, densely covered with cracks exhibiting as many as three preferred orientations as viewed from the particle surface. In many cases, spacing between cracks was less than 1 μm. While Fig. 2a is a representative image, these fracture characteristics were ubiquitous among images acquired throughout the cycled electrode; such features were quite distinct in appearance and frequency from those observed on pristine LMO as we reported previously.41 The prevalence and degree of fracture herein also was noticeably more severe than in LMO electrodes subjected to abrupt changes in C-rate that we reported previously, which yielded crack spacing of 1–3 μm after repeated cycling in the 0 < X < 1 regime.41 Figure 2b shows a focus ion beam-milled cross-section of this same representative particle, verifying that the dense crack network penetrated deeply into the particle.
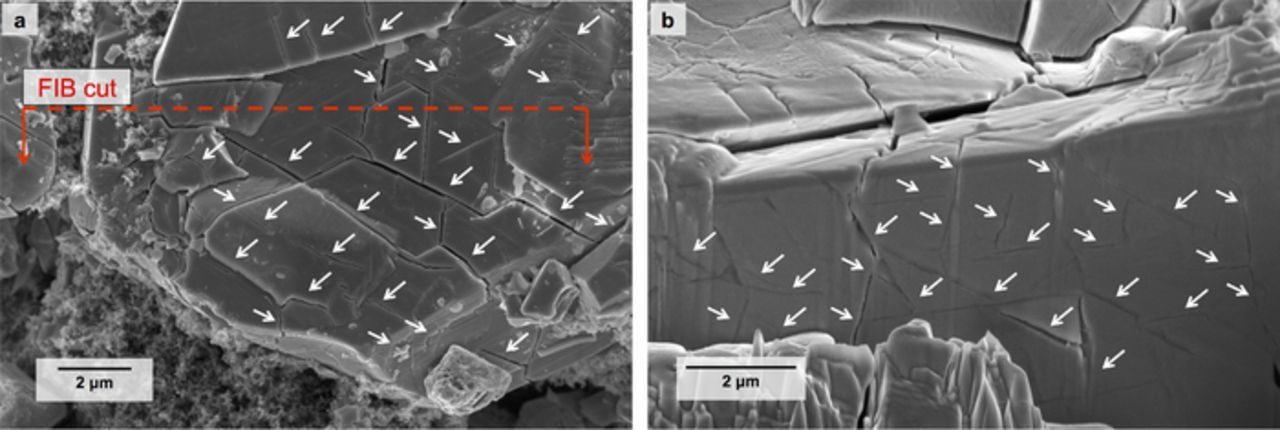
Figure 2. (a) Extensive fracture is visible in an LiXMn2O4 (LMO) particle subjected to 16 deep discharge cycles and 51 cycles in the 0 < X < 1 range. (b) Internal cracking in the LMO exposed by focused ion beam (FIB) milling of the particle shown in (a). White arrows indicate cracks.
These images provide us with insights into the possible connections between fracture and electrochemical performance in LMO electrodes. From the plan view of the particle (Fig. 2a), a subset of the cracks opened to the extent that electrolyte could easily wet the newly created surfaces. Additionally, some fragments of the particle began to separate at the edges. Other particles in the electrode appeared to have crumbled into completely separated fragments of 1–2 μm width. From these observations, we expect that fracture may have increased the total area of electrode-electrolyte interface. On the other hand, the dense internal crack network (Fig. 2b) is consistent with the hypothesis that cracks disrupt electronic or ionic flow through the particle bulk. We do not attempt to draw conclusions based solely on these images, but instead consider the appearance of the fractured samples in the context of the following electrochemical results and analysis.
Sudden growth of interfacial electrode impedance
Figure 3 shows electrochemical impedance in Bode plot format, both before and after a single deep discharge cycle at cycle 31 (Cell SDD-A). The y-intercept of impedance magnitude |Z| at the left-hand axis correlates with the total overpotential occurring after 100 s of charging or discharging (frequency f = 10−2 Hz). For the sake of discussion, we use this quantity at the lowest measured frequency of 10−2 Hz as a rough single-value impedance measure. Consistently, less than 20% of this impedance was attributable to low-frequency bulk or electrolyte diffusion at f < 100 Hz, and the remaining impedance was attributable to electrode interfacial impedance contributions occurring at 100 Hz < f < 104 Hz. These low and medium frequency ranges correspond roughly to the linear Warburg arm and the semicircular regions composed of R||CPE elements, respectively, in the complex plane impedance representation. The cells were held at 4.15 V while each impedance measurement was conducted, as described in Methods.

Figure 3. Bode plot for cell subjected to a single deep discharge cycle (Cell SDD-A), with cycles 1–51 represented on a color scale of black to blue, and cycles immediately before and after the deep discharge cycle highlighted in red. Impedance growth is concentrated in the range 100 Hz < f < 104 Hz.
Before the deep discharge cycle, the total impedance at f = 10−2 Hz increased quickly to ∼250 Ω within 20 cycles, and the growth then slowed until cycle 30. Impedance remained below 300 Ω until the deep discharge cycle. After the deep discharge cycle, normal cycling resumed, and the impedance increased suddenly to ∼400 Ω. Figure 3 shows that this impedance growth occurred primarily at 100 Hz < f < 104 Hz, indicating that the low-frequency diffusion behavior did not change significantly. Impedance at f = 10−2 Hz remained near 400 Ω for the duration of the experiment.
Identifying mechanisms responsible for impedance growth
Figure 4a shows the DRT in units of Ω × s for the frequency range 100 Hz < f < 104 Hz at 4.15 V (Cell SDD-A), starting from cycle 1 (black) and ending at cycle 51 (blue). The spectra measured before and after the deep discharge cycle (cycles 30 and 32, respectively) are shown in red to highlight the impedance discontinuity occurring at the deep discharge cycle. This DRT representation only includes impedance contributions that appear semicircular in the complex plane, and represents interfacial impedance caused by surface layers, charge-transfer resistance, and/or electronic contact resistance. Multiple researchers have reported these impedance contributions in LMO under a variety of conditions.52–54 A full impedance characterization of identically prepared LMO cells, including identification of DRT peaks, is provided in our previous work.41 We consider the impedance spectra herein to belong chiefly to the LMO cathodes, as determined via three-electrode impedance measurements discussed in the Supplementary Material of Ref. 41.

Figure 4. (a) Distribution of relaxation times for impedance at 4.15 V (Cell SDD-A). Cycles 1–51 are represented on a color scale of black to blue, with the cycles immediately before and after the deep discharge cycle highlighted in red. (b) Gaussian deconvolution of the distribution of relaxation times. Peak 1 is composed primarily of electrical contact resistance, with a small contribution from charge transfer resistance. An immediate increase in Peak 1 occurred at the deep discharge cycle (labeled "DD"), followed by a gradual decay over many cycles. Peak 2 represents surface layer impedance, which rises gradually over the course of the experiment and is continuous at the deep discharge cycle.
The DRT spectra in Fig. 4a include two distinct peaks occurring at 101–102 and 102–103 Hz; we refer to these peaks as Peak 1 and Peak 2, respectively. From our previous work, Peak 1 in Fig. 4a represents electronic contact resistance in the bulk of the LMO electrode.41 In the cycles before the deep discharge cycle, we detected a small peak corresponding to charge transfer resistance at < 101 Hz, but it could not be resolved consistently once the contact resistance peak exceeded ∼200 Ω. For this reason, the Peak 1 impedance reported in Fig. 4b is the sum of the contact resistance peak and the much smaller charge transfer resistance peak, but it is dominated by electronic contact resistance. Peak 2 consists of a convolution of cathode surface layer resistance and current collector contact resistance. To determine the resistance values associated with each peak in Fig. 4b, we fit the Fig. 4a spectra to two or three Gaussian distribution curves (three if able to resolve charge transfer resistance). The resistance of each peak is equal to its integrated area in the DRT format. Although Peaks 1 and 2 appear to increase together during the deep discharge cycle in Fig. 4a, Gaussian deconvolution revealed that the sudden impedance increase occurred in Peak 1, while the area of Peak 2 remained constant during the deep discharge cycle.
From Fig. 4, we conclude that the deep discharge cycle caused an immediate amplification of electronic contact resistance, and that this contact resistance decayed slowly over a period of many cycles afterwards. In contrast, Peak 2 did not change discontinuously at the time of the fracture, but did increase more quickly after the deep discharge cycle. These observations are consistent with the hypothesis that an internal network of cracks (similar to Fig. 2b) may disrupt electronic conduction without immediately increasing electrochemically active surface area. Over a period of several cycles, we might expect these cracks to open and allow either penetration of electrolyte into the particle or redistribution of active material fragments. Although we can speculate about why the impedance drifts at long time scales after the deep discharge cycle, we focus here on the sudden increase in contact resistance after the induction of fracture.
The attribution of electrical resistance to crack development is reasonable, but we must take care to rule out a competing degradation effect during the deep discharge cycle. Multiple reports have raised the possibility that Mn dissolution itself may create contact resistance by degrading the interface between LMO and the conductive carbon matrix.26,55 The low potentials (and therefore average Mn oxidation state below 3.5+) occurring during the deep discharge cycle could therefore be responsible for the observed contact resistance increase via Mn dissolution. To rule out the effect of Mn dissolution at the LMO-carbon interface, we implemented 30 h and 90 h potentiostatic holds at 2.5 V for two cells with otherwise identical cycling conditions (Cells SDD-A and SDD-B, respectively). Mn dissolution is known to occur under storage conditions in the absence of cycling,56 so we reasoned that a longer exposure to low potential might result in more Mn dissolution. Instead, we found that both the impedance (|Z| at f = 10−2 Hz) and capacity curves of the two cells matched within 12% and 5% of each other, respectively, from cycles 20 through 50 (see Supplementary Material). During the single deep discharge event at cycle 31, the cell held for 90 h (Cell SDD-B) was exposed to a 300% longer 2.5 V potentiostatic hold, but the total charge passed during this 90 h hold was only ∼33% greater. The impedance increase in the two cells was comparable (50% increase in Cell SDD-B vs. 40% increase in Cell SDD-A). Therefore, since extended exposure to low potentials did not correlate with impedance growth, we infer that the increase in contact resistance was caused directly by fracture rather than by Mn dissolution at LMO-carbon interfaces.
Improvement in interfacial kinetics for cells with low electronic contact resistance
We reproduced the contact resistance amplification described above in multiple cells, and observed this effect under both Group SDD and Group MDD cycling conditions. However, the existence of a contact resistance peak prior to the deep discharge cycle was a common feature of cells exhibiting this amplification. Contact resistance varied in magnitude among cells examined herein, and in some cases it was a negligible contribution to the impedance. In cells that did not feature a dominant contact resistance peak, the impedance increase did not occur after the deep discharge cycle. In fact, we actually observed a decrease in cell impedance several cycles after deep discharge cycles for two cells cycled under Group MDD conditions, including Cell MDD-A.
Figure 5a shows the interfacial impedance (4.10 V) in DRT format at the impedance measurement time points of the Group MDD cycling schedule (Cell MDD-A). Spectra shown in red correspond to impedance measurements taken immediately after a group of 4 deep discharge cycles (after cycles 12–15, 24–27, and 44–47), and all other spectra are shown in black. A total of 63 days passed between the first measurement after cycle 7 and the last measurement after cycle 55. As in Fig. 4a, the signals from low-frequency diffusion and high-frequency (f > 105 Hz) ohmic resistance are not visible in this format.
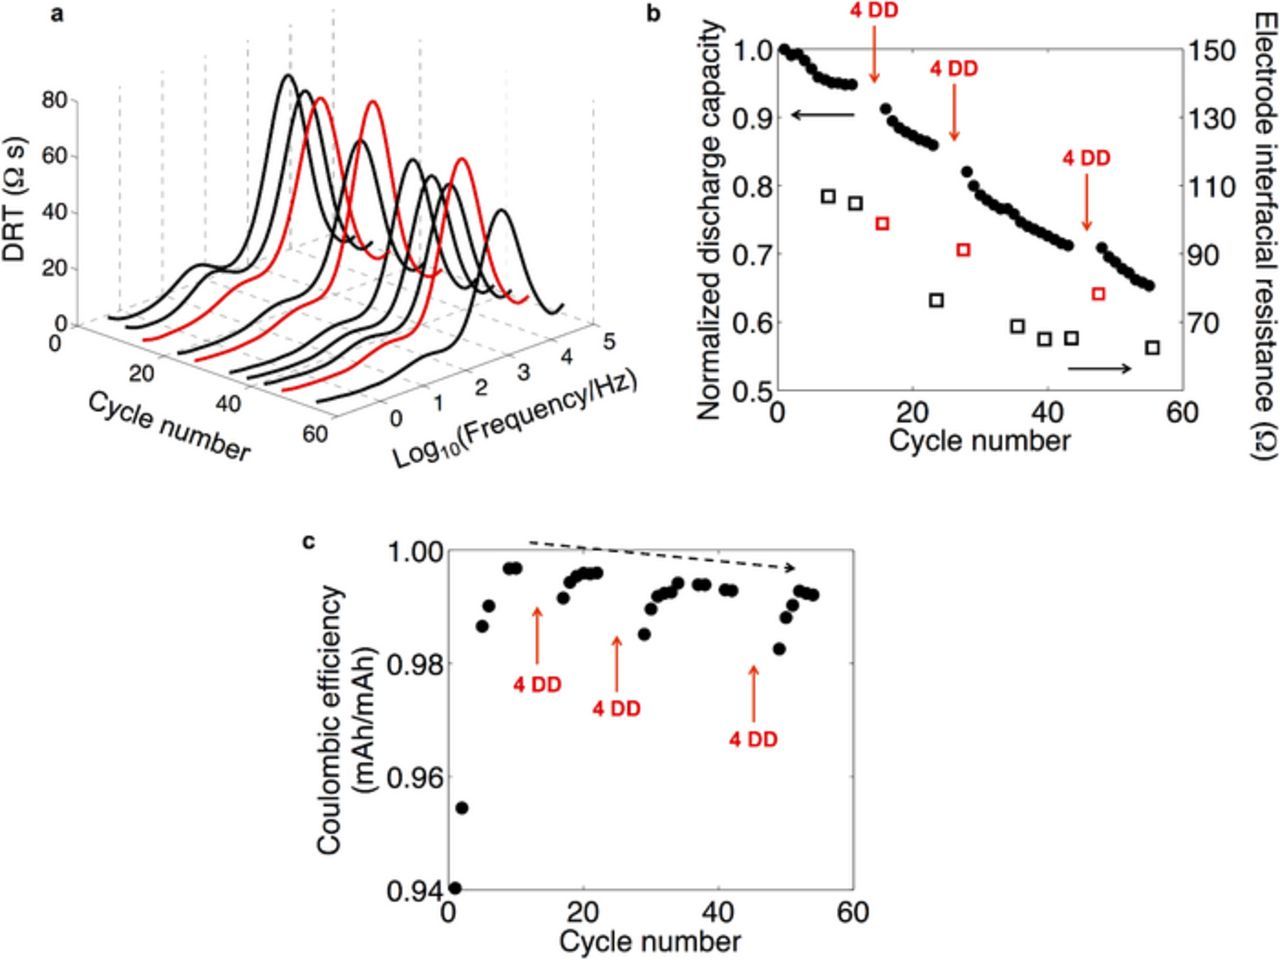
Figure 5. (a) Impedance (4.10 V) at the impedance measurement points of the Group MDD cycling sequence (Cell MDD-A). Measurements immediately following deep discharge cycles are shown in red. (b) Capacity fade and total electrode interfacial resistance (4.10 V), with red arrows denoting each application of four deep discharge cycles (each set labeled "DD"). (c) Coulombic efficiency during cycling in the 0 < X < 1 range. In the Coulombic efficiency calculation, discharge capacity at cycle i is compared to charge capacity at cycle i + 1/2, obtained by linear interpolation of the charge capacity curve.
The DRT spectra in Fig. 5a are each composed of two easily distinguished peaks. Based on our previous analysis, we assigned the large peak at higher frequency (f ∼ 103 Hz) to a convolution of current collector contact resistance and cathode surface layer resistance, and the small peak at low frequency (f ∼ 101 Hz) to charge-transfer resistance.41 Considering only the black spectra, the area of both peaks decreased visibly during the course of the experiment, with the most rapid impedance loss recorded several cycles after the first group of deep discharge cycles at cycles 12–15. The total resistance of these features as calculated by CNLS fitting is plotted against cycle number in Fig. 5b. Figure 5b also shows discharge capacity data up to 55 cycles (Cell MDD-A), which we discuss further in the next section. Additional data for this cell are included in the Supplementary Material for completeness.
The low-frequency and high-frequency peaks at cycle 55 were ∼20% and ∼70%, respectively, of their initial values at cycle 7. Both of these impedance contributions depend heavily on electrochemically active surface area, and thus this reduction of interfacial impedance is consistent with an increase in electrode surface area. The alternating increase and decrease of the high-frequency peak is consistent with a concurrent growth mechanism for this peak as seen in Fig. 4b, while the steeper reduction of the low-frequency peak allows us to estimate a ∼fivefold increase in electrochemically active surface area between cycles 7 and 55. The SEM micrographs of this cell in Fig. 2 support our understanding that widespread fracture can increase the available surface area of active LMO material, thereby reducing impedance of the LMO-electrolyte interface. A recent study of transport kinetics for single secondary particles of LiNi1-X-YMnXCoYO2 (NMC) and LiNi1-X-YCoXAlYO2 (NCA) also attributed a reduction in charge-transfer resistance to increased cathode-electrolyte surface area following cycling-induced microcracking.8
The impedance behavior immediately after the deep discharge cycles (red spectra in Fig. 5a and red squares in Fig. 5b) differed clearly from the overall trend. Each red high-frequency peak was consistently higher in magnitude as compared with the next black spectrum in the sequence, while the low-frequency peak did not exhibit this anomalous behavior. As the overall trend was a decrease in impedance over long time scales, it is not critical that we deduce the source of these transient increases in impedance. It is possible that a temporary contact resistance contribution increased the overall impedance, similar to the cells subjected to a single deep discharge (Group SDD). However, the DRT spectra in Fig. 5a did not exhibit a resolvable contact resistance peak. Alternatively, the surface layer impedance may have increased temporarily due to a dependence on recent cycling history linked to the Mn oxidation state at the LMO surface. Regardless, the major trend was that the electrode interfacial impedance decreased gradually during the aggressive two-month cycling sequence. This result demonstrates that fracture can have a beneficial effect on electrode interfacial kinetics by increasing the available surface area. However, from an application standpoint, this kinetic improvement is outweighed by the concurrent, rapid capacity fade discussed below.
Increase in rate of capacity fade
The steady decrease in impedance in Fig. 5, and its strong correlation with the controlled fracture events, are together consistent with the creation of new electrode-electrolyte interfaces. Although this impedance decrease is desirable from an application standpoint, the fracture events also triggered severe capacity loss. In Fig. 5b, the first 11 cycles exhibited a standard LMO capacity fade trajectory that stabilized at ∼95% retention of the initial capacity. Jang et al. and others showed explicitly by Mn concentration measurements that dissolution of active material correlates strongly with this initial capacity loss typically observed during 0 < X < 1 cycling of LMO/Li cells at room temperature.26,27,57 (See Supplementary Material for further discussion on those previously published data.) In Fig. 5, the impedance was not increasing, and thus the observed capacity is a true indication of the amount of active material available for lithiation.
After these opening cycles, we implemented the first set of four deep discharge cycles. Capacity values are not shown for these four cycles, as they underwent lithiation to a value X > 1 and thus above the 100% limit in Fig. 5b. As normal cycling resumed, cycle 16 exhibited a ∼4% lower capacity than that recorded in cycle 11. A second period of gradual capacity fade occurred in the subsequent cycles, with a trajectory similar to the opening cycles. After eight additional cycles, the aforementioned behavior was reproduced by the second set of four deep discharge cycles, albeit with less potency. Most of the capacity fade throughout the experiment occurred gradually in the cycles following fracture. At cycle 55, the total amount of lost capacity was approximately seven times larger than after cycle 7, amounting to a nearly one-to-one correspondence with the approximately fivefold increase in electrode-electrolyte surface area. (See Supplementary Material for full comparison of surface area and capacity fade.) Lu and Lin previously measured a correlation between surface area and Mn dissolution for LMO soaked in LiPF6 electrolyte at high temperatures.58 We therefore speculate based on such prior studies that this gradual, fracture-triggered onset of capacity fade is caused by dissolution of active material from the newly exposed electrode surfaces.
The fracture events triggered a parallel response in the Coulombic efficiency, thereby signaling fracture-induced acceleration of a side reaction correlated with cathode surface area. Figure 5c shows the Coulombic efficiency after subtracting the effect of full-cycle capacity fade as described in Methods (Cell MDD-A). The first 11 cycles showed a behavior similar to formation cycles in which parasitic reactions gradually decayed. Such loss of current in early cycles is often associated with solid electrolyte interphase (SEI) formation on the anode surface.59
After the Coulombic efficiency stabilized at ∼99.7%, the deep discharge cycles triggered another decrease in Coulombic efficiency concurrent with accelerated capacity fade in Fig. 5b. The Coulombic efficiency recovered to ∼99.6% after several cycles, exhibiting the same decay behavior as the formation cycles. Two more sets of deep discharge cycles again produced similar responses with recovery to ∼99.4% and ∼99.3%. It is worth noting that after each group of deep discharge cycles, the Coulombic efficiency recovered to a lower value than in previous cycles. This steadily and permanently decreasing Coulombic efficiency indicates an increase in the rate of current-consuming side reactions. Although we cannot state conclusively that Mn dissolution is related causally to this efficiency loss, the observed behavior is consistent with accelerated SEI growth on the anode due to an increase in both LMO surface area and Mn2+ dissolution and deposition.60 We consider other physical sources of this trend in the Supplementary Material.
A similar but weaker trend in capacity fade occurred in cells subjected to a single deep discharge cycle (Group SDD). Figure 6 shows discharge capacity and impedance at f = 10−2 Hz before and after the deep discharge cycle (Cell SDD-B). The capacity curve before the deep discharge cycle exhibited positive curvature, while the capacity curve after the deep discharge cycle was linear with a steeper slope. Cell SDD-A exhibited a temporary increase in capacity after the deep discharge cycle (shown in Supplementary Material), perhaps as a result of increased diffusion kinetics at times beyond 100 s. However, like the other cells discussed herein, the rate of capacity fade (slope) also increased.

Figure 6. Discharge capacity and impedance at f = 10−2 Hz (Cell SDD-B). After the deep discharge cycle (labeled "DD") at cycle 31, both impedance and the rate of capacity fade increased abruptly.
Interpreting differences between discontinuity behaviors of capacity and impedance
A critical observation can be made from the correlations exhibited in Fig. 6 for cells subjected to a single deep discharge cycle (Group SDD). By considering capacity fade and impedance growth together, we can infer that these two aspects of battery performance loss were effectively decoupled in these experiments, as follows. After fracture, electronic impedance growth occurred abruptly, consistent with crack formation within the LMO particles. The capacity profile did not reflect this discontinuous behavior, thereby suggesting that this loss of connectivity did not affect the capacity significantly. We note here that disconnection typically results in immediate, rather than delayed, capacity loss in other LIB systems, in contrast with the gradual capacity fade observed herein.5,7–9,61 The 4% loss in capacity between cycles 11 and 16 in Fig. 5b may be related to such disconnection events, but this component is a relatively small portion of the observed capacity fade.
Moreover, in the cycles following the deep discharge cycle in Fig. 6, capacity fade occurred at a faster rate, but we observed no further impedance increase to suggest that electronic contact continued to degrade in the cycles following the fracture event. Despite lack of evidence in the impedance signals for delayed disconnection events, it is still possible that a compounding influence of electronic disconnection may have affected the capacity response. Actively controlling Mn dissolution, for example via electrolyte variation, could be a promising future direction both for investigating this effect and for testing the applicability of these results to other LIB systems.
Thus, we determined that two distinct mechanisms control the capacity fade and impedance growth, and that they occur over two different time scales: the onset of fracture-induced contact resistance occurs immediately after fracture, while capacity loss occurs over multiple cycles and correlates with side reactions acting upon newly exposed electrode-electrolyte interfaces. The distinguishing of these mechanisms and the time scales of their occurrence is necessary to fully understand degradation in any electrode exhibiting both fracture and capacity-reducing surface reactions.
Figure 7 schematically outlines the degradation sequence indicated by our results. In a pristine particle (Fig. 7a), some initial flaws exist, but electronic conductivity is intact and active material dissolves only from surfaces in contact with the electrolyte. Following a single event in which a crack network is created in the particle (Fig. 7b), electronic flow is immediately slowed by poorly conducting crack interfaces, and electronic impedance increases as in Figs. 3, 4, and 6. The infiltration of electrolyte into the newly created flaws leads to the onset of Mn dissolution observed in Figs. 5 and 6. If fragmentation occurs (Fig. 7c), pathways for electronic conduction may become less tortuous, but Mn dissolution continues on the newly created surfaces. Lithiation and delithiation continue in minor particle fragments until they decompose, provided that they remain grounded to the electronic circuit. The decreasing impedance and absence of electronic contact resistance in the electrode subjected to many deep discharge cycles (Cell MDD-A, Figs. 5a-5b) suggest that most particle fragments do indeed remain grounded, and thus the total active surface area increases.

Figure 7. Graphical summary of the fracture sequence occurring within these experiments. (a) Mn2+ begins to dissolve from a pristine particle immersed in liquid electrolyte. Electronic conduction to the particle surface remains intact. (b) The formation of a dense crack network creates additional flaws from which Mn2+ dissolves. Electrolyte penetrates into open cracks, accelerating this dissolution. Electronic conduction becomes more difficult due to the formation of poorly conducting crack interfaces. (c) Fragmentation further accelerates Mn dissolution. Minor fragments sufficiently grounded to the electronic circuit do not suffer from tortuous electronic flow. Inset: SEM image of an LMO particle that has fragmented significantly upon cycling.
This sequence for a simplified discrete fracture event allows us to propose a more complete understanding for the gradual performance loss exhibited by LMO cells cycled in the range 0 < X < 1. Although electrochemical shock studies have indicated that a single discrete fracture event takes place in the first 1–2 cycles,7,43,62–64 it is generally expected that commercially cycled LMO cells also experience electrochemomechanical fatigue, or gradually accumulated fracture damage. As others have shown,28,29 tetragonal LMO can occur on particle surfaces even during cycling in the range 0 < X < 1. These conditions promote fracture near the surface of the electrode particles due to lattice parameter mismatch between the cubic and tetragonal phases. Therefore, the mechanisms revealed in this work should be understood not only for their role in early-cycle electrochemical shock, but as a process that repeats and accumulates damage upon repeated cycling, akin to incremental crack propagation in mechanical fatigue. Fracture-induced capacity fade and impedance growth are thus the superposition of these short-term and long-term consequences of many uncontrolled fracture events.
Although the battery community has identified contact resistance and Mn dissolution as generally reducing the lifetime of LMO, we have demonstrated here an experimental decoupling of these degradation effects. With the advent of all-solid-state batteries, we can next consider which degradation mechanisms will be relevant for spinel compounds after replacement of the liquid electrolyte with a solid counterpart. The concepts used herein and in our previous work with cycling rate variation41 may also be applied to other battery systems to methodically deduce important degradation mechanisms and engineer toward predictable and improved cell lifetime.
Conclusions
Here we leveraged the cubic-tetragonal phase transformation of LMO to create controlled fracture events while closely monitoring changes in cycling performance and electrochemical impedance. We found that deep discharge through the cubic-tetragonal phase transformation regime (1 < X < 2) caused an immediate increase in electrochemical impedance in the 101–102 Hz range, which we identified previously as active particle electronic contact resistance. We demonstrated with control experiments that this increase in impedance was likely attributable to fracture rather than to low-voltage Mn dissolution. Deep discharge cycles also triggered a gradual loss of capacity spanning several cycles. This accelerated capacity fade is consistent with increased electrode-electrolyte surface area in a chemical environment that promotes the dissolution of active material into the liquid electrolyte.
Thus, our analysis decouples two separate mechanisms by which fracture reduces LMO performance over differing time scales. Following fracture, the introduction of poorly conducting crack surfaces immediately amplifies electronic contact resistance, while dissolution reactions primarily affect capacity over longer time scales. The decoupling of these mechanisms facilitates understanding of the interplay among chemomechanical stress, fracture, and performance loss in LMO and other electrode materials for improved design of both conventional and all-solid-state batteries.
Acknowledgments
We gratefully acknowledge support from the US Department of Energy's Office of Basic Energy Science for the Chemomechanics of Far-From-Equilibrium Interfaces (COFFEI) small group, through award number DE-SC0002633 (J. Vetrano, Program Manager). This work made use of the Shared Experimental Facilities supported in part by the MRSEC Program of the National Science Foundation under award number DMR-1419807. F. P. McGrogan also acknowledges the MIT Martin Fellowship for Sustainability. We also thank Sean R. Bishop for helpful discussions related to this work.
ORCID
Frank P. McGrogan 0000-0002-6130-7861
Krystyn J. Van Vliet 0000-0001-5735-0560