Abstract
PVA brush scrubbing techniques are widely used in cleaning processes for semiconductor device manufacturing. These cleaning processes are typically monitored by measuring the forces or torques generated during PVA brush scrubbing. In this paper, we discuss whether these measured parameters reflect the real contact conditions during scrubbing. We measured the shear forces generated by brush sliding. The shear forces were strongly correlated with brush deformation. In addition, brush rotation greatly suppressed brush deformation and shear force. This result indicates that a portion of the shear force was generated by brush deformation and not contact conditions. We also measured the torque generated by the PVA brush rotation on a surface. We concluded that these types of measurements, which reduced brush deformations, were suitable for evaluating contact conditions.
Export citation and abstract BibTeX RIS

This is an open access article distributed under the terms of the Creative Commons Attribution Non-Commercial No Derivatives 4.0 License (CC BY-NC-ND, http://creativecommons.org/licenses/by-nc-nd/4.0/), which permits non-commercial reuse, distribution, and reproduction in any medium, provided the original work is not changed in any way and is properly cited. For permission for commercial reuse, please email: oa@electrochem.org.
Poly vinyl acetal (PVA) brushes are made of soft polymer materials and have a sponge-like structure. These brushes are hydrophilic and can absorb a significant amount of water because of their molecular structure and capillary action. These brushes have been used in cleaning processes for semiconductor device manufacturing. After the planarization process (i.e., during post chemical mechanical polishing (CMP) cleaning), PVA brushes are widely used.1,2
Two types of uniquely shaped PVA brushes are used in post-CMP cleaning: roller types and pencil types. The designs of roller type brushes are composed of many convex shapes, called nodules—a wide variety of nodule shapes have been proposed.3–7 These nodules play an important role in uniform force scrubbing.8–10 Pencil type brushes are used for traversing,11,12 and in some cases have added rotation.13
Recently, semiconductor devices have developed significantly. In addition to scaling down, many such devices have three-dimensional structures, making CMP processes significant.14 Additionally, cleaning requirements have increased. For example, cross-contamination15 and particle generation16 due to PVA brush scrubbing have been reported. To solve this problem, surface treatments have been proposed for PVA brushes, such as zeta potential control7,17 and partial skin layer removal.18 Here, the skin layer is the dense surface layer that is typically generated in production processes using molds.19 Some patents have claimed that this skin layer caused scratching.17
Some ideas for efficiency cleaning have been proposed, as mentioned above. However, the main cleaning mechanism is still under discussion.20–29 Proposed impurity removal mechanisms are divided mainly into techniques involving brush attachments,20–23 fluid lubrication24,25,30–33 or mixed methods.27–29,34 As a result, many researchers have investigated contact conditions (i.e., lubrication states13,35). Unfortunately, these micro scale phenomena are difficult to monitor directly in real time. Instead, other parameters are measured, such as the normal force or torque generated during PVA brush scrubbing. Some researchers have claimed that high friction conditions correspond to large cleaning forces.7 Additionally, techniques for keeping friction at constant levels have been proposed to control cleaning conditions.36 In contrast, other researchers have reported that there is no correlation between frictional force and cleaning performance.21
In this study, we discuss shear force generation mechanisms. In an earlier study, we showed that shear force was strongly influenced by surface plate wettability, and that shear force decreased with increasing sliding speed. In addition, stick-slip phenomena were observed.37 We also estimated the thickness of liquid film between brush and surface with the assumption that the shear force was generated by viscosity of fluid. The estimated value was less than 1 nm. These results suggested that the contact condition of the PVA roller brush is external to the fluid lubrication regime, and these can be seen in a general friction system that has a small dynamic friction rather than static friction coefficients. These conditions can be explained by the increase in real contact area. However, when a brush with a relatively large shape slides on a surface, shear force increases with increasing traverse speed.38 We systematically conducted sliding experiments and assessed whether shear forces truly reflect contact conditions. We showed that deformation-induced friction becomes dominant when a relatively large brush is used for scrubbing.
Experimental Apparatus and Method
In this study, we used different sizes of cylinder-shaped PVA brushes. The pore size of the dried PVA brush is around 150 μm. In addition, we compared brushes with or without a skin layer. We labeled each brush from Type A to Type D depending according to their skin layer configurations or the directions of their contact faces. Figure 1 depicts the four types of PVA brush and a SEM image of PVA brush. The skin layers are drawn thickly in this image to illustrate their location—note that a typical skin layer thickness is on the order of micrometers. Type-A brushes have a skin layer on both the contact area and side face. Type-B brushes have a skin layer on the side face. Type-C and type-D brushes do not have skin layers. We used a type-D brush having a larger contact area than a type-C brush to investigate the effects of brush size. All brushes were soaked in ultrapure water or chemical solutions before experimentation. Note that the brushes were soaked in the same chemical solution as in the liquid of experimental container.

Figure 1. PVA brushes, (a) Four types of PVA brushes, (b) SEM image.
We performed three types of experiments, measuring normal forces, shear forces, and torque. Each experiment was conducted as follows:
Normal force measurement
In an earlier study, we found that PVA brushes have viscoelastic properties. We demonstrated the high normal forces that are generated at high compression speeds.39 Here, we focused on the compression direction (i.e., the compression or release process). Figure 2 shows a schematic of the experimental set up. In this experiment, we compressed the PVA brush to 4 mm and measured normal forces every 0.5 mm. After reaching 4 mm, we released the compression. We measured the force immediately after compression and after 1 min. We filled the container with ultra-pure water up to half of the height of the container, to prevent the brush from drying during measurements.
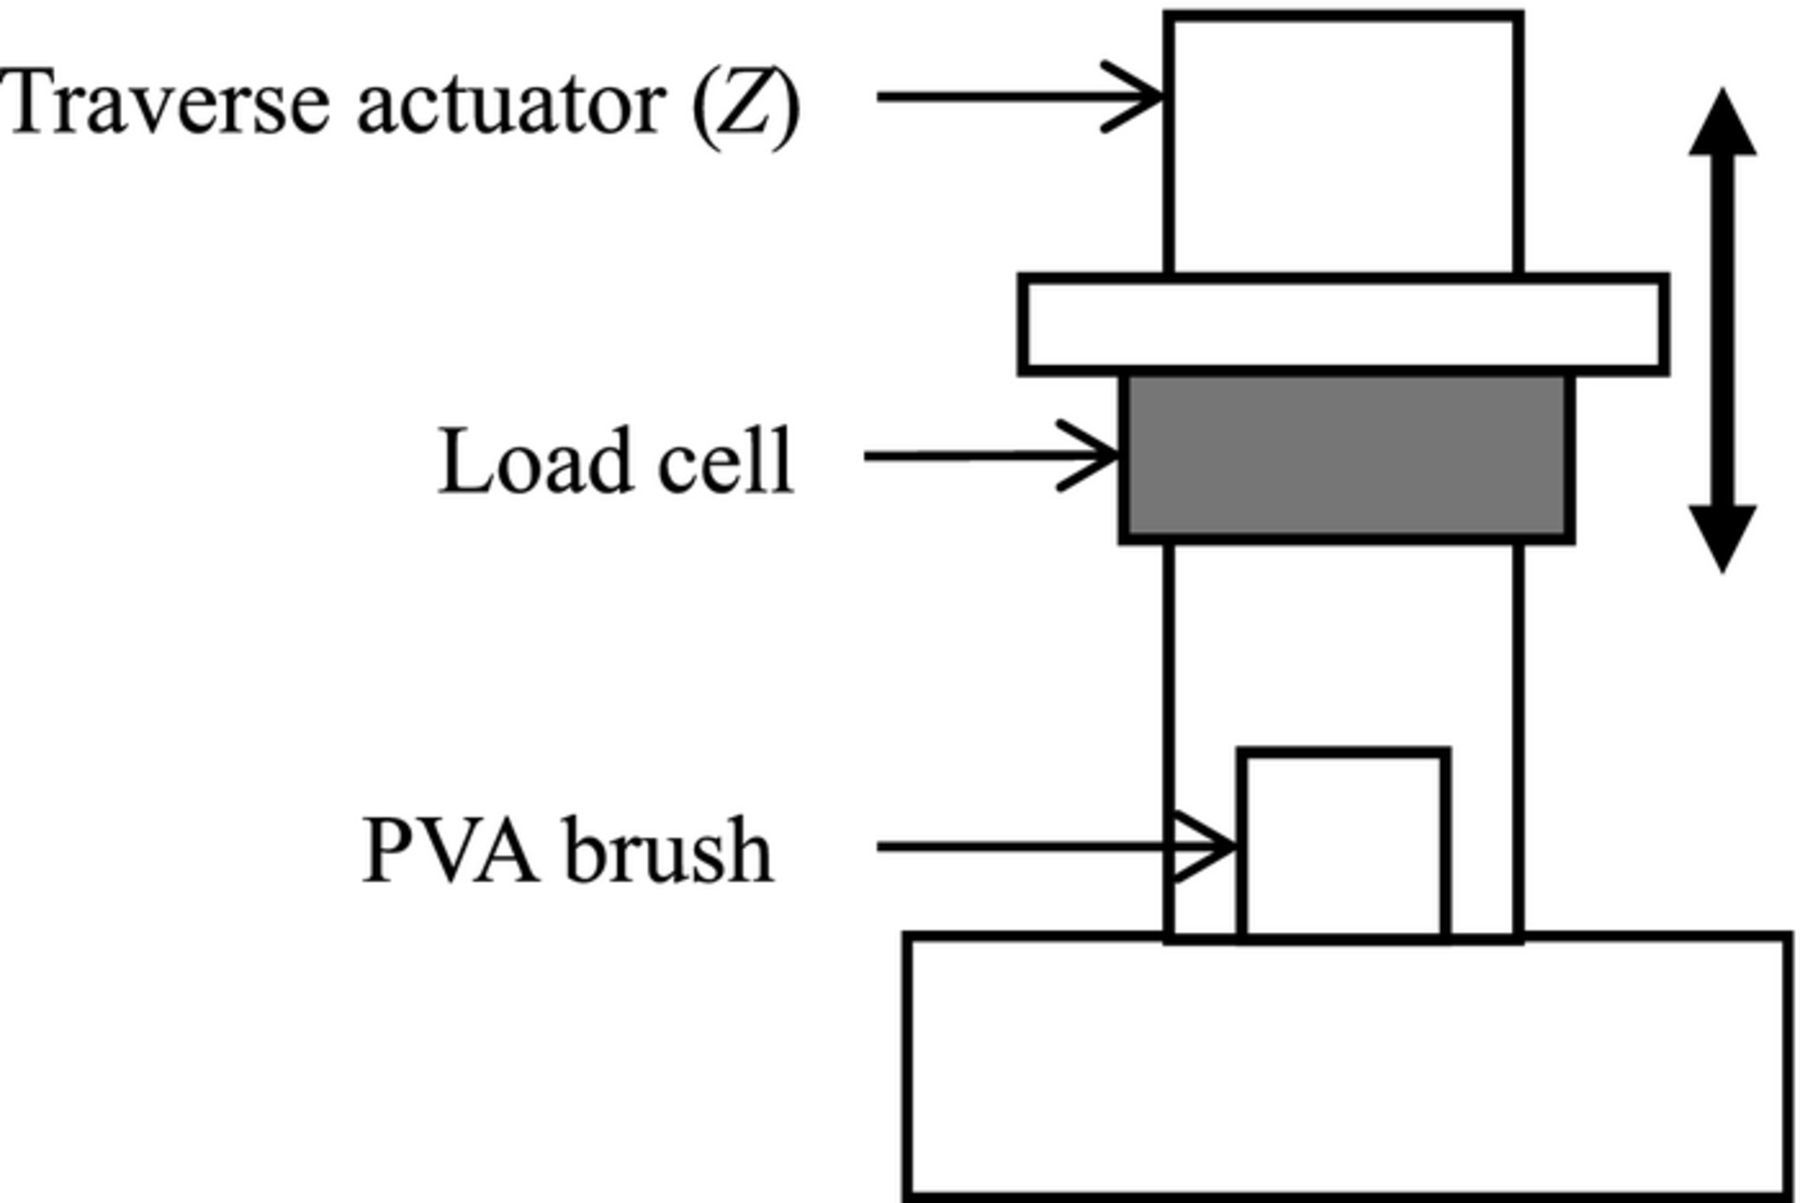
Figure 2. Experimental set up for normal force measurement.
Shear force measurement
Figure 3 shows a schematic of the experimental setup for shear force measurements. The shear forces (Fs) generated by sliding the PVA brushes on a plate were measured with a load cell (MRD-10 N, A&D Company). The brush was slid after 60 s compressing the brush in order to reduce the viscoelastic effects on normal force. The natural frequency of the load cell was 17 kHz, so that the load cell would be sufficiently responsive. Type-A, type-B, and type-C brushes were used to investigate the effects a skin layer for shear force. The plate materials were glass, polymethylmethacrylate (PMMA), and polytetrafluoroethylene (PTFE). The corresponding contact angles (θ) to water for each surface were 28°, 61°, and 97°, respectively. The sliding speed V was varied from 1 to 50 mm/s, and the brush compression distance d was varied from 1 to 3 mm. To investigate the effects of brush rotation, we measured the shear forces of sliding brushes rotating on a PMMA plate. In this case, the brushes were rotated about an axis vertical to the plate. Type-D brushes were also used in this experiment. The brush rotation speed n was varied from 0 to 150 rpm, the sliding speed V was varied from 10 to 100 mm/s, and the compression distance d was fixed at 1 mm. Brush deformation during brush sliding was also observed at both the side and bottom using a high-speed video camera. A mirror was used to observe from the bottom.
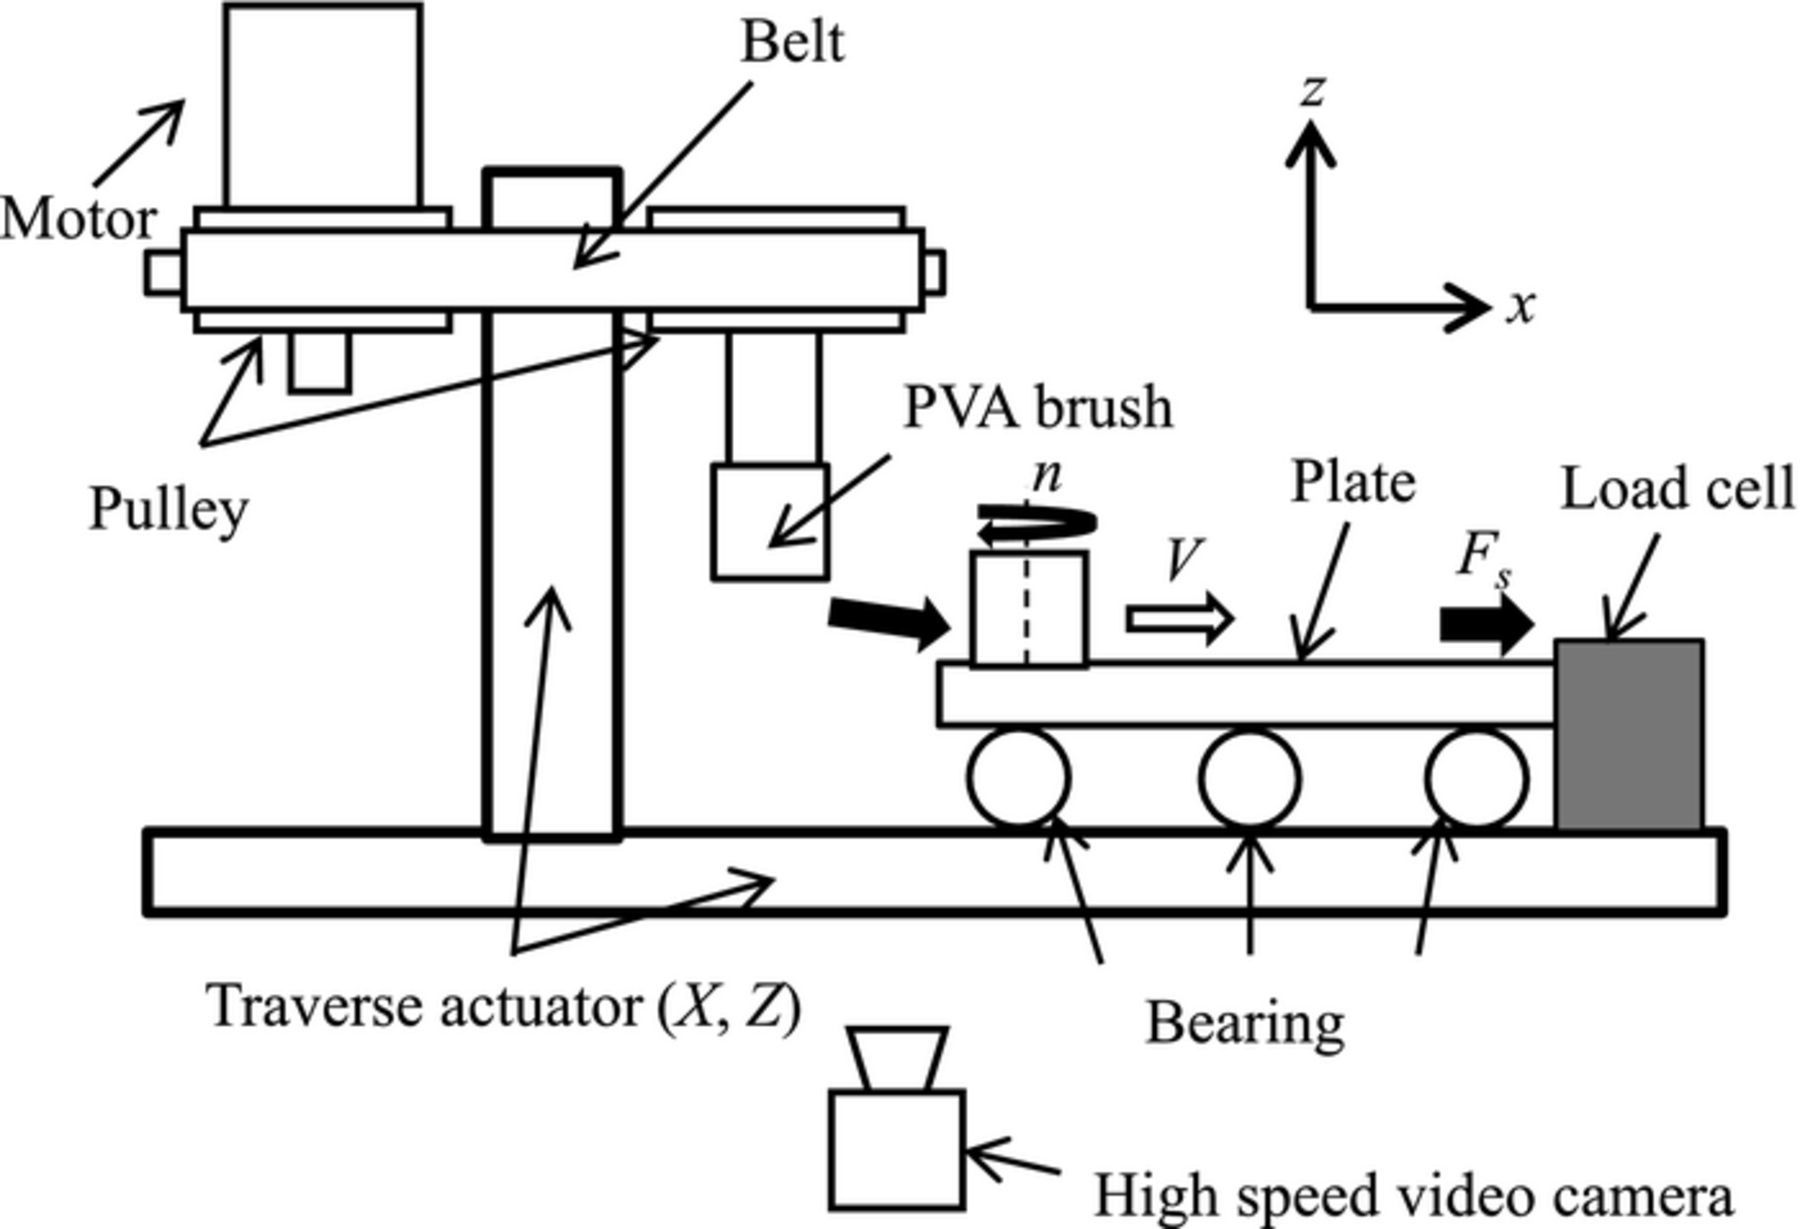
Figure 3. Experimental set up for shear force measurement.
Torque measurement
Figure 4 shows a schematic of the experimental set up for torque measurements. In this experiment, we measured the torque T generated by a brush rotating on test pieces. Using this setup, we can almost neglect brush deformation effects and evaluate the friction from the direct contact between the brushes and surfaces. The torque T was measured with a torque meter (UTM II-0.05, Unipluse Corporation) attached to the rotating shaft. We used several plates and semiconductor wafers with films as test samples. The films were SiO2, SiOC, SiN, Cu, and W. The test pieces were fixed to the containers. In the experiments, the containers were filled with chemical solutions composed of ultra-pure water (UPW), a citric acid aqueous solution (CA, 23%, pH = 2), and ammonium hydroxide (NH4OH, 0.5%, pH = 11.4). Torque measurements were started when the torque value stabilized. There is a relaxation process of normal forces because of viscoelasticity effects. We only used a type-D brush in this experiment, because the type-D brush had a large contact area and showed large differences in T, depending on the plate material.
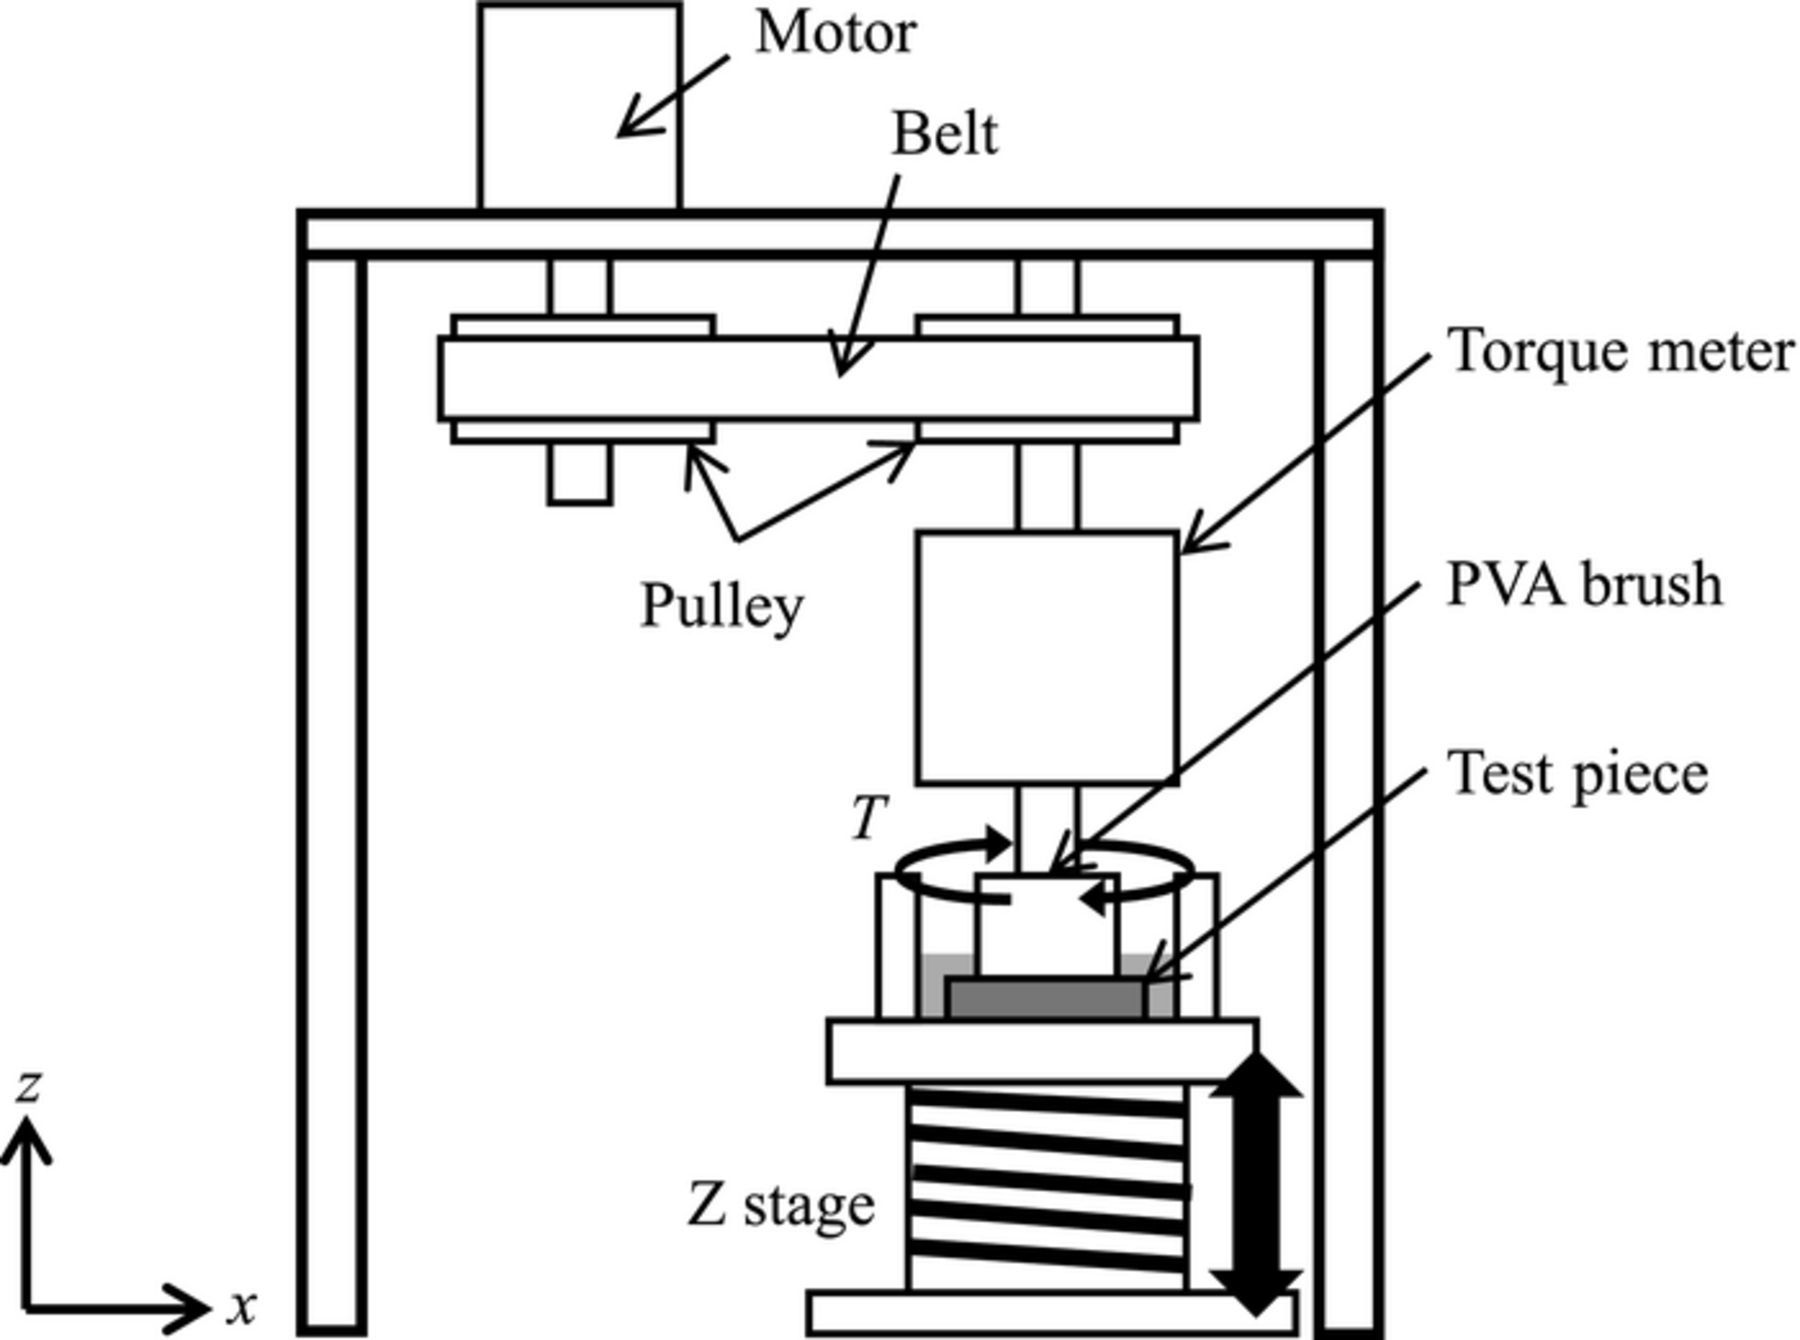
Figure 4. Experimental set up for torque measurement.
Results and Discussion
Normal force measurement
Figure 5 shows the normal force (Fn) as a function of brush compression distance d. Fn increased with increasing d. However, the compression and release processes produce different Fn values, despite having the same compression distance (i.e. hysteresis loop). Because of the viscoelasticity of the PVA brushes, Fn decreased after 60 s in the compression process. This approximately 6% reduction occurred because of relaxation. In contrast, Fn increased after 60 s in the release process, and the relaxed values did not change after several minutes. This result indicates that it is difficult to keep the compression conditions constant by monitoring normal force or compression distance, because normal force is dependent on compression history. Therefore, the control of brush compression distance was the only compression process conducted in this study.
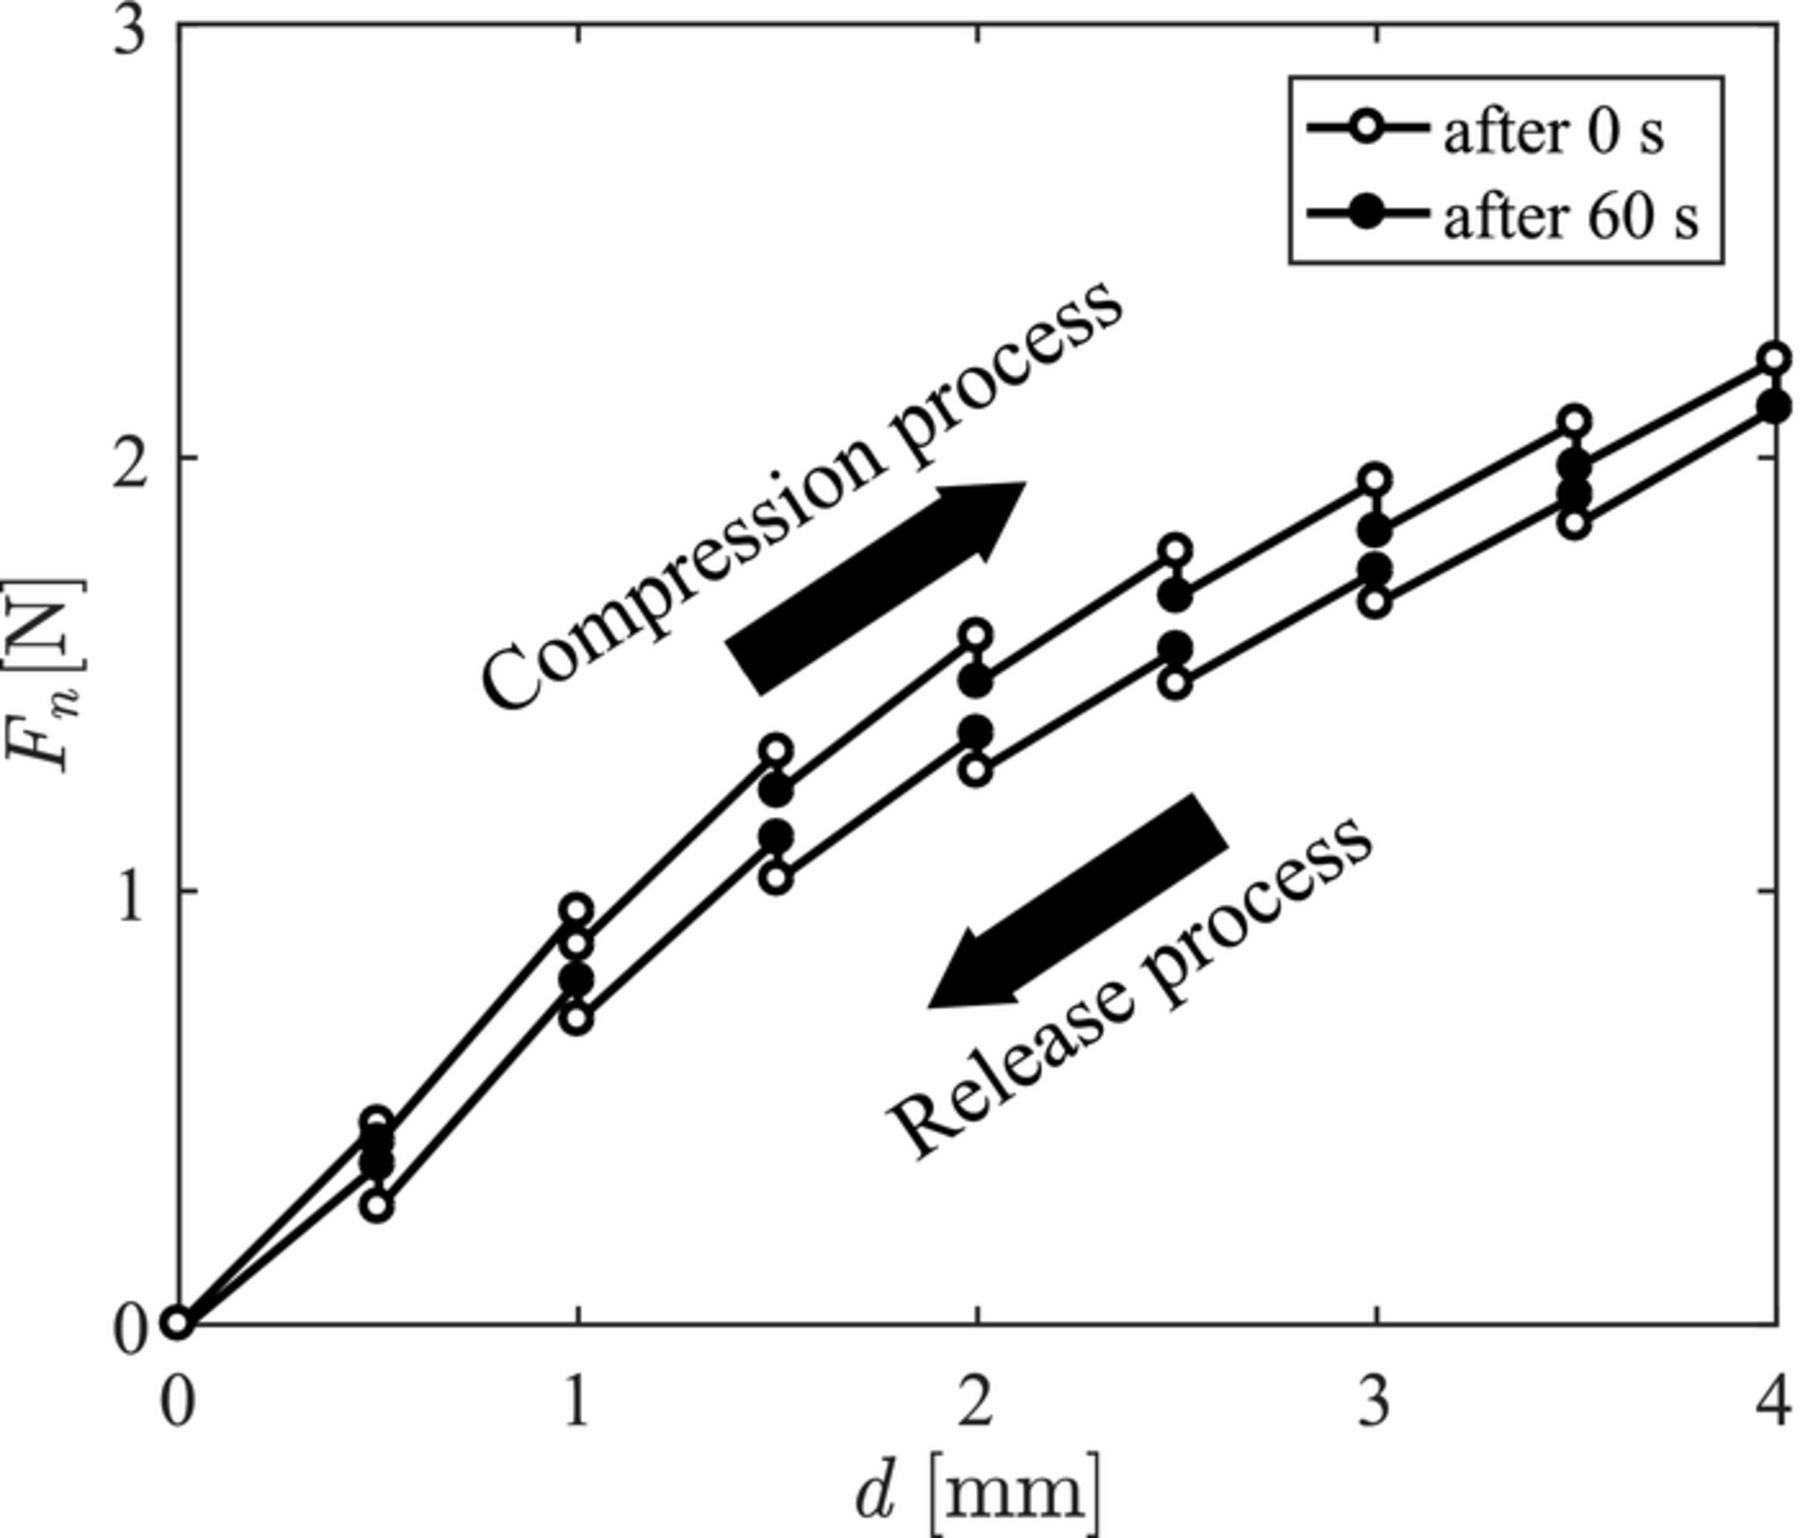
Figure 5. Normal force Fn as a function of brush compression distance d under compression and release processes.
Shear force measurement test
First, the PVA brush was accelerated during sliding to ascertain reproducibility how the sliding speed V depends on shear forces Fs. This is because the shear forces are greatly depending on the individual differences of brushes and how to attach the brush to a holder. Figures 6 and 7 show a time series of Fs on a PMMA plate. As shown in Figs. 6a, 6b, and 6c, Fs increased with increasing V for all brush types when V was increase from 1 to 10 mm/s. For further increases in V from 10 to 50 mm/s, Fs either increased or was unchanged, as shown in Figs. 7b and 7d. However, Fs decreased with increasing V in the case of a type-A brush, which has a skin layer on the contact surface, as shown in the Fig. 7a. These results indicate that the dependence of sliding speed on shear force was affected by the existence of a skin layer on the contact surface.
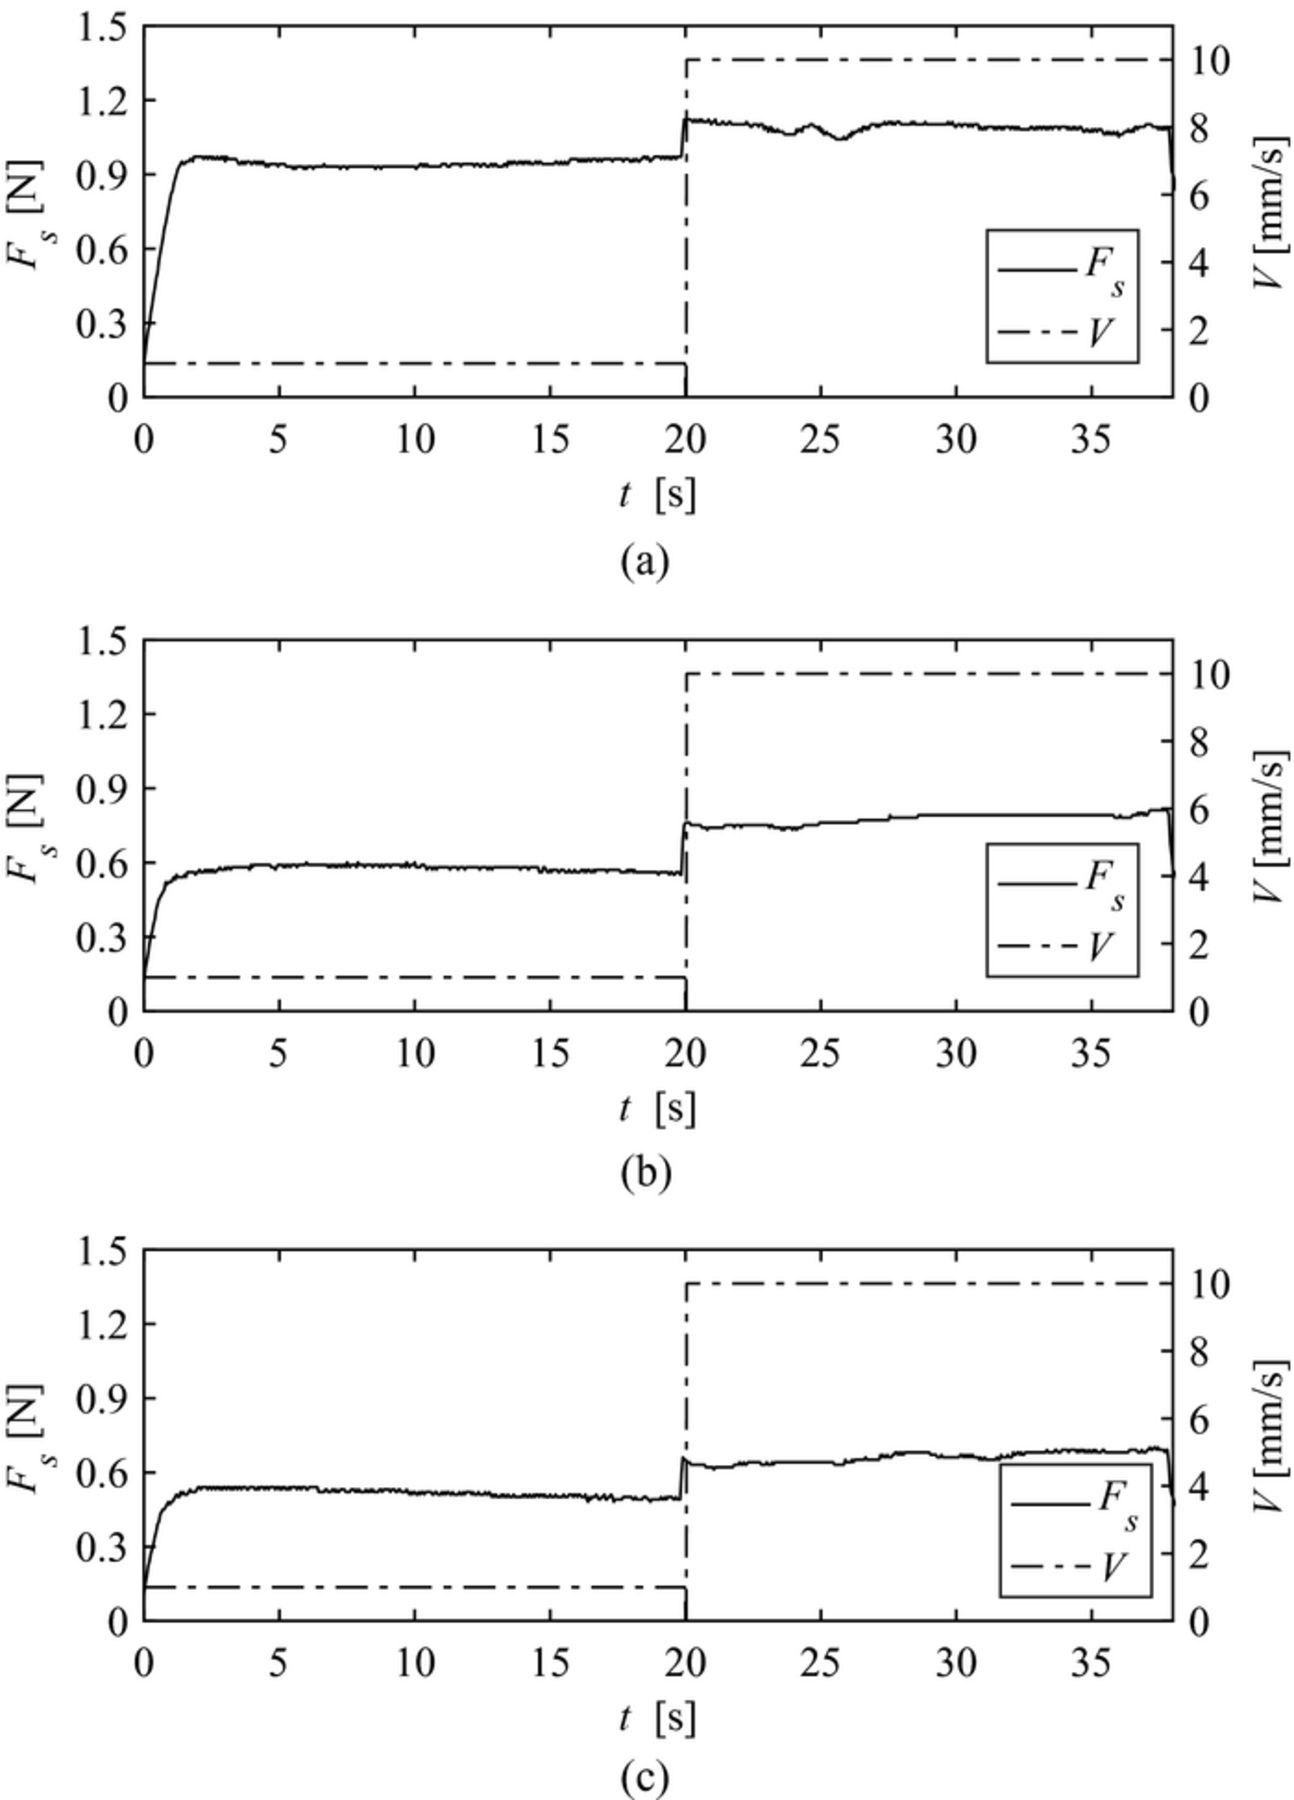
Figure 6. Dependence of sliding speed V on shear force Fs for a PMMA plate from V = 1 to 10 mm/s, (a) Type-A, (b) Type-B, and (c) Type-C.
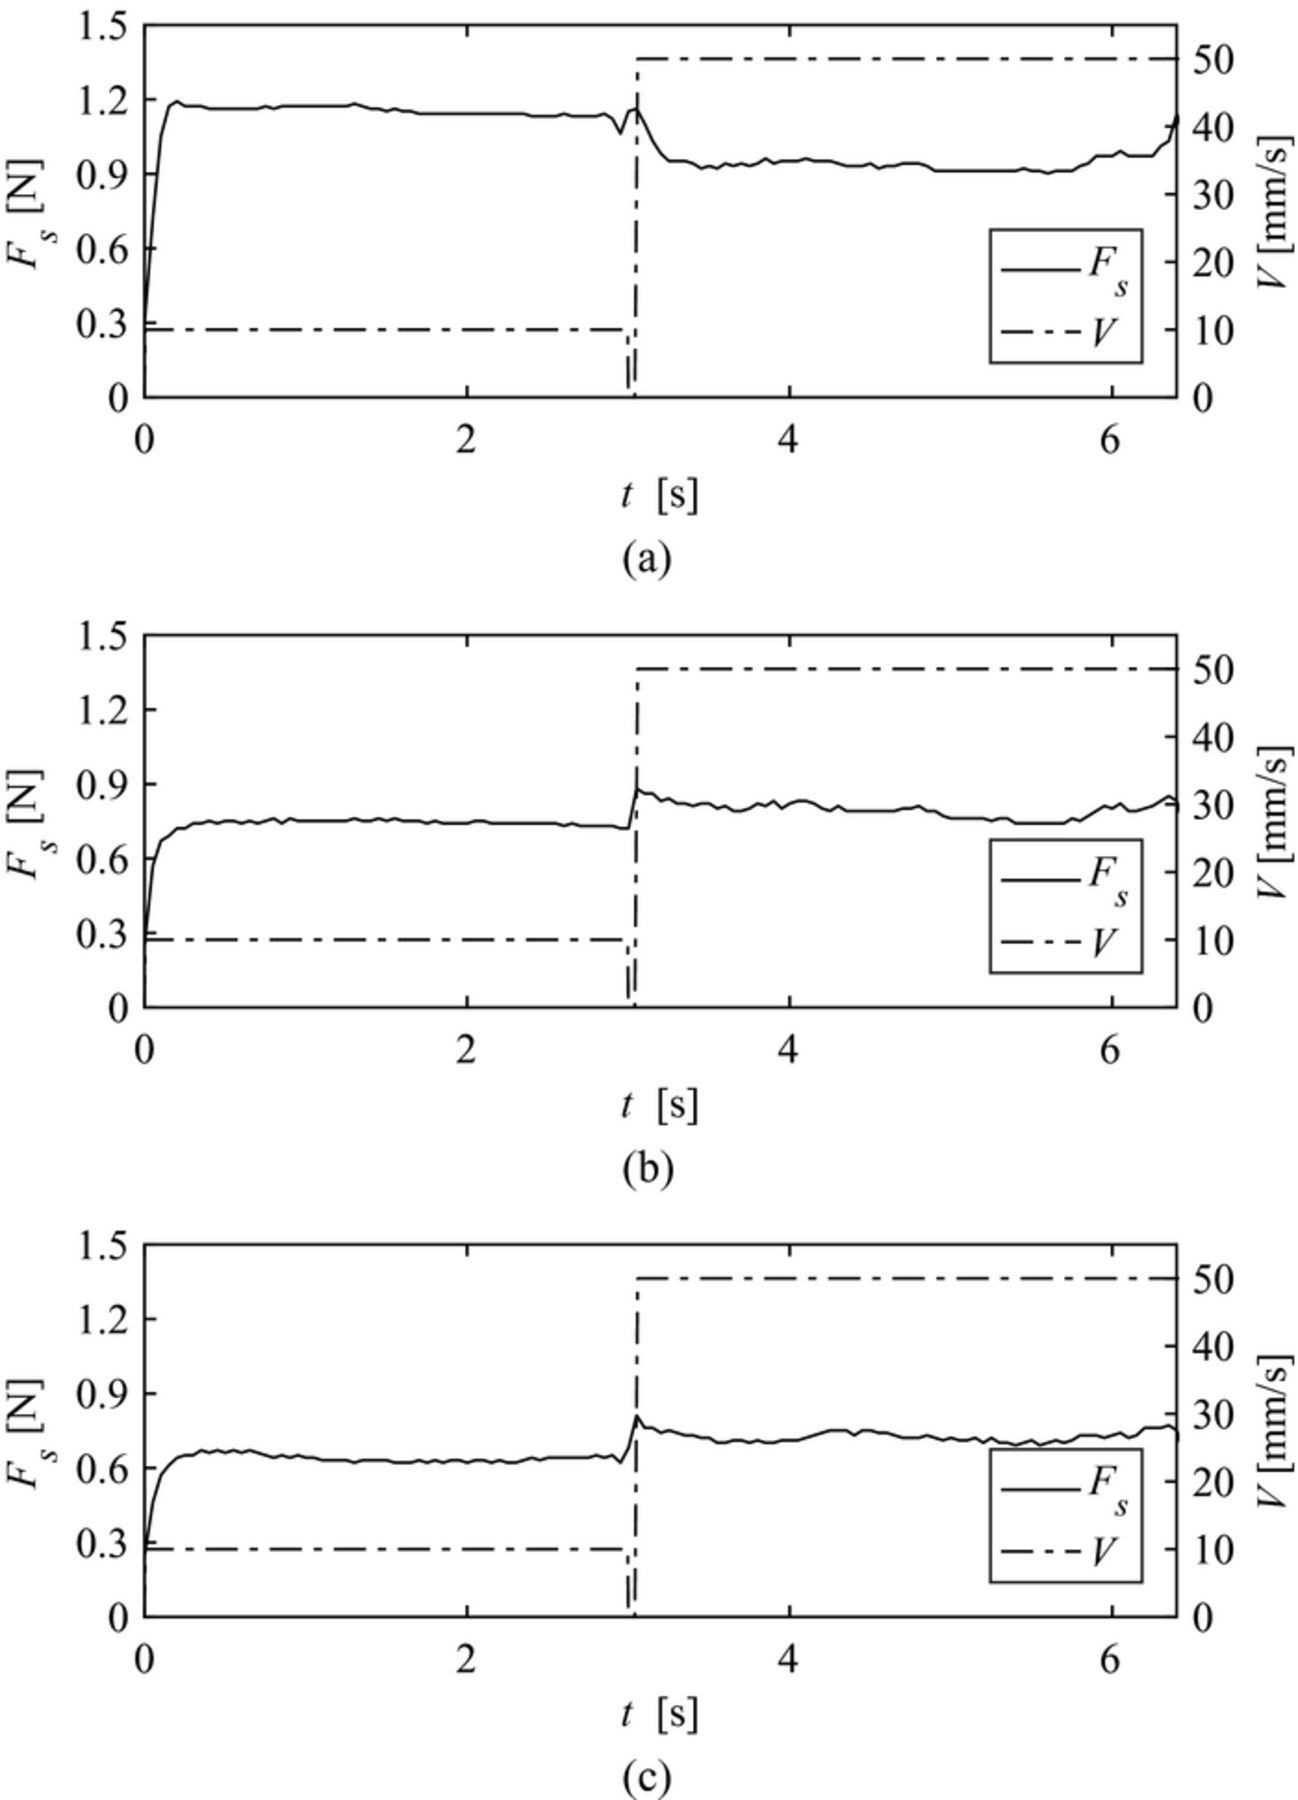
Figure 7. Dependence of sliding speed V on shear force Fs for a PMMA plate from V = 10 to 50 mm/s, (a) Type-A, (b) Type-B, and (c) Type-C.
Next, we compare time-averaged shear forces  on a different plate. Figure 8 shows
  as a function of brush sliding speed V. As shown in Fig. 8a, there were no significant differences in the
  value of the type-A brush for all materials. In contrast, the
  value of the type-B and C brushes for PTFE were smaller than those for PMMA and glass, as shown in Figs. 8b and 8c. Additionally, there was no correlation between shear force and surface wettability.

Figure 8. Time averaged shear forces  on a different plate as a function of sliding speed V, (a) Type-A, (b) Type-B, and (c) Type-C.
With the exception of the large sliding speed case for type A,  increased with increasing V. These tendencies in wettability and sliding speed dependence were perfectly different from the results of our earlier study using PVA roller brushes, which had skin layers. Hara et al. showed that the shear forces decreased with increasing rotation speeds and that they were highly dependent on surface wettability. However, their other results show the shear force generated by single nodule sliding were not influenced by surface wettability.37 We consider that these results are due to the reduction of apparent contact area because of the large brush deformation. Moreover, this speed dependence is somewhat unusual, even when we consider basic friction principles. The frictional force should decrease when the object begins to move because the static friction coefficient is smaller than the dynamic friction coefficient in the general friction system. However, we showed shear force at the beginning of motion was constant. And the shear forces increased with the increasing the sliding speed. These results suggest that the dynamic friction is larger than the static friction.
In addition, the  value for type-A was larger than that for type-B and type-C. Additionally,
  was approximately the same for type-B and type-C. These results indicate that the shear force values depended on the skin layer on the contact area, but not the side.
Figure 9 show the observation results for sliding the brush from the side with a high-speed video camera. Figure 9a, 9b, and 9c show the different brush types (d = 1 mm). Figures 9i shows the compressed brushes before sliding, and (ii), and (iii) show the brush shapes for 10 mm/s and 50 mm/s, respectively. As shown in Fig. 9i, the shape of the brush prior to sliding was slightly trapezoidal, because the bottom area of the brush was increased by brush compression. With increases in sliding speed, the brushes were greatly deformed. We measured brush deformation angles (θ) from observation images to estimate the amount of brush deformation. The value of θ for V = 50 mm/s (about 40°) was larger than that at 10 mm/s (about 30°) for all brush types.

Figure 9. Compressed (d = 1 mm) and sliding shapes for PVA brushes, (a) Type-A, (b) Type-B, and (c) Type-C. Frames represent (i) before sliding, (ii) V = 10 mm/s, and (iii) V = 50 mm/s.
Furthermore, we observed the brushes from the bottom. From the observation results and Fig. 9, the PVA brush was sliding after the brush holder moved. In other words, initially, the PVA brush adhered to the surface. See supplementary material for videos corresponding to Figs. 9a-9c and for videos showing the brush from bottom view at the start to the sliding.
The brush sliding experiments showed that when a skin layer was present on the contact surface, shear forces depended on sliding speeds. The brushes having a skin layer showed large shear forces. Additionally, brush deformation increased with increasing brush sliding speed. The shear forces were also large when the sliding speeds increased. Next, we focus on brush deformation and the existence of a skin layer.
First, we discuss brush deformation. Initially the brush adhered to the surface, then slid. If we assume that the brush shape was a trapezoidal, then the front part of the brush was more compressed, and the local compression distance increased, as shown in Fig. 10. In contrast, the rear part of the brush was released from loading because it was stretched. Finally, the load at the rear part of the brush became 0, and the brush separated from the surface, as shown in Fig. 9.
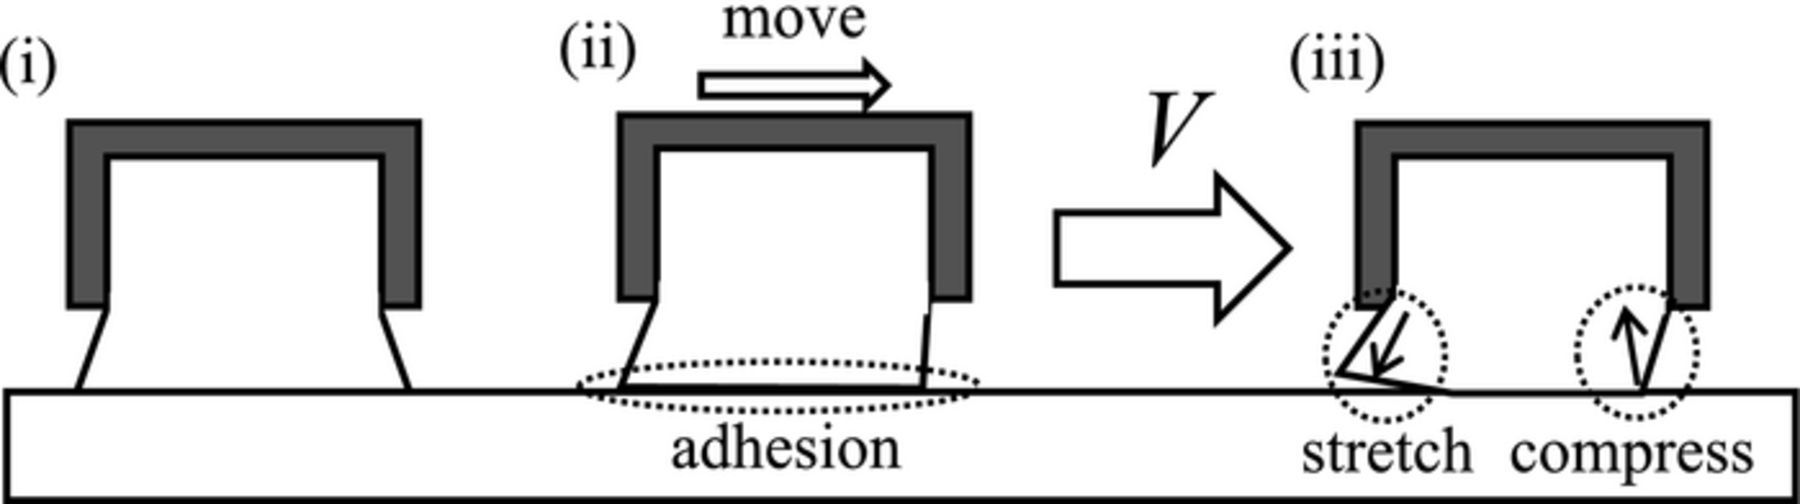
Figure 10. Shear force produced by brush deformation. Trapezoidal-to-parallelogram shape deformation induces local compression concentrations.
Second, we discuss how shear forces depend on sliding speeds. In terms of overall tendencies, the brush deformation angle increased with increasing brush sliding speed. Generally, shear forces increased with increasing normal forces. Therefore, when a larger local compression concentration region occurs in the front part created, larger shear forces and deformations were observed. These types of deformation-induced friction are observed for soft materials such as rubber, and are called hysteresis friction.
As shown in Fig. 8, the  value of type A was larger than that of types B and C. This means that the real contact area for type-A was larger than that for type-B because type-A has a skin layer with a lower porosity layer. Therefore, as shown in Fig. 6a, shear force decreased with increasing sliding speed for type-A, because the decrease in the adhesion term was larger than the increase in the hysteresis term. In contrast, the real contact areas of type-B and type-C were smaller than that of type A, because the contact surfaces were covered in a higher-porosity layer. In brief, the magnitude correlation between the two terms determined the contribution of each term to the overall shear force.
We considered the shear force of the sliding deformable brush to be generated in a high normal load region at the front part of the brush, as mentioned above. Hence, we predicted that shear force was reduced with the brush rotation because brush deformation was suppressed. Figure 11 shows the time-averaged shear force value  as a function of brush rotation speed n.
  decreased with increasing n for all brush types. The tendencies of these decreases depended on the sliding speeds V. For brush types A, and B,
  showed a steep decline at low n values when V = 10 mm/s. In contrast,
  remained almost constant at n values below 100 rpm when V = 50 mm/s. For a type-D brush,
  gradually decreased with increasing n when V = 100 mm/s. These results indicated that brush size affected the relationship between rotation speed and sliding speed.
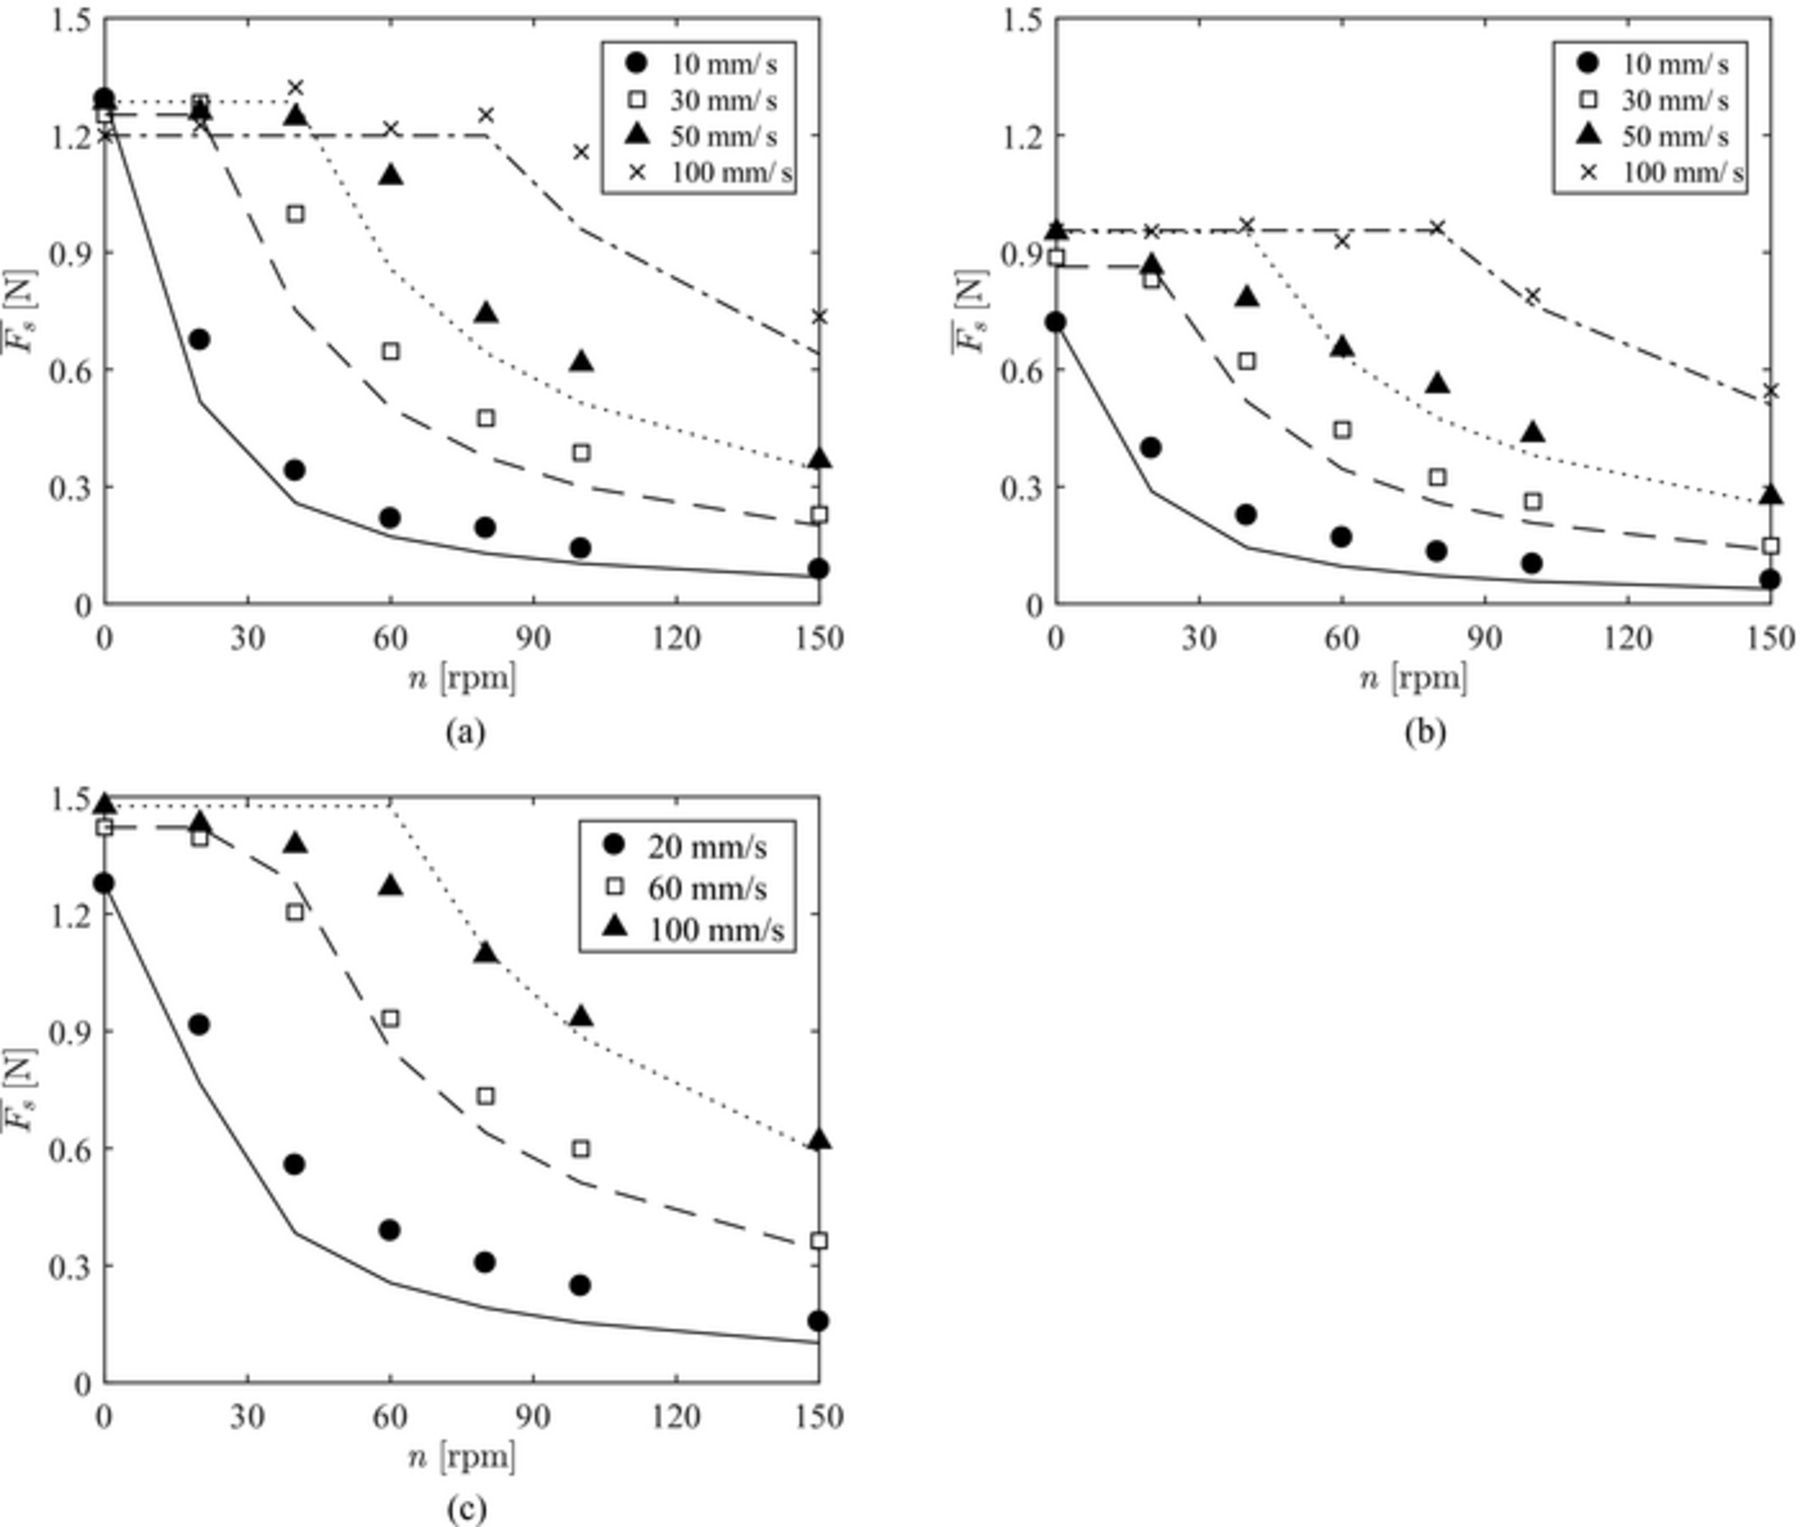
Figure 11. Time-averaged shear forces  as a function of sliding speed V and rotation n, (a) Type-A, (b) Type-B, and (c) Type-D.
Figure 12 shows the observation results for sliding brush shape with rotation. For V = 10 mm/s, brush deformation was suppressed at n = 40 rpm. By increasing sliding speed V = 50 mm/s, brush deformation was not suppressed at the same rotation. When the rotation speed was increased further to 100 rpm, deformation was again suppressed. From these results, both shear force and brush deformation were suppressed with brush rotation. Additionally, brush rotation effects declined with increases in brush sliding speeds. Moreover, these results indicated that brush deformation was an index of shear force. Hence, we predicted that the shear force can be estimated from the relationship between the amount of brush deformation and the brush rotation speed. See supplementary material for movies corresponding to Figs. 12a–12c showing the sliding brush.
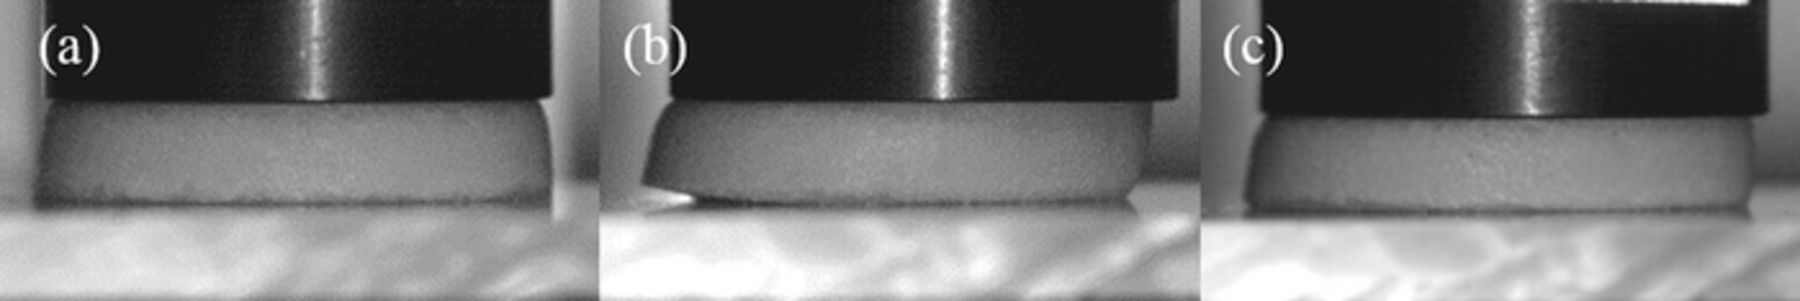
Figure 12. Deformation suppression with brush rotation for Type-A brush, (a) V = 10 mm/s, n = 40 rpm, (b) V = 50 mm/s, n = 40 rpm (c) V = 50 mm/s, n = 100 rpm. Brush deformation was reduced by this rotation.
We demonstrated that a simple model could predict how brush rotation reduces shear force. First, we estimated the starting time for brush sliding, using results observed from the bottom of the brush. The time until the brush slides ts is given as
![Equation ([1])](https://content.cld.iop.org/journals/2162-8777/7/4/P201/revision1/d0001.gif)
Where m is the travel distance for the traverse actuator before the brush slides. Here, in the case of type-A, type-B and type-C, m was approximately 1.5 mm. Next, we assume that this deformed brush was rotated. Then shear force in the x direction Fsx is decreased. As a result, the deformation direction is also shifted. For example, if the brush was rotated 90°, Fsx should be zero as shown in Fig. 13. Note that we measured the shear forces for sliding direction. The time until the brush rotated 90° tr is given as
![Equation ([2])](https://content.cld.iop.org/journals/2162-8777/7/4/P201/revision1/d0002.gif)
Then, the ratio of the two times tr and ts is defined as η.
![Equation ([3])](https://content.cld.iop.org/journals/2162-8777/7/4/P201/revision1/d0003.gif)
η is an index of brush deformation magnitude. In the case of large η, the shear force is large because the brush deformation grows enough to start sliding before the brush deformation suppressed by brush rotation. On the other hands, in the case of small η, the deformation of the brush is suppressed by the brush rotation before the deformation increases. So, the shear force is small.
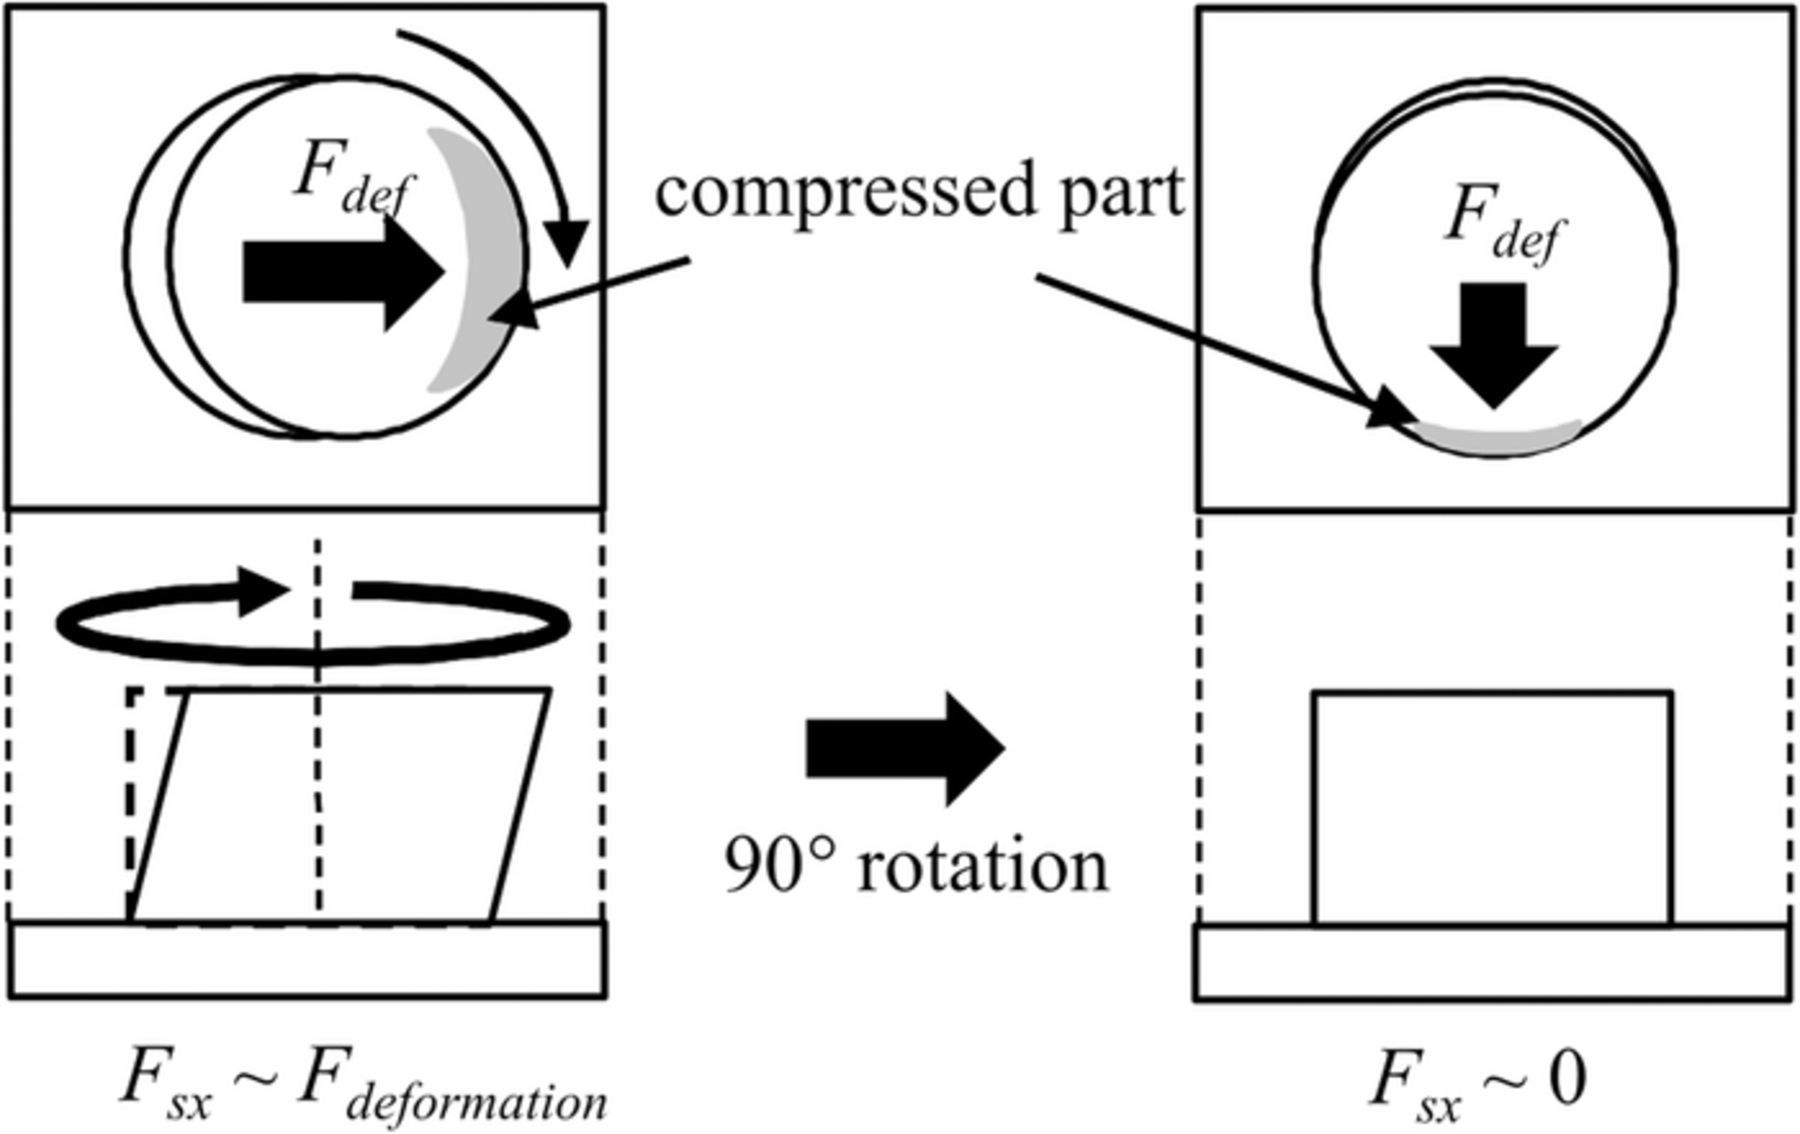
Figure 13. Effect of brush rotation on the x direction force. The deformation induced share force Fdef is suppressed and shifted with the brush rotation.
There is a limit to the amount of brush deformations, so there is also an upper limit on the η value. The upper limit on η is defined ηc. We define ηc as the point at which shear forces do not change, even for brush rotation. Hence, when ηc > η, brush deformation is not reduced by rotation. Here, we selected ηc from our shear force measurement results. We explain the definition of ηc using the results for type-A. As shown in Fig. 11a, the shear forces up to n < 40 rpm were approximately the same for a no-brush-rotation condition at V = 50 mm/s. Above n = 50 rpm, shear forces were decreasing by rotation. Therefore, the η value for V = 50 mm/s and n = 40 rpm was defined as ηc.
From the above definitions, shear forces were estimated from η values. Fs was proportional to η and defined as
![Equation ([4])](https://content.cld.iop.org/journals/2162-8777/7/4/P201/revision1/d0004.gif)
Here, Fs0 is shear force without brush rotation. If η was larger than ηc, Fs would have the same value for a no-brush-rotation condition.
In Fig. 11, we also plotted the model predictions. The shear force model well reproduced the experimental results for all brush types. Therefore, for the present study, we conclude that the deformation state of a brush can be calculated from shear force. We not evaluate the contact conditions (i.e., the combination of materials). Next, to evaluate the contact conditions between PVA brushes and several plates for low deformation conditions, we measured the torque T generated by brush rotation on test pieces.
Torque measurements
In our final set of experiments, we investigated the torque generated by PVA brush rotations on a plate. In this setup, brush deformations were small and only a twisted mode was used. Additionally, we could ignore the local deformation-induced concentrations observed in sliding experiments. Therefore, we can evaluate friction according to the real contact area.
Figure 14 shows an example of torque T when a type-D brush was used on different plates or films in chemical solutions. For cases using citric acid aqueous solution (CA) and ultrapure water (UPW), T decreased with increasing brush rotation speeds n, for all cases except W film and PTFE plates. We believe that this was due to the real contact area, as discussed in sliding experiments. These results match those in our earlier study.37

Figure 14. Torque measurements on a plate and films using type-D brush with d = 1 mm, (a) several plates with UPW, (b) CA, (c) UPW, and (d) NH4OH.
Next, we focus on T for NH4OH. The torques on SiO2 and SiOC were lower in NH4OH than in UPW. These results are also in good agreement with those of earlier studies regarding roller-type brushes with skin layers by Philipossian et al.40 and Nishio et al.41 This is because Si based films are dissolved in high pH chemicals. The dissolved surface plays a role in lubrication. Hence, NH4OH showed low torques. T values were large on a Cu film. These results are the same as those by Nishio et al.41 These results may have occurred because of a nascent exposed Cu surface, which was highly active.
In all liquids, T values for W film were independent of n. We believe that this occurred because of the high surface energy of W. However, this was not clear at the present stage. As shown in the torque measurements, clear differences appeared for different combinations of liquids and surface films. From these results, we conclude that torque measurements are a suitable experiment for evaluating contact conditions.
Conclusions
To discuss the effects of PVA brush deformation on scrubbing, we measured the normal and shear forces for brush compression and sliding, respectively. Experiments were performed on a plate using different brush sizes and different surfaces.
The normal forces showed time dependency, and different values were observed between the compression and release process, even after relaxation times of several minutes, despite having the same compression distance.
The shear forces depending on brush deformation and the existence of a skin layer on the brush surface. The shear forces decrease with increasing sliding speeds when the brush deformations were large. This phenomenon was more likely to occur when a PVA brush with a skin layer was used. In contrast, shear forces increased with increasing sliding speeds when brush deformations were large. In that case, we consider that brush deformations increased normal forces locally. Then, large shear forces were generated. Therefore, brush rotation suppressed shear force. We used a simple model to demonstrate that shear forces were estimated from the relationship between brush rotation and brush deformation. This result indicates that a portion of overall shear force was generated by brush deformation.
Finally, we measured the torque during brush rotation on several plates under low deformation conditions. In many cases, torque decreased with increasing brush revolution speed. Some combinations of film and chemicals, such as Cu film and NH4OH, exhibited different tendencies. However, these tendencies were same as those observed in earlier studies on roller type brushes with skin layers.
As a final remark, the normal and shear forces with brush deformation are inadequate parameters for evaluating contact conditions. Care is therefore needed while monitoring cleaning conditions using normal or shear forces.
Acknowledgments
The authors thank Dr. Shohei Shima, Dr. Chikako Takatoh, and Dr. Satomi Hamada of Ebara Corporation for their fruitful discussions.
ORCID
T. Sanada 0000-0003-4636-8364