Abstract
The electrochemical behavior of a promising hydrogen/bromine redox flow battery is investigated for grid-scale energy-storage application with some of the best redox-flow-battery performance results to date, including a peak power of 1.4 W/cm2 and a 91% voltaic efficiency at 0.4 W/cm2 constant-power operation. The kinetics of bromine on various materials is discussed, with both rotating-disk-electrode and cell studies demonstrating that a carbon porous electrode for the bromine reaction can conduct platinum-comparable performance as long as sufficient surface area is realized. The effect of flow-cell designs and operating temperature is examined, and ohmic and mass-transfer losses are decreased by utilizing a flow-through electrode design and increasing cell temperature. Charge/discharge and discharge-rate tests also reveal that this system has highly reversible behavior and good rate capability.
Export citation and abstract BibTeX RIS
The environmental concerns and limited resources of fossil fuels have stimulated research for renewable energy sources such as wind and solar energy. Globally, there is 94 GW of electricity-generating wind power as of 2007, and it is estimated to reach 474 GW by 2020.1 The electricity from solar photovoltaics is growing at 40% per year worldwide, and the United States has targeted 100 GW of solar power by 2020.1 However, the electricity from these and other renewable resources is not constant and reliable due to their sensitive response to local weather conditions. To level out the variable generation of energy, large-scale electrical-energy storage (EES) is required. For the energy storage and load leveling, redox-flow batteries (RFB) have been considered as promising candidates due to their independently controllable power and energy, rapid response time, and high energy efficiency. Extensive research has been performed on RFB systems, including iron-chromium, all-vanadium, sodium-polysulfide, etc.2–5 However, due to the challenging issues such as low cell performance, power density, durability, and high electrolyte cost, their wide-spread adoption has not been realized. For example, the all-vanadium system, which is considered one of the closest to commercialization, utilizes a relatively expensive reactant and achieves power densities that are on the order of 0.2 to 0.7 W/cm2 with relatively low efficiency. A hydrogen/bromine system is proposed as the reactants are earth-abundant and inexpensive and, as will be shown, high performance with high efficiency is obtainable.
Yeo and Chin first investigated the hydrogen/bromine flow battery and reported excellent electric-to-electric efficiency, introducing it as a promising RFB system for energy-storage applications.6 The operating principle of the H2/Br2 RFB can be described with a typical cell structure as in Figure 1. During discharge, a solution of Br2 in HBr (aq) is fed into the cathode compartment where bromine reacts with protons supplied from the anode side and is reduced to bromide, generating the theoretical electric potential of 1.098 V at 25°C. The reduction of bromine at the (+) side is described in the half-cell reaction,
![Equation ([1])](https://content.cld.iop.org/journals/1945-7111/159/11/A1806/revision1/jes_159_11_A1806eqn1.jpg)
At the (−) side, H2 (g) is fed and oxidized to protons during discharge,
![Equation ([2])](https://content.cld.iop.org/journals/1945-7111/159/11/A1806/revision1/jes_159_11_A1806eqn2.jpg)
The net overall reaction for the cell is thus
![Equation ([3])](https://content.cld.iop.org/journals/1945-7111/159/11/A1806/revision1/jes_159_11_A1806eqn3.jpg)
On charge, H2 and Br2 are generated from HBr at the (−) and (+) electrodes, respectively, by reversing the direction of reactant flow without a need to change the cell configuration, as shown in Figure 1.
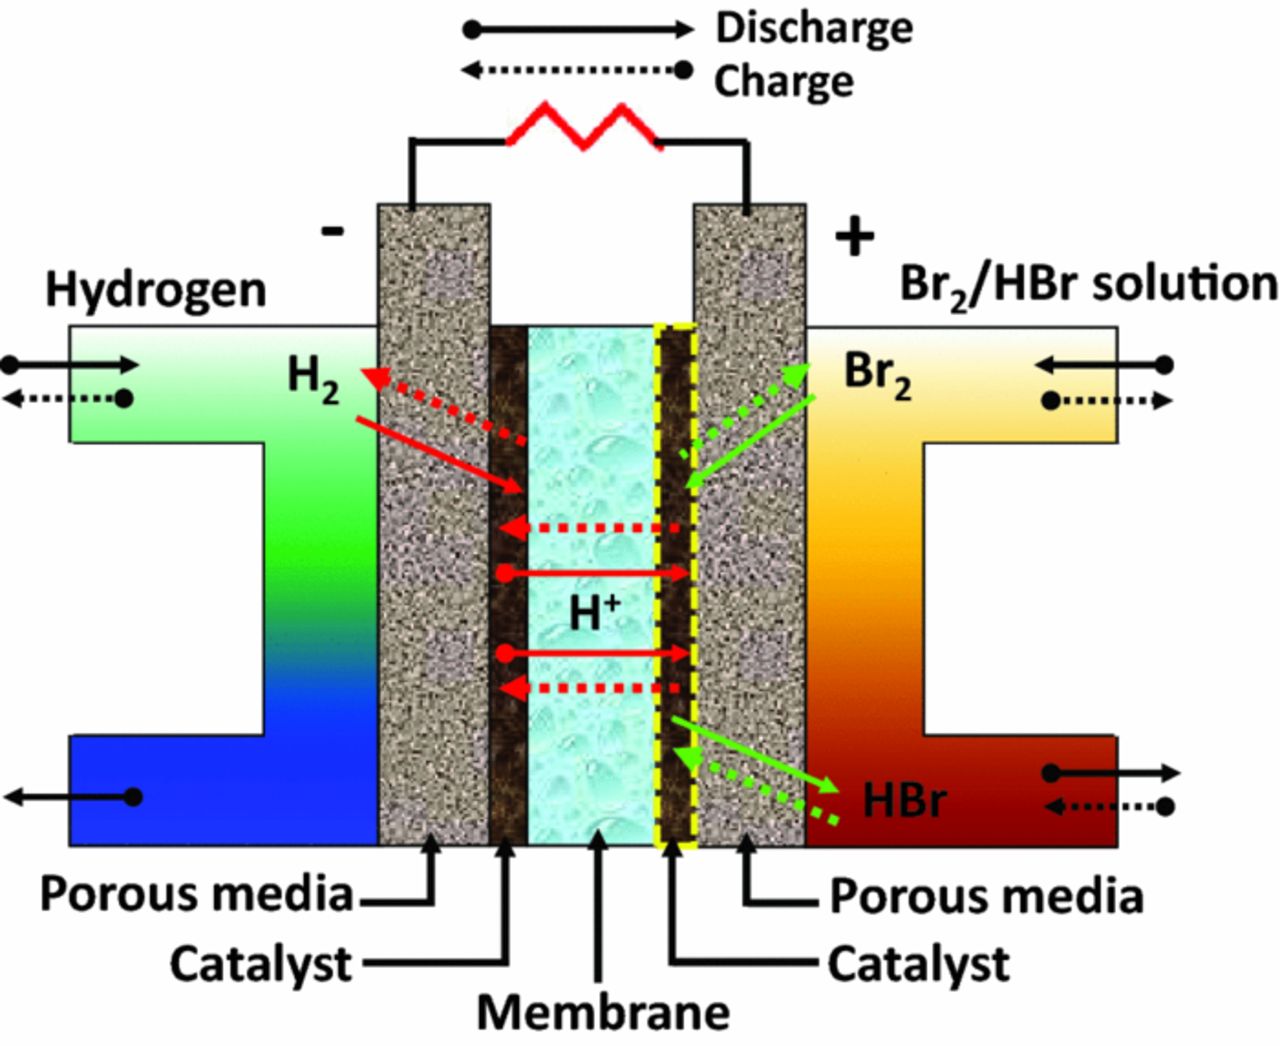
Figure 1. Schematic of Br2/H2 redox-flow-battery operation. Note that for some cases the catalyst layer on the bromine side is not used.
Early studies of this system included investigations into the electrode kinetics of bromine and hydrogen on platinum catalysts, which were performed to understand the reaction mechanism.7,8 These studies show that the reaction kinetics of both hydrogen and bromine are very fast and nearly reversible on Pt. Theoretical modeling studies examined the effects of kinetic, mass transfer, and design parameters on performance including catalyst particle diameter and loading.9,10 Electrolyte research on this system included studies of Nafion membrane,6,11 where it was found that the transport properties of the membrane are related to the water content in the membrane which is lowered as the acid content increases. It was also found that the permeation rate of bromine is much less than that of chlorine due to the negatively charged complex formation.11,12
Life testing of the H2/Br2 RFB has been performed in the literature, demonstrating operational lifetimes of about 10,000 hours,13 but with high catalyst loadings and with only 21 of the total 87 cells lasting to the point of being able to be analyzed, thus showing issues of cell instability. Efforts to improve cell durability were conducted by Kosek and Laconti.14 They reported that the instability of the cell came from the adsorption of bromide on platinum (i.e. Pt poisoning), and various alloys were applied to minimize the poisoning.15–17 Another challenge for developing this system might be related with the toxicity of bromine, which is volatile and boils at 59°C.18 For practical application, the bromine vapor pressure needs to be reduced, and related research into complexing agents, beyond the natural complexation provided by HBr, have been conducted mainly in the zinc-bromide flow-battery system. In that system, polymeric salts19 and quaternary ammonium compounds20 were utilized to complex the bromine and dramatically decrease the bromine vapor pressure.
Recently, the H2/Br2 RFB was again investigated as the importance of a highly efficient electrochemical-energy-conversion system has increased. Livshits et al. reported very high power densities for discharge (or fuel-cell) mode with an energy-conversion efficiency about twice that of a comparable hydrogen/air fuel cell.21 Peled et al. reviewed the characteristics of hydrogen-bromine fuel cells, including the reactivity of bromine/ hydrogen on various metallic catalysts, cell durability, and some regenerative behavior.22 Zhang and Weidner utilized an anhydrous gas-phase scheme to minimize mass-transport limitations associated with liquid-phase electrolytes, and showed a substantial increase in cell discharge performance.23 Goor-Dar et al. reported that the platinum catalyst in the hydrogen electrode was poisoned by the adsorption of anions such as bromides and bromine species transported from the bromine side, and the electrode activity decreased significantly, raising the necessity to develop tolerable and durable cell components.24 There are still gaps in terms of cell charge/discharge performance near the 1 W/cm2 level, and there is no published research systematically analyzing the electrochemical behavior of a H2/Br2 RFB with respect to its major losses and the charge-discharge performance. Consequently, the characteristic behavior of energy storage and conversion of H2/Br2 RFB is not well known, and its application for grid-scale energy storage has not been considered, which is the motivation of this study.
In this paper, the H2/Br2 system is analyzed to elucidate the key factors to enable it for grid-scale electrical-energy storage. First, rotating-disk-electrode kinetic studies are presented along with cell tests of various electrode materials to find the design criteria for a low cost and robust carbon electrode material that has performance comparable to platinum. Next, experimental cell performance is introduced and analyzed to determine the desired electrode structure, flow mode, and cell temperature to achieve high performance. Finally, charge/discharge polarization and rate-capability discharge tests are presented to characterize the reversible behavior of the cell.
Experimental
Rotating-disk-electrode (RDE) measurements of redox exchange currents were done using Pine Instruments platinum, glassy carbon (GC) and basal plane graphite E5 Series RDE electrodes (5 mm dia.), MSR rotator, Pine Instruments glassware and Ag/AgCl double junction reference electrodes, and Bio-Logic VSP and Gamry Instruments G750 potentiostats. A coiled platinum wire was used as the counter electrode. The RDE electrodes were polished with 0.5 micron alumina slurry in DI water before use. Exchange currents using the RDE were measured in two solutions: 0.24 M Br2 in 1 M HBr and 0.24 M Br2 in 7.2 M HBr. The bromine was 99.99+% (Aldrich), the HBr was diluted using 18 MΩ-cm MilliQ DI water (Millipore, Billerica, MA) from ACS grade 48 wt% in water (EMD Chemicals).
The resistance between the working and reference electrodes in the RDE cell was measured by AC impedance, usually at ∼300 kHz, immediately before and after each polarization scan. The average value was used to correct polarization data for IR drop. Anodic scans (5 mV/s) were started at 10 mV negative of open-circuit voltage (OCV), and cathodic scans at 10 mV positive of OCV. Rotations at the speeds of zero or 250 to 2000 rpm were used as needed to measure diffusion-limited currents as near as possible to the scan endpoints (1.4 V and −0.2 V vs Ag/AgCl for anodic and cathodic conditions, respectively). Anodic diffusion-limited currents were not found, even without electrode rotation, in 7.2 M HBr with platinum or carbon electrodes, and no correction for diffusion limitation was made in these cases. However, in 1 M HBr, the anodic diffusion-limited currents were found on all electrode materials, and cathodic diffusion-limited currents were obtained on all electrode materials and for both HBr concentrations.
The RFB cell-test system utilized in this study is shown in Figure 2. The electrolyte solution (0.9 M Br2 in 1 M HBr) was prepared, treated for 1 hour with bubbling N2 gas to remove dissolved oxygen, and supplied to the (+) side of the RFB cell by a peristaltic pump (Cole Parmer EW-07551-00) at various flow rates from 30 to 300 mL/min and returned back to Pyrex glass bottles on the stirring plates. A high volume of electrolyte (i.e. 4 liters) was used to minimize the effect of electrolyte concentration change on the cell performance during the multiple-pass discharge experiments. For the (−) side, fully humidified hydrogen was supplied at a stoichiometric ratio (SR) of 3, and the exit gas vented out to the fume hood. The hydrogen flow rate, current, and high-frequency resistance (HFR) (3.5 kHz) measurement were controlled by a fuel-cell test station (Fuel Cell Technologies).
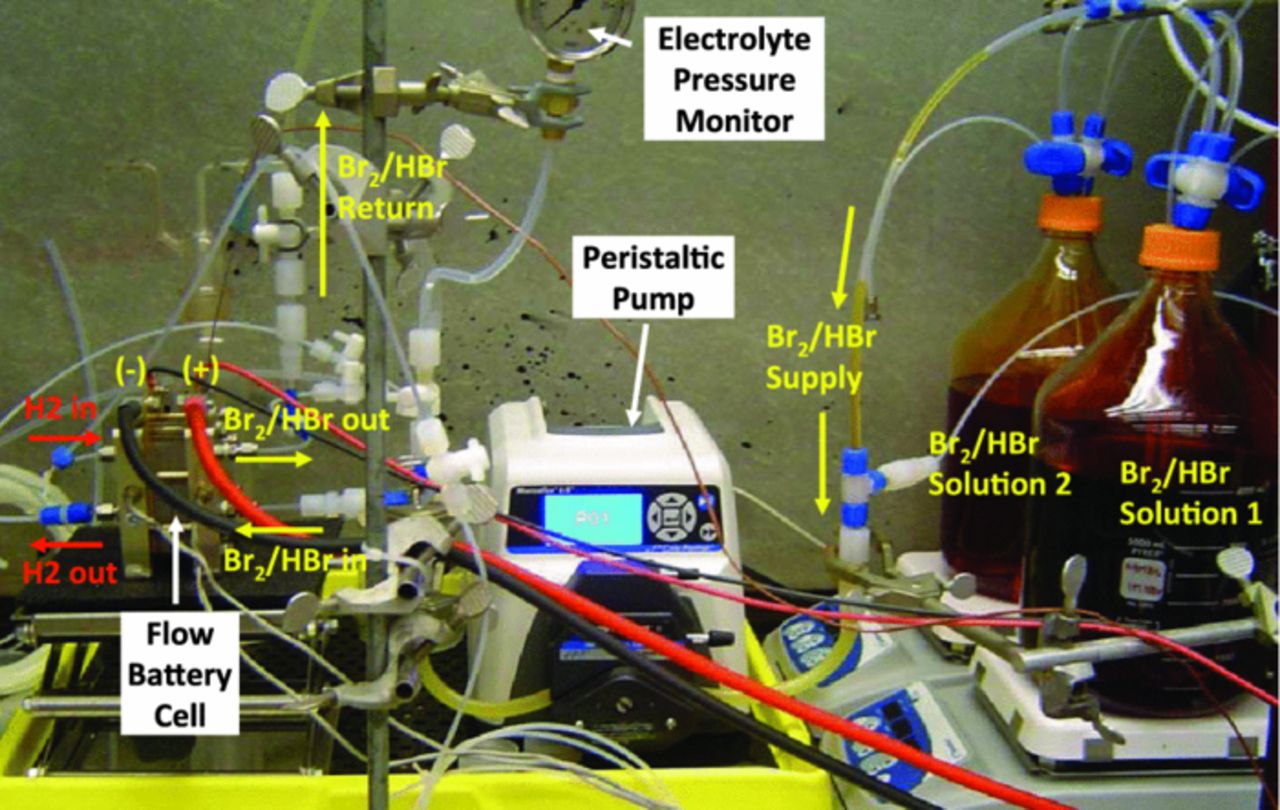
Figure 2. Test setup of the flow-battery cell.
Teflon tubes and fittings were used to prevent corrosion by the acidic electrolyte, and all the experiments were conducted inside a fume hood. As shown in Figure 1, the tested RFB cell consists of carbon porous media (C-PM), single or double catalyst-layer (CL) coated membrane (50 μm thick Nafion NR212) supplied by Ion Power, and graphite flow-field plates and current collectors and aluminum end plates supplied by Fuel Cell Technologies. Teflon gaskets (McMaster-Carr) were applied to seal the cell (active area is 10 cm2) under a compressive force of 250 in-lbf per bolt. In particular, various gasket thicknesses (0.1 to 1.0 mm) were applied for the PM to be compressed by around 20 to 25%. As C-PM, carbon papers such as SGL Sigracet 25AA, 25BC, and 10AA were used, and their material properties are summarized in Table I. The SGL 25 BC is used only on the hydrogen side as it contains a microporous layer that inhibits flow of liquid.25
Table I. Material properties of porous media as provided by SGL Carbon.
| SGL 25AA | SGL 10AA | SGL 25BC | |
|---|---|---|---|
| Thickness (μm) | 190 | 390 | 235 |
| Uncompressed porosity | 90 | 90 | 80 |
| Air permeability (cm3/cm2 s) | 210.0 | – | 1.0 |
| Teflon content in (backing) layer (wt%) | 0 | 0 | 5 |
| Micro-porous layer | None | None | Yes |
For higher-temperature tests, the bromine solution was heated and a condenser was used above the solution in order to condense any bromine vapor back into the solution. The heated solution was pumped into the cell, which was also set to the test temperature using cartridge heaters and the test station.
The effect of bromine electrode material and structure was investigated by comparing traditional CLs with carbon porous-medium electrodes (C-PM). CL-type electrode such as platinum-supported-on-carbon (Pt/C-CL) and just carbon (C-CL) catalysts, and C-PM electrode such as SGL 25AA and 10AA were utilized as electrodes for the bromine reaction. For one study, the C-PM was pretreated before testing by submersion in 99.99% H2SO4 for 5 hours at ambient conditions. For the hydrogen electrode, the Pt/C-CL electrode was applied for all cases. Detailed information about the electrodes is described in Table II.
Table II. Material properties of catalyst-coated-membrane electrodes as provided by Ion Power.
| Electrode structure (Anode|membrane|cathode) | |||
|---|---|---|---|
| Pt/C | Pt/C | Pt/C | |
| | MEM | Pt/C | | MEM | C | | MEM | None | |
| Pt on carbon loading (mgPt/cm2) | 0.38 | 0.27 | 0.38 | 0.45a | 0.27 | None |
| Catalyst-layer thickness (μm) | 8 | 20 | 8 | 20 | 8 | None |
| Ionomer volume fraction | 0.64 | 0.64 | 0.64 | 0.50 | 0.64 | None |
| Weight fraction of Pt to carbon | 0.50 | 0.46 | 0.50 | 0.00 | 0.46 | None |
Results and Discussion
Kinetics on platinum and carbon
Bromine redox exchange-current densities were calculated from polarization data collected with the RDE. The kinetically limited current (IK) was obtained from the total current (IT) in the IR-corrected polarization data using26
![Equation ([4])](https://content.cld.iop.org/journals/1945-7111/159/11/A1806/revision1/jes_159_11_A1806eqn4.jpg)
where ID is the diffusion-limited current. Log IK was plotted versus the IR drop-corrected overpotential (η). The linear region of this plot was extrapolated to zero η to obtain the log of the exchange current, as shown in Figure 3. Exchange currents measured with the three electrode materials in 1 M HBr, 0.24 M Br2 solution are given in Table III.
Table III. Exchange current densities (mA/cm2) measured with the three electrode materials in 1 M HBr, 0.24 M Br2
| Br2 reduction | Br− oxidation | |
|---|---|---|
| Glassy carbon | 0.55 | 0.41 |
| Graphite | 0.14 | 0.14 |
| Platinum | 64 | 30 |
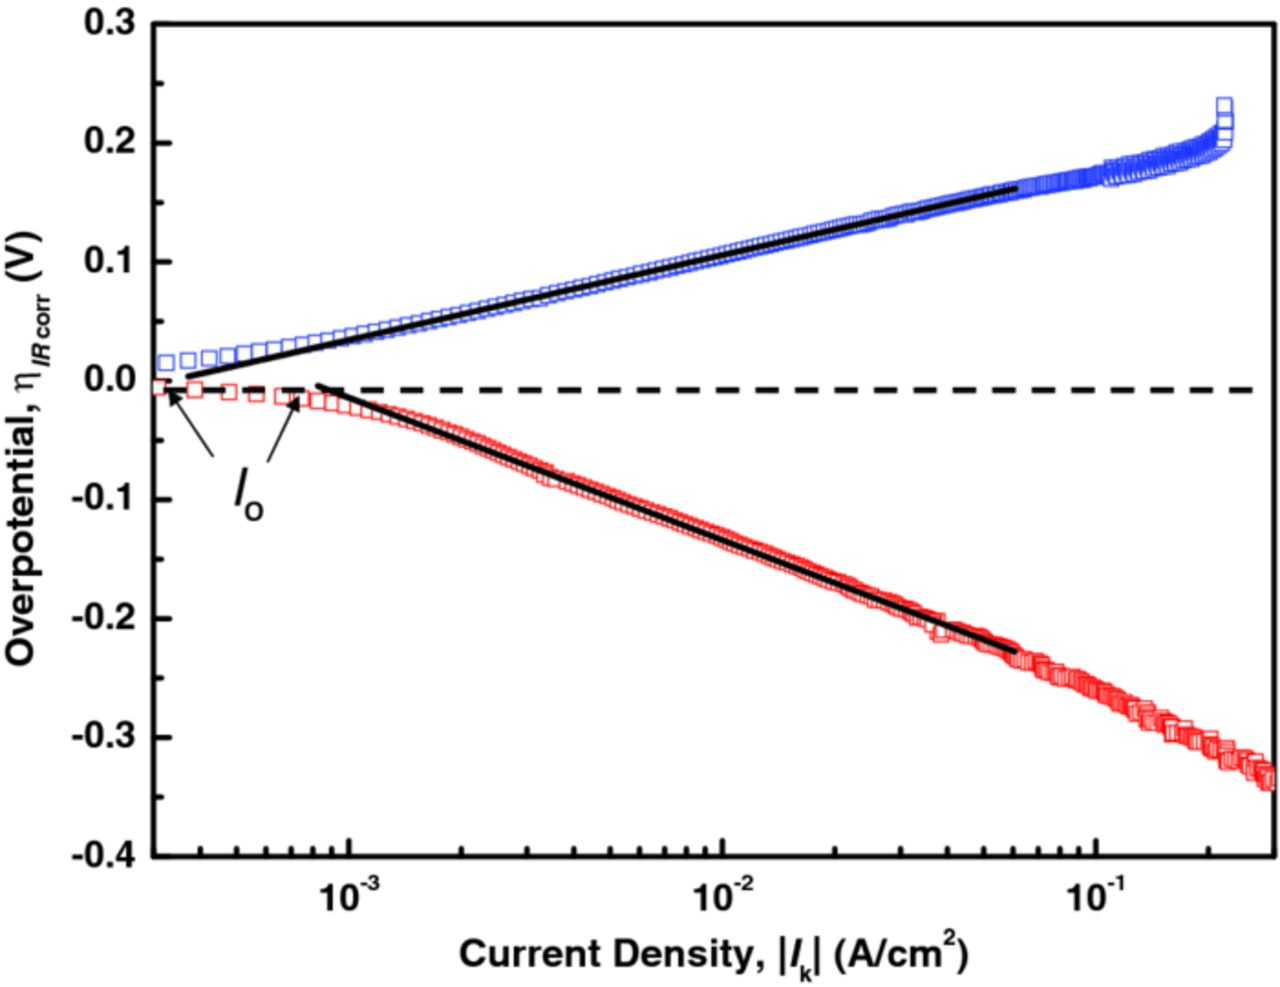
Figure 3. Tafel plot of the IR drop and diffusion-limitation-corrected anodic and cathodic polarization data for a glassy carbon RDE in 0.24 M Br2, 7.2 M HBr, showing the extrapolation to the logarithm of the exchange current, I0.
From Table III, bromine redox-reaction rates are much higher on platinum than on either carbon, although they are still high on carbon compared to many other redox chemistries.5 However, platinum is expensive, was found to dissolve in HBr,27 and the kinetics are sufficient on carbon alone. Thus, the decision was made to use carbon without Pt as the bromine electrode.
The bromine reaction on carbon can be improved by increasing the surface area available for reaction. It is of interest to estimate the surface area that would be required in a porous-carbon electrode to obtain an energy efficiency equivalent to that of a typical platinum-catalyzed RFB electrode. In the best-case scenario of kinetically-limited polarization (i.e., no ohmic or mass-transfer limitations), an estimate can be made using the kinetically-limited current versus IR-corrected voltage data obtained from the RDE measurements.
The calculation of the bromine-electrode voltage can be exemplified in the case of the Pt-catalyzed CL. A typical platinum-catalyzed CL has a roughness factor on the order of 100 cm2 Pt surface area per cm2 geometric area.28 To account for the Pt loading, we multiplied IK by 100 in the IK vs η current-density data for platinum derived from the Pt RDE polarization experiments in 1 M HBr, 0.24 M Br2, and obtained the IK vs η data for a CL with a Pt loading of 100 cm2 Pt per cm2 geometric area. By taking the iR-corrected bromine electrode potential measured in RDE experiments (0.997 V at 0.01 A/cm2) and subtracting the hydrogen-electrode potential (−0.012 V vs. NHE at STP, obtained from Nernst equation with an assumption of 0.4 M H+ in Nafion), the corresponding voltage of a hydrogen bromine RFB charging at 1 A/cm2 (given the multiplication factor due to Pt loading discussed above) was calculated to be 1.009 V. The corresponding data for a GC-catalyzed CL is obtained again by multiplying the experimentally obtained GC IK vs η current-density data by 100 to 20000 to compare the performance of the two catalysts at loading ratios (GC/Pt) of 1 to 200. The result of this comparison at 1 A/cm2 is shown in Figure 4.
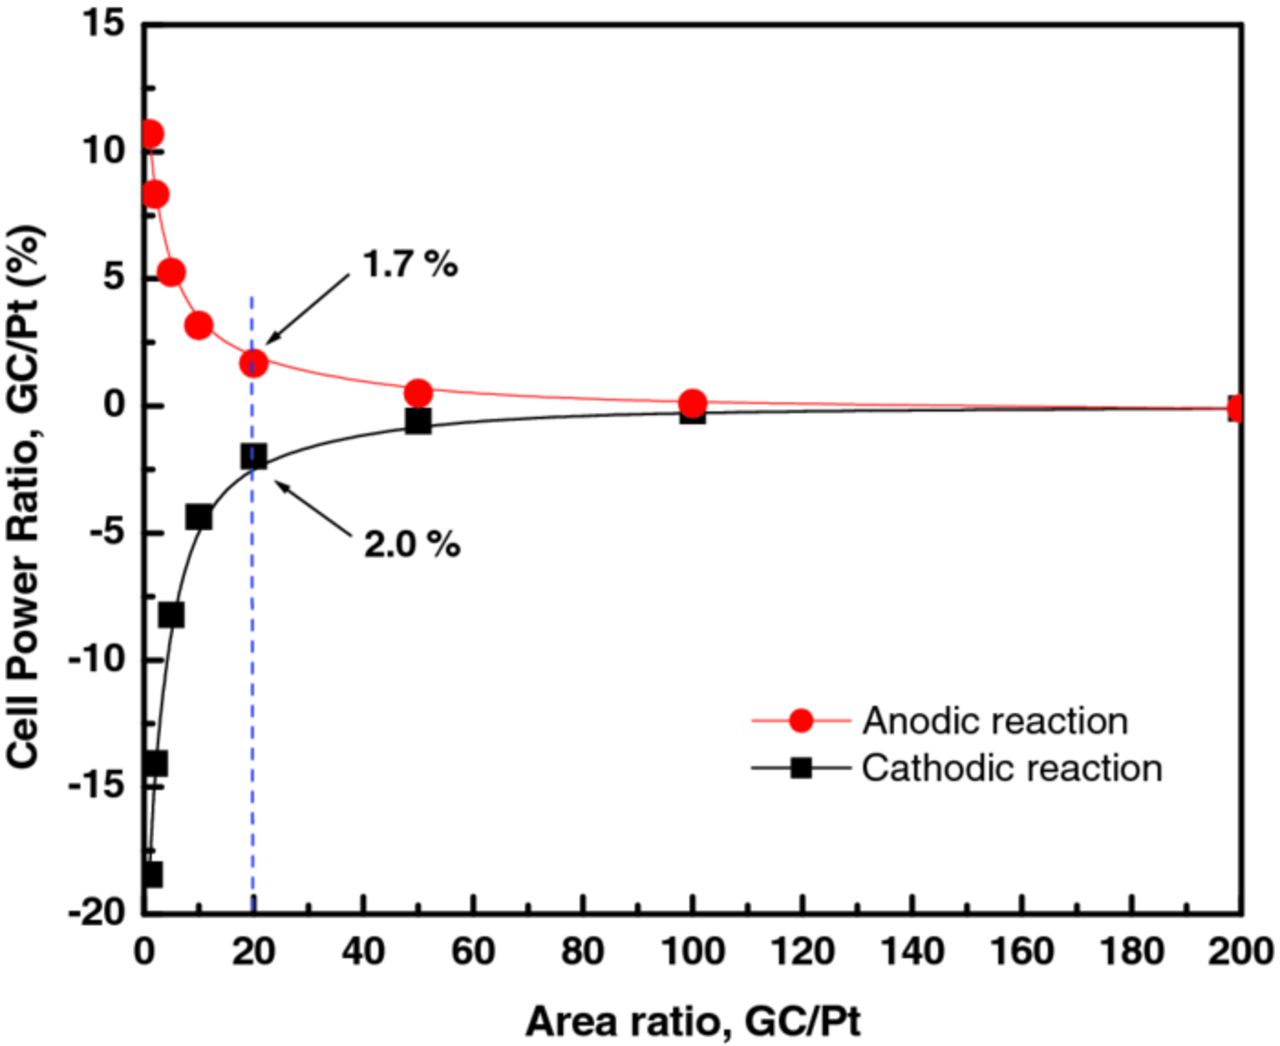
Figure 4. Power consumed (generated) by a flow cell with a GC-catalyzed bromine electrode normalized to that using Pt-catalyzed electrode as a function of the GC to Pt surface-area ratio. The comparison assumes an unpolarized hydrogen negative electrode, a Pt-catalyzed bromine electrode with a loading of 100 cm2 Pt surface area per cm2 geometric, and kinetically-limited cell operation at a current density of 1 A/cm2. For example, at a GC/Pt area ratio of 20 (2000 cm2 carbon catalyst area/cm2 MEA), the cell with the GC-catalyzed bromine electrode would consume 1.7% more power (or energy) on charge, and deliver 2% less power (energy) on discharge than the Pt-catalyzed electrode.
As indicated in the figure, to obtain a kinetically limited performance within 2% of that for a Pt-catalyzed CL, a GC electrode requires about 20 times more surface area per cm2, or 2000 cm2 carbon surface area per cm2 geometric area. Carbon blacks have specific surface areas ranging up to nearly 1000 m2/g.29 Thus a 2000 cm2 carbon surface area per cm2 geometric should be easily achievable; a CL carbon loading of only 2 mg/cm2 with a specific surface area of only 100 m2/g would meet this requirement. Finally, it should also be noted that although Pt is used on the hydrogen electrode, it has been shown in hydrogen fuel cells that the fast kinetics allow for a much smaller amount to be used (∼0.05 mg/cm2) than what is used in this study with negligible effect on performance up to 2 A/cm2.30
Polarization characterization on discharge.— Effect of electrode material and structure
Three different electrode structures were prepared for the (+) side to investigate their effect on cell performance, as illustrated in Figure 5: Pt/C-CL electrode (i.e. PM∥Pt/C|MEM|Pt/C∥PM), C-CL electrode (i.e. PM∥Pt/C|MEM|C∥PM), and C-PM electrode (i.e. PM∥Pt/C|MEM∥PM)c where Nafion NR212 was used for proton-exchange membrane (MEM), the left and right sides of MEM represent the (−, H2) and (+, Br2) sides, and for PM, SGL 25BC and 25AA were used for the (−) and (+) sides, respectively. As shown in Figure 5, the CL-type electrode has catalyst particles mixed with ionomer to form a laminate, which is then thermally bonded onto the membrane. The PM-type electrode is a porous carbon-medium sheet that contacts the bare membrane physically via a compressive force during cell assembly. 0.9 M Br2/1 M HBr solution was fed to the (+) side at 200 mL/min while fully humidified hydrogen at a stoichiometric ratio of 3 was provided to the (−) side, and cell tests were conducted at 20°C and ambient pressure.
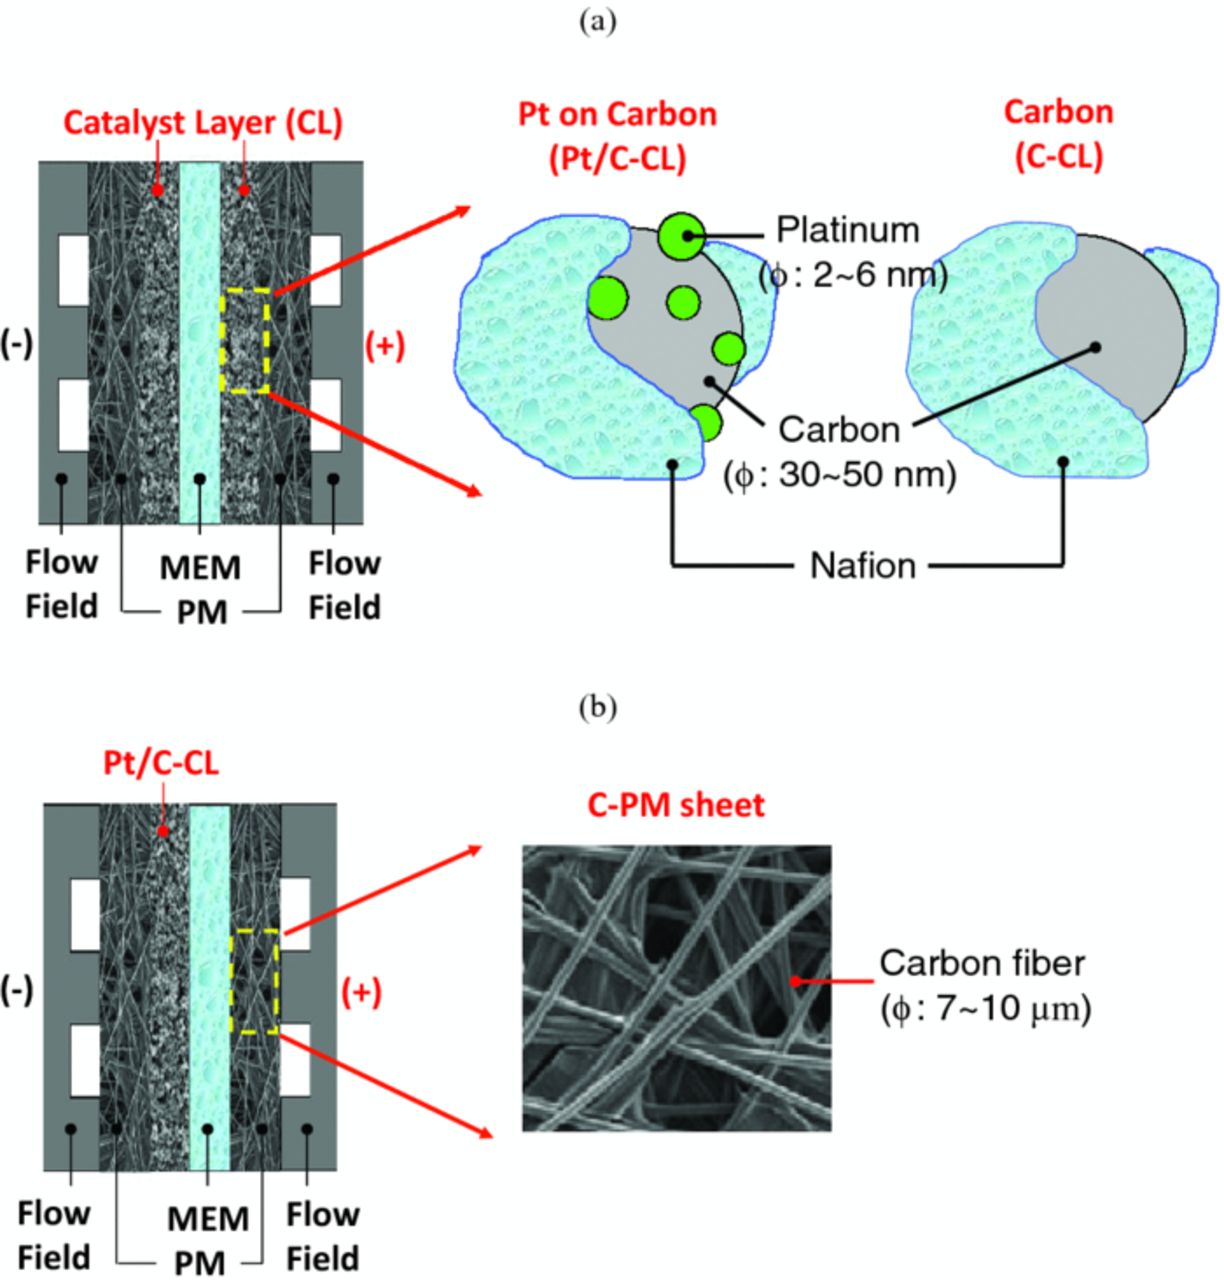
Figure 5. Electrode structure for (a) catalyst-layer electrode (Pt/C-CL electrode in the left and C-CL electrode in the right) and (b) carbon porous-medium electrode (C-PM electrode).
As shown in Figure 6 and in agreement with the RDE results in the previous section, there was no significant performance drop in the low-current-density region (i.e. less than 0.2 A/cm2) for the case of the Pt/C-CL electrode, indicating activation loss (i.e. kinetic loss) is nearly negligible due to the fast kinetics of bromine on Pt. The maximum power density achieved was 0.7 W/cm2 which is 3 to 4 times greater than that of typical RFBs in the literature,31 and comparable with recent reported work with the all-vanadium system at elevated temperatures.32
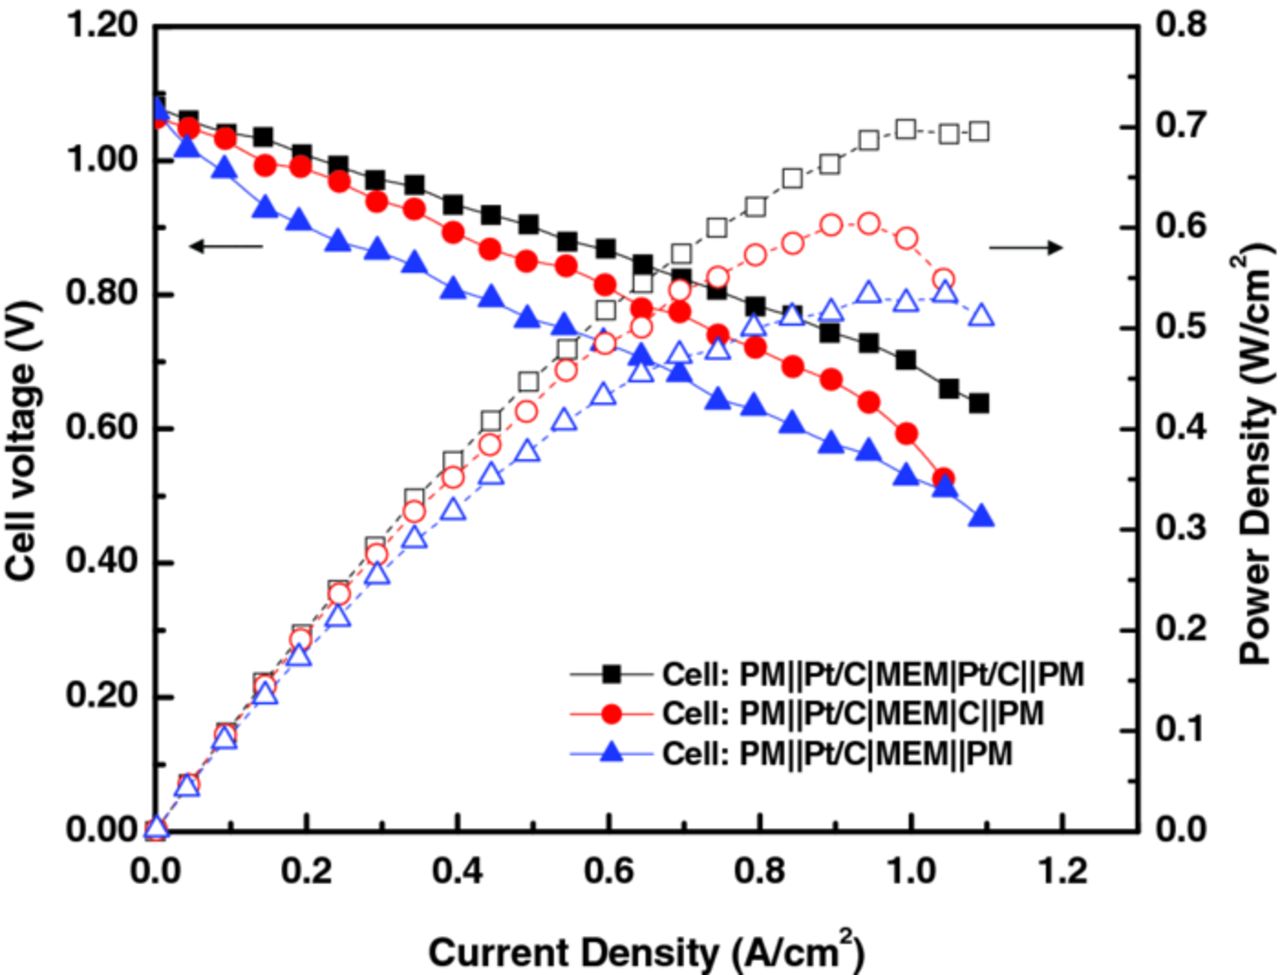
Figure 6. Performance comparison for various electrode materials and structures.
For the case of the C-CL electrode in which there is no platinum and only carbon particles, again, no significant voltage drop in the kinetic region was observed, while there was substantial voltage drop in the higher-current-density region (beyond 0.9 A/cm2) wherein mass-transfer becomes the dominant cell-performance limitation. The kinetic-related performance can be explained with the reaction area of each electrode type, as described in the RDE test results. The carbon particle in the C-CL electrode is calculated to have almost 20 times greater area than platinum in the Pt/C-CL electrode.d Thus, the bromine reaction on carbon became comparable to platinum due to the greater reaction area (see Figure 4). The significant mass-transfer loss at higher current densities is attributed to the surface wettability of the electrode to the aqueous bromine electrolyte, where Pt-containing CLs seem to be more hydrophilic.33 Thus, the hydrophobic property in the C-CL electrode may impede the transport of aqueous bromine to the reactions sites in the CL, thus resulting in lower cell performance.
For the case of the C-PM electrode (i.e. SGL 25AA carbon paper), there was a significant kinetic loss at low current densities. This loss is probably due to the smaller reactive surface area of the C-PM electrode, which has a highly porous structure (porosity of 90%) with carbon-fiber diameters of 7 to 10 μm, which are several orders of magnitude greater than the diameter of the Pt (2 to 6 nm) and carbon particles (30 to 50 nm) in the CLs.34,35 In addition, the carbon-paper fibers are more graphitic than the carbon in the CL, which may result in slower kinetics. The reaction area for the C-PM electrode was calculated to be less than 4% of that of the C-CL electrode when using a fiber-filament model36
![Equation ([5])](https://content.cld.iop.org/journals/1945-7111/159/11/A1806/revision1/jes_159_11_A1806eqn5.jpg)
where a is the specific surface area (cm2/cm3), ε is the porosity, and df is fiber diameter (cm).
Although the low-current-density performance is less with the C-PM electrode, the high current-density region was not significantly affected by additional mass-transfer losses, in contrast to the case of the Pt/C-CL electrode. This lack of change is probably due to better bromine accessibility to the reaction sites due to the highly porous structure and relatively good hydrophilicity of the C-PM electrode.
Effect of flow mode
To examine the mass-transfer effects, two different flow-field structures were examined; namely, a single serpentine flow field (SPFF) and a solid flow field (SFF), as shown in Figure 7. In the SPFF, the electrolyte flows by the PM and the aqueous bromine accesses the surface of the electrode mainly by diffusion and perhaps some convection around the U-shaped bends (i.e. Flow-By Mode), whereas for the SFF, the electrolyte is forced to flow convectively through the PM to reach the reaction site (i.e. Flow-Through Mode).
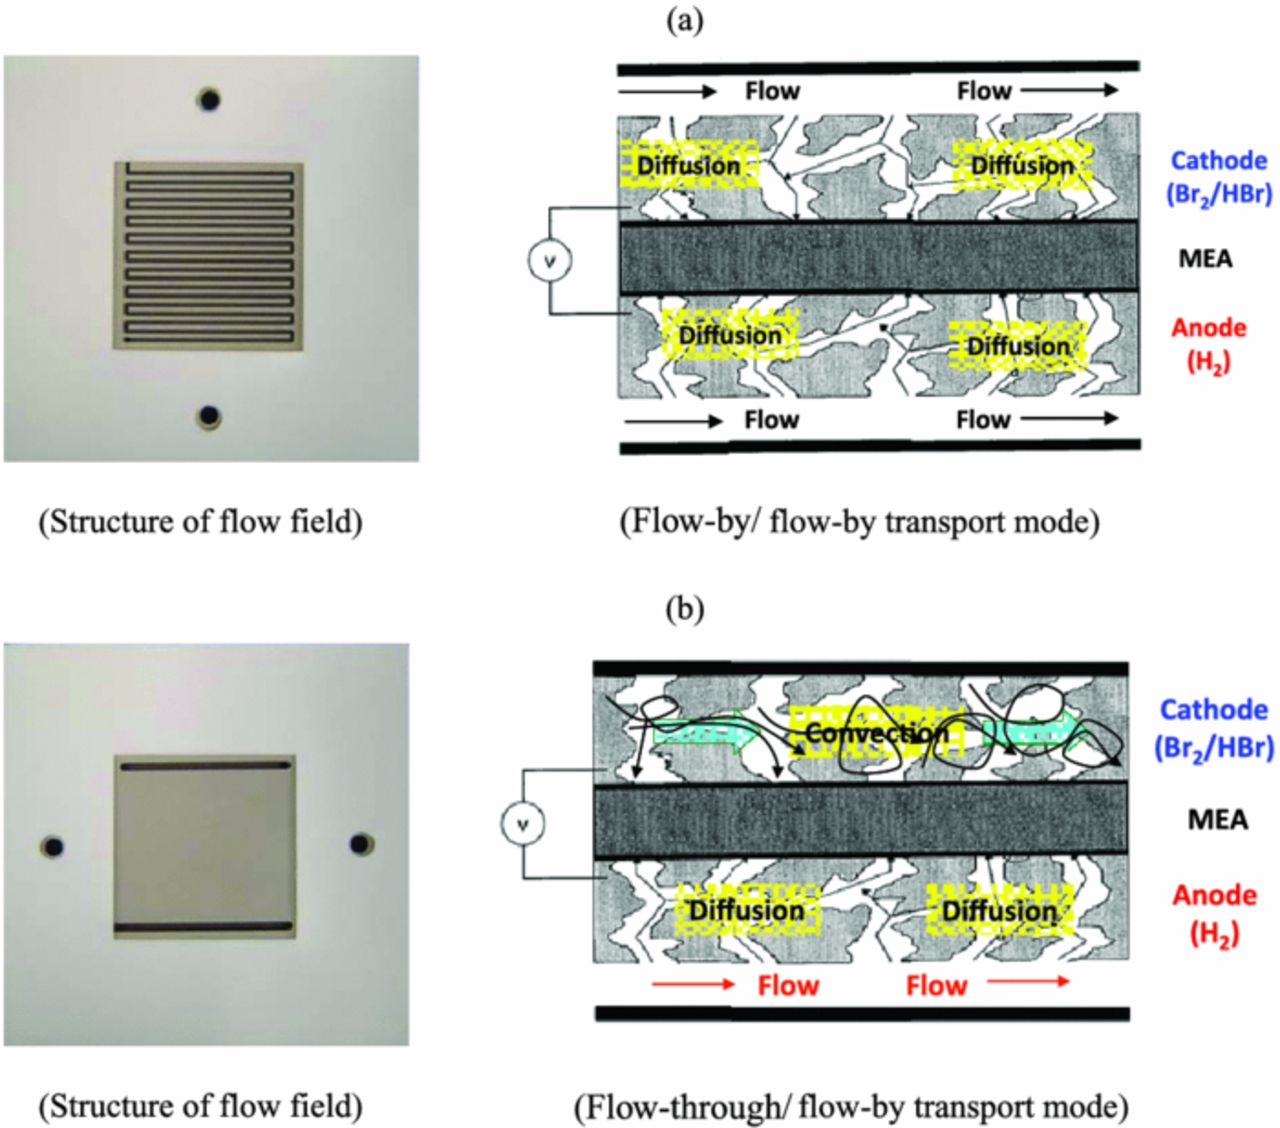
Figure 7. Structure of flowfield for electrolyte: (a) Single serpentine flow field (SSFF) and (b) solid flow field (SFF).
The cell performance of each flow-mode structure was compared with the cell consisting of 25BC∥Pt/C|NR-212∥25AA. For the case of flow-by mode (i.e., Figure 7a), the maximum cell performance was 0.47 to 0.51 W/cm2, and the maximum current density was around 1.1 A/cm2, as shown in Figure 8a. As the electrolyte flowrate increased, the cell performance was enhanced by 8.5% due to improved mass transport, which probably resulted in more convective transport within the PM (i.e., convection under the ribs around the serpentine bends). By changing the flow mode from flow-by to flow-through (i.e., Figure 7b), the maximum cell power density was enhanced by 23% (from 0.51 to 0.63 W/cm2), and the maximum current density was improved significantly from 1.1 to 1.4 A/cm2, as illustrated in Figure 8b. The increase in performance is probably due to the forced convection of the electrolyte toward the membrane, which facilitates the transport of Br2 and HBr to and from the C-PM electrode, respectively. This is also seen in that there was no noticeable enhancement in the kinetic-dominant region (i.e. at low current densities), thus indicating the reaction kinetics was not improved significantly with the change of flow mode.
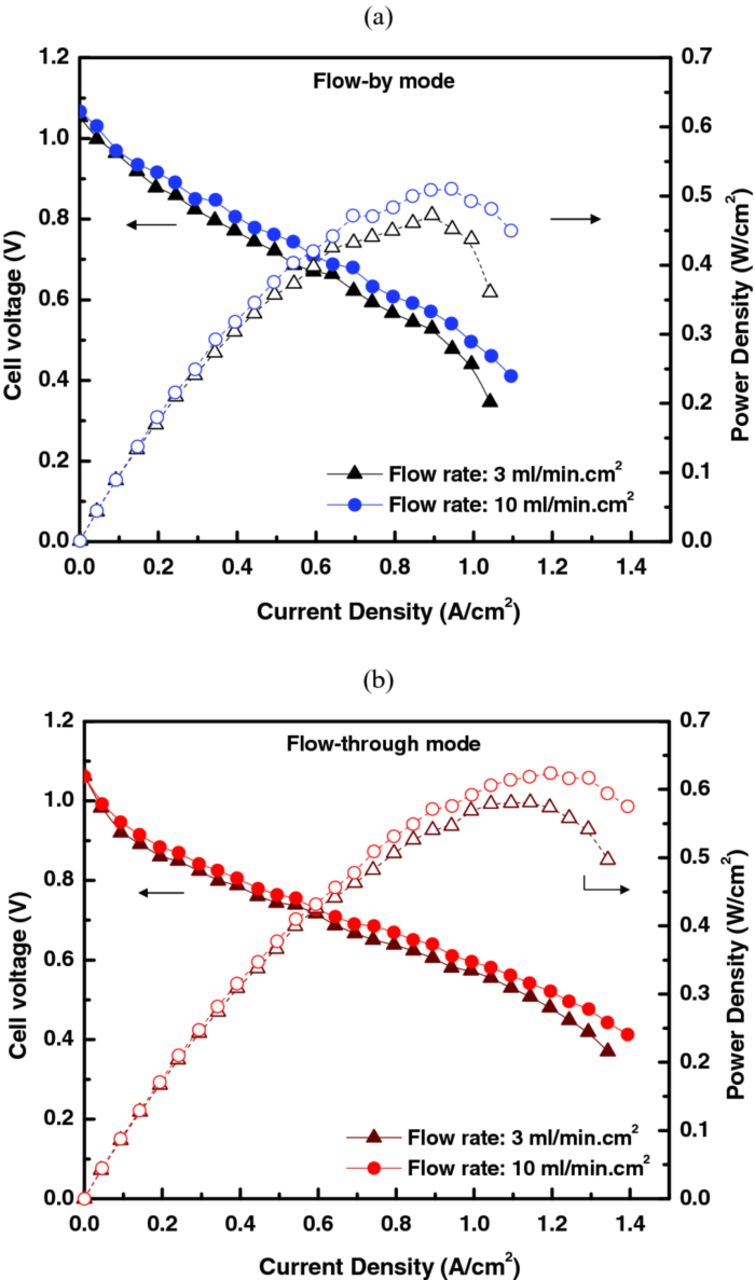
Figure 8. Effect of flowfield on cell performance: (a) flow-by mode using the SSFF and (b) flow-through mode using the SFF.
To elucidate the differences between the two designs, one can correlate the reaction rate to the underlying bromine transport phenomena37
![Equation ([6])](https://content.cld.iop.org/journals/1945-7111/159/11/A1806/revision1/jes_159_11_A1806eqn6.jpg)
where, i is current density, n is equivalent electrons per mole of reactant, F is Faraday constant, Dj is diffusivity of component j, Cj is concentration of component j, and uz is velocity of component j in the direction to the electrode. In the flow-by system, the bulk motion and convection near the electrode is small relative to the diffusion, and the consumption rate of reactant can be generally correlated with diffusive transport. For the case of flow-through mode, transport of reactant and product take place due to forced convection. Therefore, the bulk motion and convection near the electrode becomes dominant in Eq. 6. This idea is also in-line with the simplified simulation results shown in Figure A2, where the diffusive boundary layer is visible for the flow-by mode and there is more convection and reaction in the flow-through one.
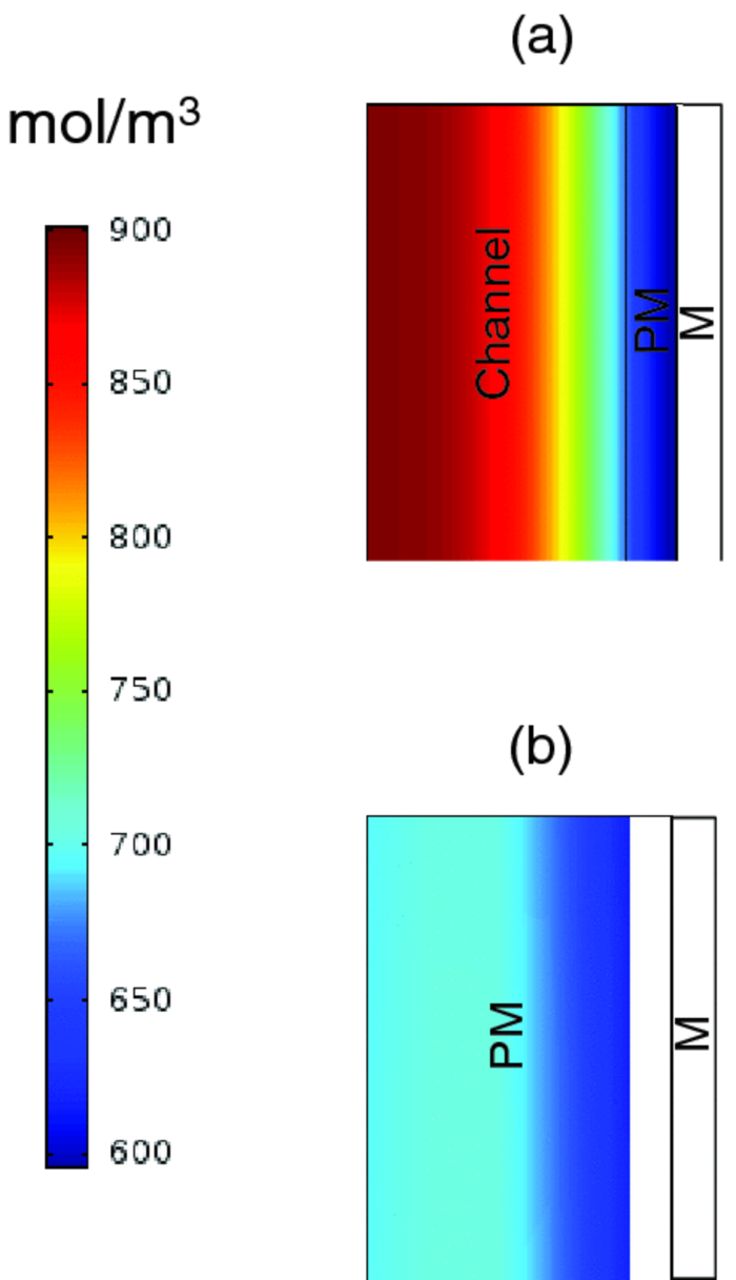
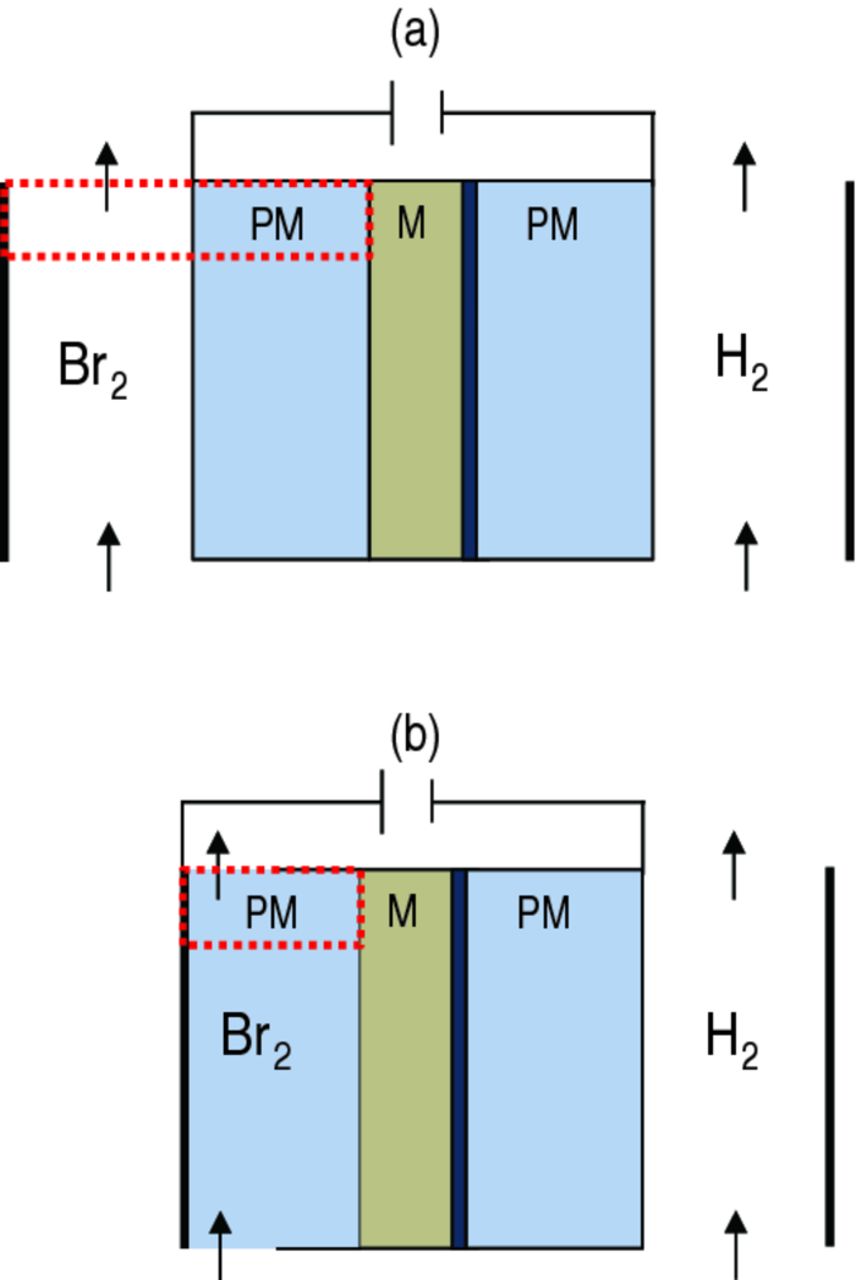
Figure A1. Schematic of modeling domain for (a) flow-by and (b) flow-through modes. The red boxes highlight the regions shown in Figure A1.
To understand further the differences in mass transfer due to flow mode, additional analysis of the polarization curves is conducted. HFR measured during operation yields the total ohmic resistance associated with the cell components (i.e. electronic resistance through solid components, interfacial or contact resistance between them, and proton resistance in the membrane) and hardware connections between the cell and load bank. Therefore, the ohmic drop related to proton transport in the membrane can be determined by subtracting the total ohmic resistance with the resistance obtained from the same-cell test-setup but without membrane, which was measured in DC mode separately. It should be noted that ohmic losses associated with ionic conduction in the mixed-conducting or porous electrodes are not measurable using HFR as it measures the path of least resistance for the current (i.e., via electron conduction).37
As shown in Figure 9a, the proton resistance was around 0.15 and 0.22 Ω-cm2 for flow-through and flow-by modes, respectively, which is about 2 or 4 times greater than that expected for a liquid-equilibrated Nafion membrane.6 This behavior is considered to be related to the fact that Nafion conductivity decreases as its free-acid content increases,6,11,38–40 and thus the effect of flow mode and electrolyte flowrate on the conductivity might be interpreted with this characteristic behavior. As the flow mode changes from flow-by (i.e. diffusive transport) to flow-through (i.e. forced convective transport) and the flowrate increases, the local buildup of the generated HBr in the cell could be mitigated, generating a relatively less acidic environment surrounding the membrane, and thus increasing the membrane conductivity, consistent with Figure 9a. In fact, this is what the simulation results demonstrate in Figure 9b, which is calculated according to the simplified model described in the Appendix. In Figure 9b, one can see that although more HBr is produced in the flow-through case, the flow-by one results in a substantial HBr concentration next to the membrane due to the fact that removal of HBr is essentially only by diffusion for the flow-by mode.
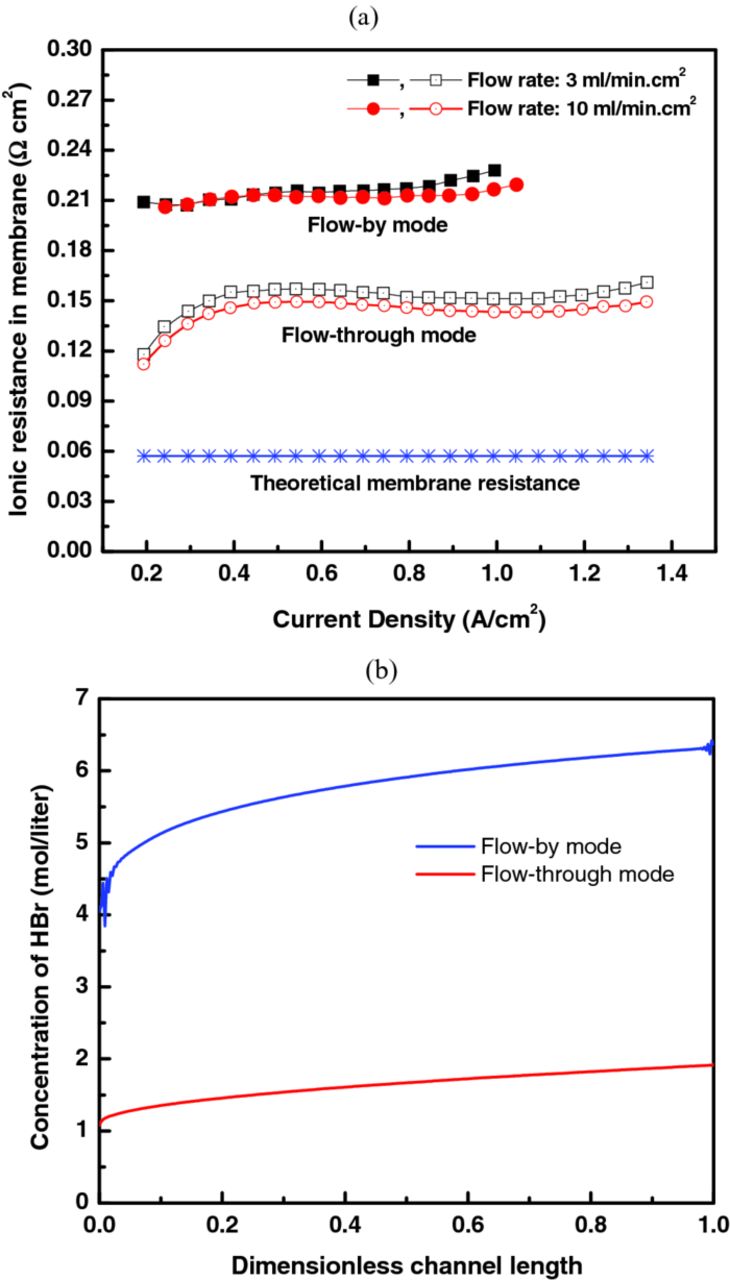
Figure 9. Comparison of (a) membrane ionic resistance and (b) simulated HBr concentration next to the membrane at 0.8 V cell potential for the flow-by and flow-through modes.
To understand the non-measurable components of the polarization curve, the kinetic and linear parts of the curve were fit by
![Equation ([7])](https://content.cld.iop.org/journals/1945-7111/159/11/A1806/revision1/jes_159_11_A1806eqn7.jpg)
Where ηIR, mem and ηIR, HW are the losses associated due to membrane conduction, and contact resistances and electron conduction, respectively, which together compromise the measured HFR, ηIR, elect are the losses associated with proton transport in the liquid electrolyte, and ηact, j is activation (kinetic) loss of component j on the electrode,
![Equation ([8])](https://content.cld.iop.org/journals/1945-7111/159/11/A1806/revision1/jes_159_11_A1806eqn8.jpg)
where, R is universal gas constant, T is the cell temperature, a is the specific interfacial area, L is the electrode thickness, and α is the transfer coefficient which is set to a value of 1 for the two reactions.41,42 It should be noted that the solution concentration change was only about 1% after discharge operation due to the use of the high volume of electrolyte; therefore, the effect of concentration change in this analysis is not considered explicitly. In equation 7, both the activation potentials for the H2 and Br2 reactions are accounted for, where ai0L for H2 is taken from literature (0.1 A/cm2)41 and for Br2 it is fit to the experimental polarization curve (0.0017 A/cm2). Also, the Tafel expression in equation 8 may overestimate the reaction overpotential since for fast reactions a full Butler-Volmer expression is expected; for this reason, the very beginning points of the curves were not fit. It should be noted that while ηIR, HFR is given by the HFR, ηIR, elect is the pseudo-iR loss associated with mass transport (i.e. ionic transport) within the porous electrodes which cannot be measured with HFR, as mentioned above.
Figure 10 shows that the cell performance for the flow-through-mode case (see Figure 8b) can be separated into the various constituent overpotentials using Eq. 7; where, for high current densities, the nonlinear portion of the curve results from additional mass-transfer limitations that are probably related to Br2. Due to the use of Tafel expressions for the kinetics, the overpotentials at low current densities go higher than observed as mentioned above. From the figure, it is clear that at mid-range current densities, the resistance is due both to kinetic and ohmic factors, with the bromine kinetics and membrane conduction being the largest fraction of each. To understand the flow-mode and mass-transport effects leading to the pseudo-IR response better, it is instructive to do a simple analysis. If one assumes that Br2 is limiting the reaction, then the reaction proceeds at the back of the electrode up to a maximum penetration depth of bromine into the electrode. In this case, this mass transfer will result in a pseudo-iR response that is due to the proton movement from the membrane to this penetration depth. From fitting the two flow-mode-case curves using Eq. 7, the pseudo-ohmic electrolyte resistances for the flow-through and flow-by modes were calculated to be 0.05 and 0.09 Ωcm2, respectively. If those values are considered to be solely due to the ohmic loss due to proton conduction in the electrolyte, then, using Ohm's law and the conductivity of the HBr/Br2 solution (0.15 S/cm),43 the maximum bromine penetration depths are determined to be 75 and 145 μm from the membrane for the flow-by and flow-through cases, respectively. Thus, this simple analysis shows that there is perhaps twice as much penetration of Br2 in the flow-through than the flow-by mode, which is consistent with the observed higher limiting current and Figure A2. This also agrees with the fact that the liquid flows in the flow-through design penetrate further and perhaps remove the HBr better to reduce the membrane ohmic resistances as discussed above (see Figure 9a).
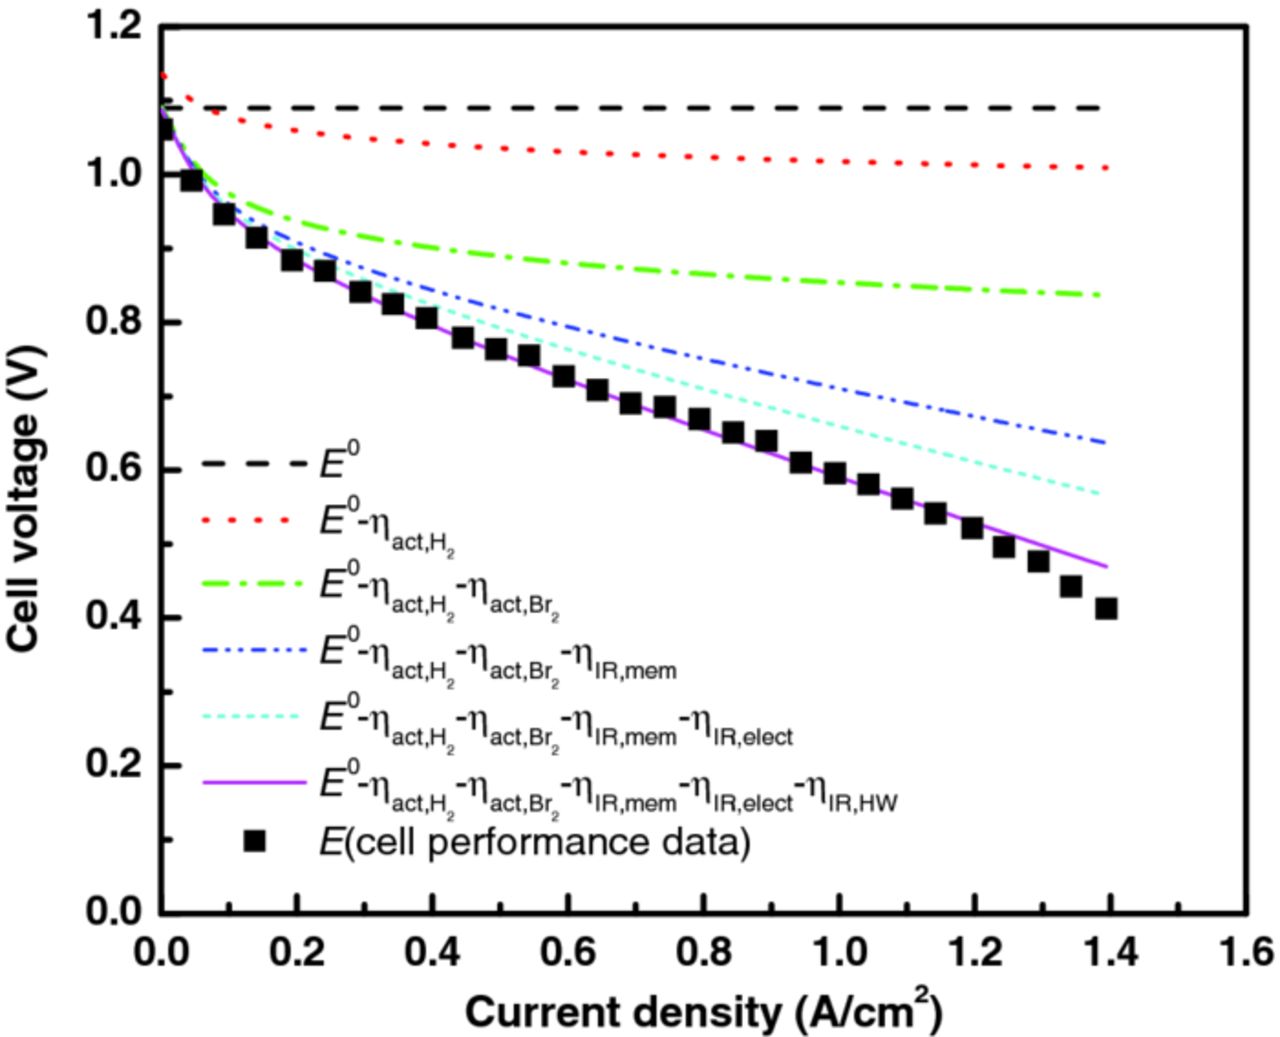
Figure 10. Overpotential breakdown of the flow-through-mode polarization curve using Eq. 7.
It is worthwhile to mention the scalability of the flow-through mode for actual application in a RFB system. The pressure drop and channeling/preferential flow of electrolyte are key parameters to be considered for the actual application. In the tests reported herein, the flow-by and flow-through modes had similar pressure drops (i.e 16 versus ∼12 psig at 200 mL/min of electrolyte, respectively). The similarity is due to the longer flow path for the flow-by serpentine channel (668 versus 32 mm) and the highly porous nature of the carbon electrode (∼90% porosity). As one scales up, there may be some pressure-drop concerns, which can be mitigated by moving toward perhaps interdigitated44,45 or rectangular flowfields. The other potential problem of the flow-through mode for actual application is related to channeling and preferential flow of electrolyte, which minimizes electrode utilization. However, this issue can be mitigated by proper manifold design, as has been shown in liquid-fed fuel cells.46
Improvement of RFB cell performance
The above two sections describe improvements to the flowfield (i.e. flow mode) and the ability to use C-PM as an alternative to Pt for the bromine electrode. These two studies were done concurrently, and it is of interest to put them together for an improved cell design using a lower-cost electrode material. As discussed above, the surface area of the C-PM needs to be increased to offset its slightly lower kinetics. In addition, as seen in Figure 10, there is still a substantial kinetic overpotential for the bromine electrode. To increase the active surface area, two sequential procedures were undertaken. First, a stack of 3 SGL 10AA PM was used as the bromine electrode to increase the surface area for reaction. Second, the electrode was pretreated by submersion in 99.99% H2SO4 for 5 hours at ambient conditions, which is thought to help increase the catalytically active area as well as perhaps the wetting characteristics of the electrode.47 These electrodes in combination with the SFF give the cell performances displayed in Figure 11. As can be seen, the stack of SGL 10AA electrode is on par with that of the Pt/C CL (i.e., ∼0.7 W/cm2 peak power density), but with the higher maximum current density (see Figure 6) afforded by the flow-through design. In addition, the pretreatment of the electrode further enhanced both the kinetic and mass-transport parts of the polarization curve with a maximum power density of 0.92 W/cm2 and a limiting current density greater than 1.5 A/cm2; the exact effects of pretreatment are currently under investigation.
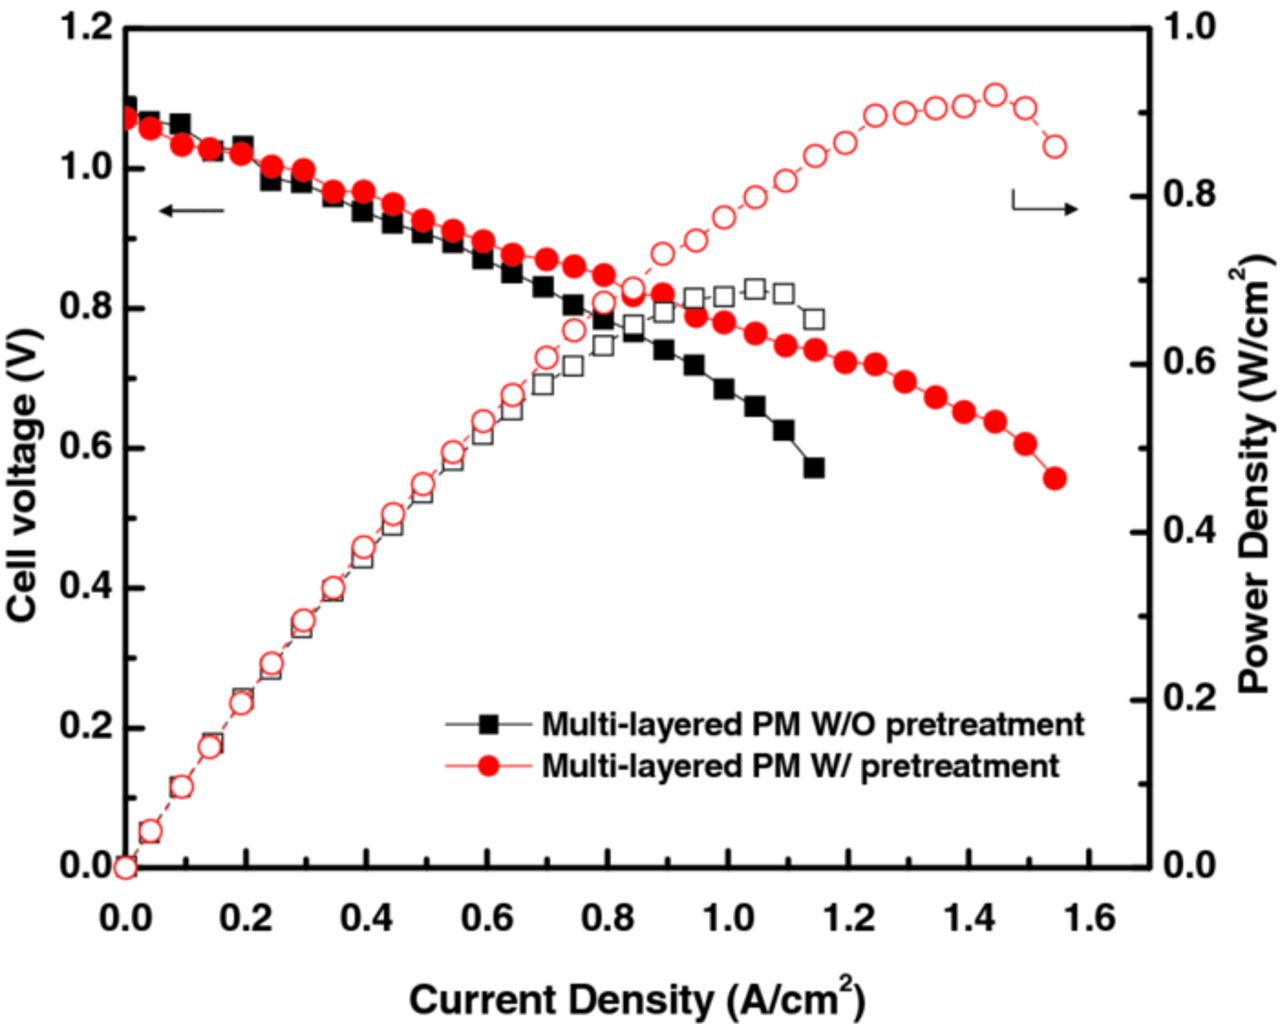
Figure 11. Improved RFB-cell discharge polarization curve using the SFF and a stack of 3 SGL 10AA PM for the (+), Br2 electrode with and without electrode pretreatment.
Cell performance is expected to increase due namely to changes in the transport properties (conductivity and diffusion coefficients), and, to a lesser extent, the electrochemical kinetics. To investigate the impact of temperature, the above best-performing cell (i.e. multi-layered C-PM highly activated by pretreatment and flow-through flow mode) was tested additionally at 40 and 55°C. As shown in Figure 12, the maximum power density increased from 0.85 W/cm2 at 20°C to 1.13 W/cm2 at 40°C, and to 1.4 W/cm2 at 55°C, and the maximum current density increased to 2.5 A/cm2 at 55°C; this cell performance is some of the highest reported values for RFBs.
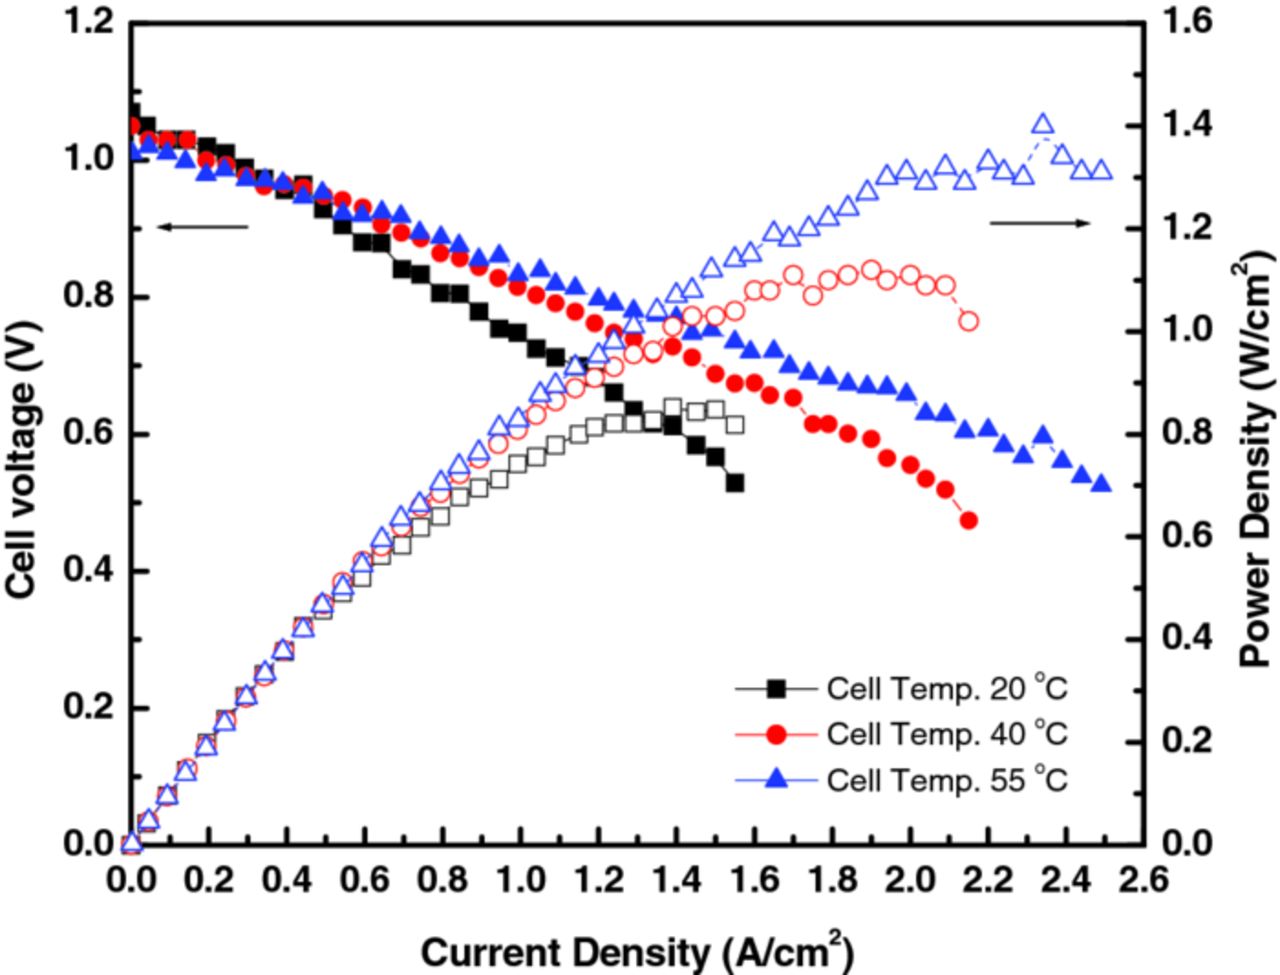
Figure 12. Discharge performance of improved cell (see Figure 11) at various temperatures.
To investigate the cell losses, the effect of temperature on the HFR and the subsequent HFR-corrected polarization curves are compared further in Figure 13. As shown in Figure 13a, the HFR, which is dominated mainly by conduction through the membrane, significantly decreased as the temperature increased, with the average membrane resistance (i.e. after compensating for the ohmic resistance associated with the hardware) going from 0.06 Ωcm2 at 20°C, to 0.04 Ωcm2 (33% decrease) at 40°C, and to 0.03 Ωcm2 (50% decrease) at 55°C. This change is slightly higher, but consistent with the expected change in Nafion conductivity from 20 to 55°C.48 It is also interesting to note that the HFR increases with current density, which may be due to anode dryout or the issues with HBr dehydrating the membrane as discussed above, where the latter mechanism may be more likely since the increase decreases with temperature.
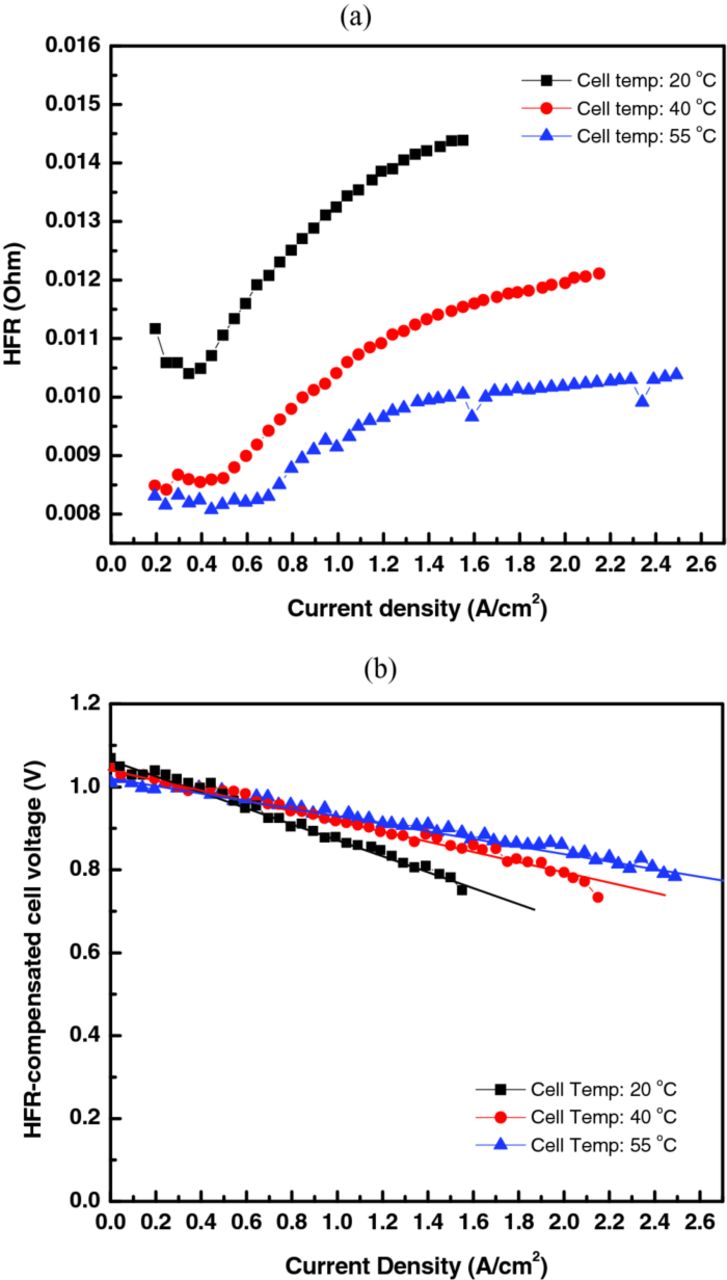
Figure 13. Effect of temperature on (a) high-frequency resistance and (b) other cell losses.
To investigate the temperature effect on the rest of the cell losses, the HFR-compensated performance is shown in Figure 13b. Due to the linearity of the data, a line was fit to them and the change in slope was compared, which is a measure of the other, primarily mass-transfer, resistance. The calculated resistances are: 0.19 Ωcm2 at 20°C, 0.12 Ωcm2 (37% decrease) at 40°C, and 0.08 Ωcm2 (58% decrease) at 55°C. These values are higher than the HFR ones, showing that for the improved cell the membrane and contact resistances are roughly a third of the total resistance. Similar to the membrane resistance, increasing temperature greatly reduced the other cell resistances.
Charge/discharge polarization curves
The above studies focus on the discharge performance of the RFB cell. To understand charge operation, additional experiments were conducted using the improved RFB cell. Constant current mode was utilized for discharge and charge experiments with an electrolyte of 0.9 M Br2/1 M HBr. The polarization tests of charge and discharge were repeated three times while recirculating the Br2/HBr electrolyte, and the repeatable performances are compared in Figure 14.
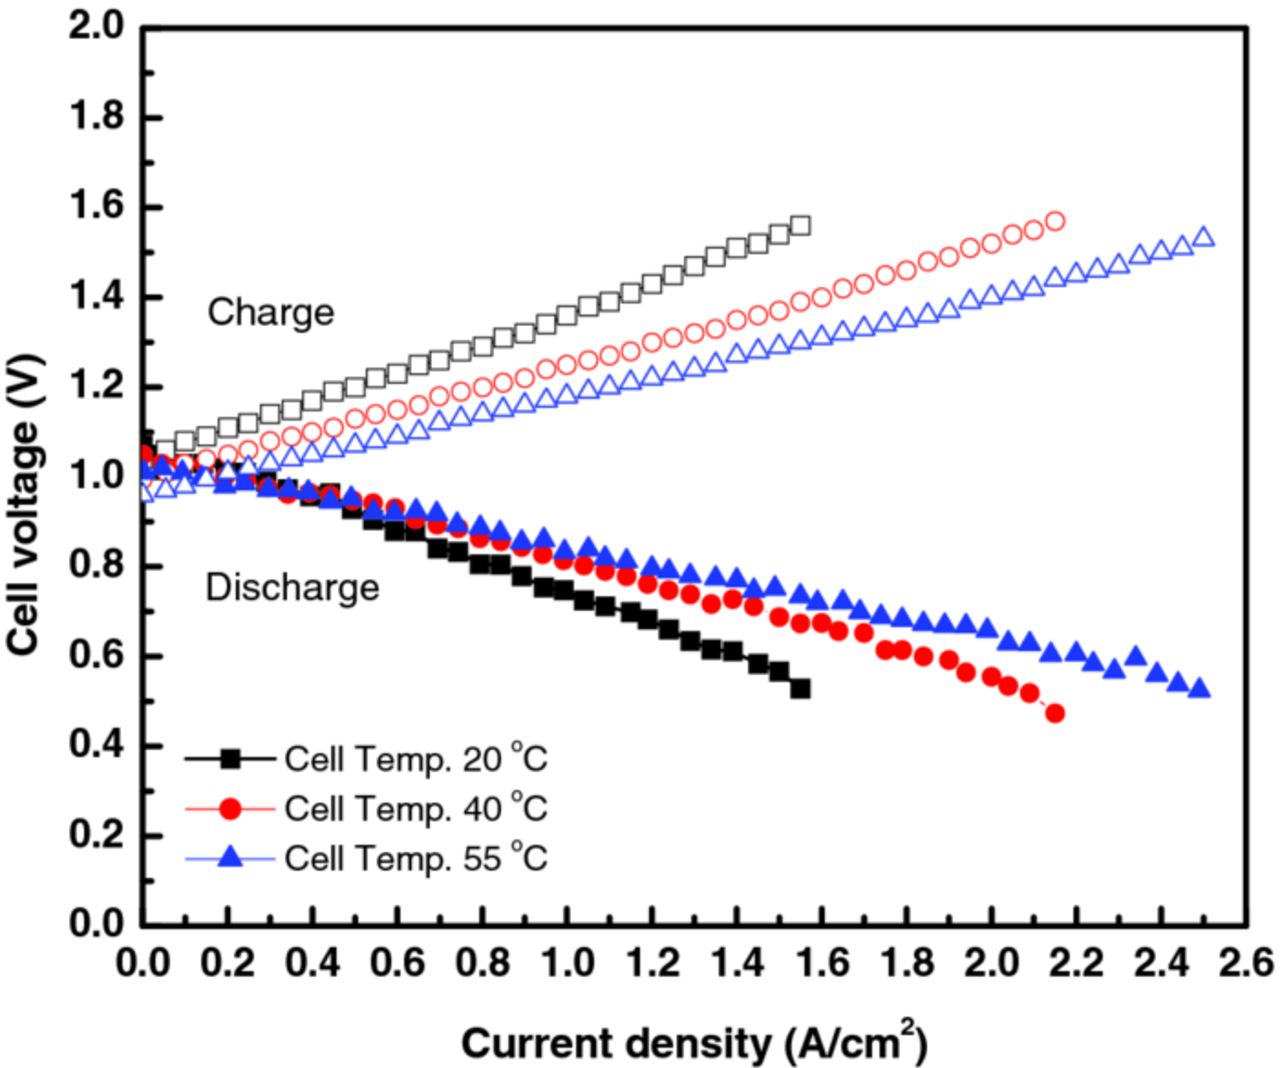
Figure 14. Comparison of polarization curves for charge and discharge operation at different operating temperatures and using the improved cell (see Figure 11).
As illustrated, the polarization curves for discharge and charge are nearly symmetric around the OCV potentials. This indicates that the charge and discharge behavior of the H2/Br2 RFB are nearly reversible, in contrast to other RFB systems where charge and discharge were asymmetric.31 In addition, the charging curves do not demonstrate the presence of significant side reactions (a sudden upturn in current with increase in voltage) even up to 2.5 A/cm2 for 55°C operation, thus indicating that the potential is still below that of oxygen evolution and carbon oxidation on these materials and under these conditions and concentrations.49,50 From Figure 14, one can also estimate the round-trip voltaic efficiency of the cell
![Equation ([9])](https://content.cld.iop.org/journals/1945-7111/159/11/A1806/revision1/jes_159_11_A1806eqn9.jpg)
For example, at a constant-power charge and discharge of 0.4 W/cm2, Vη = 82, 88, and 91% at cell temperatures of 20, 40, and 55°C, respectively, which is one of the highest such efficiencies reported to our knowledge for a RFB at reasonable power.
Discharge rate capability
To understand the RFB rate capabilities, full discharges at various current densities were conducted under ambient conditions. An amount of solution of 186 mL of 0.9 M Br2/1 M HBr was utilized so that it could be discharged in 1 hour at 0.9 A/cm2, i.e. a 1C rate; thus a discharge rate at 4.5A would take 2 hours (i.e., C/2). As illustrated in Figure 15, the cell potential dropped gradually with discharge, following a Nernstian potential, and then dropped precipitously at around the theoretical time for the full discharge. The change of concentration can be seen in the color change of the storage solution before and after the discharge (Figure 15). The bromine utilization is calculated by
![Equation ([10])](https://content.cld.iop.org/journals/1945-7111/159/11/A1806/revision1/jes_159_11_A1806eqn10.jpg)
where tactual is actual time for discharge and ttheoretical is discharge time calculated from Faradary's law. The calculated values are about 93% for 0.5 C and 1 C, 87% for 1.2 C, and 4% for 1.4 C. Thus, at modest rates, the RFB uses most of the solution, which is consistent with the polarization-curve analysis above (see Figures 9b and 10). Furthermore, the RFB cell demonstrates hardly any utilization loss over several rates, thus widening the operating window for its applicability to energy-storage requirements for different applications and ramp-rate and charge/discharge requirements.
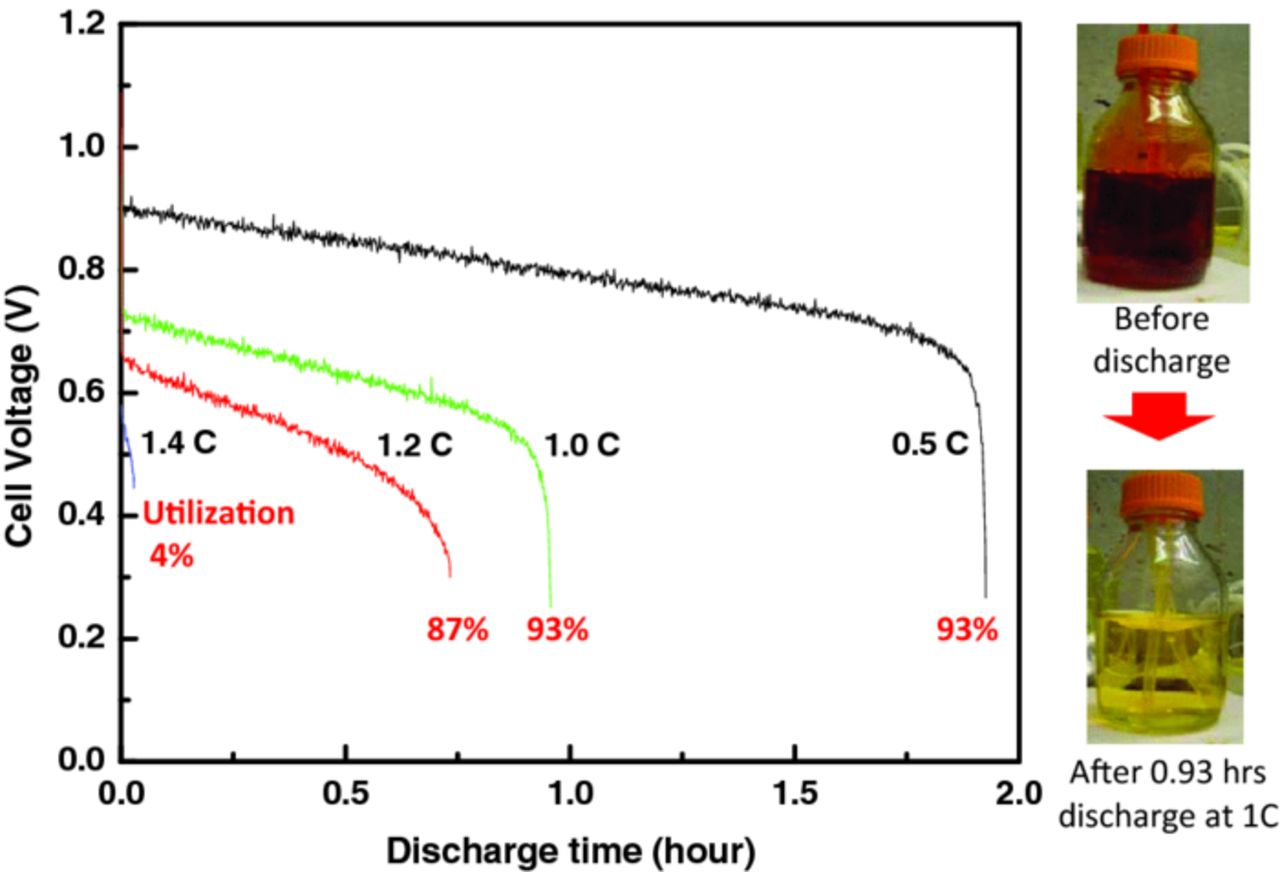
Figure 15. Discharge behavior at various constant current densities or C rates.
Conclusions
In this paper, the electrochemical performance of a H2/Br2 redox-flow battery was investigated. It was shown that the system is a promising candidate for grid-scale energy storage due to its high efficiency at relatively high power densities (91% voltaic efficiency at 0.4 W/cm2) and high peak power (1.4 W/cm2) with a positive porous electrode comprised only of carbon, and high bromine utilization (∼93%) across several charging rates. The cell performance was increased due to the use of thicker multilayer electrodes and their pretreatment in sulfuric acid, a flow-through mode, and elevated cell temperature. Analysis of the discharge polarization curves hints that further improvement can be obtained by optimizing bromine transport into the porous electrode and minimizing the ohmic losses associated with proton conduction in both the membrane and liquid electrolyte.
Acknowledgments
This work was funded by Advanced Research Projects Agency-Energy (ARPA-E) of the U. S. Department of Energy under contract number DE-AC02-05CH11231. The authors would also like to thank SGL Carbon for providing the carbon porous media.
: Appendix
To understand the impact of flow mode, mathematical modeling was conducted. Specifically, the two designs, flow through and flow by, were investigated in Comsol Multiphysics using simplified, well-known governing transport and porous-electrode equations.37,51 The 2-D modeling domain is shown in Figure A1. The governing equations solved included Nernst-Planck for protons and bromine, convective diffusion for bromine, and Fick's law for hydrogen. The equations were coupled through the reaction terms given by Butler-Volmer expressions using the measured kinetics. The various transport properties were taken from literature assuming dilute solutions,48,52 and the conductivity of the HBr/Br2 solution was measured to be 0.3 S/cm. Ohm's law was used to model the ion and electron conduction. For the fluid-flow, Navier-Stokes was used in the channels and Darcy's law was used for the porous media. The simulation was steady state with the inlet boundary condition being the inlet flow and concentration of the 0.9 M Br2 in 1 M HBr solution. The potential at the hydrogen side was set to an arbitrary value of zero and the electronic potential of the bromine side was varied to get a polarization curve. The experimental polarization-curve data for the flow-through and flow-by cases was fit by varying the bromine diffusivity.
Figure A2 depicts the bromine concentration out the outlet of the cells (as indicated by the red boxes in Figure A1). The simulation results demonstrate that the flow-by case results in a significant diffusive boundary layer where diffusion is the only mode of transport or bromine into the electrode. Conversely, the flow-through case results in a more uniform bromine concentration profile and utilization.
Footnotes
- c
"∥" indicates the boundary between phases bonded to membrane and the other phase, and "|" indicates the boundary between different components.
- d
The reaction areas of electrodes applied to the cell test were estimated with assumptions that catalyst particles are perfect spheres and entire surface areas are used for the reaction.