Abstract
Mechanical degradation of lithium-ion battery (LIB) electrodes has been correlated with capacity fade and impedance growth over repeated charging and discharging. Knowledge of how the mechanical properties of materials used in LIBs are affected by electrochemical lithiation and delithiation could provide insight into design choices that mitigate mechanical damage and extend device lifetime. Here, we measured Young's modulus E, hardness H, and fracture toughness KIc via instrumented nanoindentation of the prototypical intercalation cathode, LiXCoO2, after varying durations of electrochemical charging. After a single charge cycle, E and H decreased by up to 60%, while KIc decreased by up to 70%. Microstructural characterization using optical microscopy, Raman spectroscopy, X-ray diffraction, and further nanoindentation showed that this degradation in KIc was attributable to Li depletion at the material surface and was also correlated with extensive microfracture at grain boundaries. These results indicate that KIc reduction and irreversible microstructural damage occur during the first cycle of lithium deintercalation from polycrystalline aggregates of LiXCoO2, potentially facilitating further crack growth over repeated cycling. Such marked reduction in KIc over a single charge cycle also yields important implications for the design of electrochemical shock-resistant cathode materials.
Export citation and abstract BibTeX RIS

This is an open access article distributed under the terms of the Creative Commons Attribution Non-Commercial No Derivatives 4.0 License (CC BY-NC-ND, http://creativecommons.org/licenses/by-nc-nd/4.0/), which permits non-commercial reuse, distribution, and reproduction in any medium, provided the original work is not changed in any way and is properly cited. For permission for commercial reuse, please email: oa@electrochem.org.
Energy storage is an enabling technology for electrified transportation and for large-scale deployment of renewable energy resources such as solar and wind. For many applications, non-aqueous ion-intercalation chemistries such as Li-ion are attractive for their high energy density and electrochemical reversibility. However, the electrode materials used in ion-intercalation batteries undergo significant composition changes—which correlate to high storage capacity—that can induce structural changes and mechanical stresses; these changes can degrade battery performance metrics such as power, achievable storage capacity, and lifetime.1–8 Microstructural damage has been observed directly in numerous electrode materials subjected to electrochemical cycling, both within single crystals (or grains) and among polycrystalline aggregates.4,5,7–15
While the relationships among electrode microstructure, electrochemical cycling conditions, crystallographic changes in the active materials, and resulting mechanical stresses have been elucidated, relatively little is known about the composition-dependency of the key physical properties. Numerous models have been developed to predict mechanical deformation in ion-storage materials during electrochemical cycling, as recently reviewed by Mukhopadhyay and Sheldon.16 The quantitative utility of such models is dependent on measured elastoplastic properties, particularly the fracture toughness of these materials. To date, few experimental measurements of fracture toughness KIc of battery materials have been reported;17–20 similarly, few measurements of composition-dependent mechanical properties have been reported, with the exception of lithiated silicon for which both fracture toughness19,21 and elastic constants21–27 have been reported as functions of composition. Thus, the extent to which KIc and other elastoplastic properties of ion-storage materials vary with lithium concentration, is understood poorly.18,28,29 Identifying any such correlations will facilitate realistic application of mechanical failure models as a function of state-of-charge, and allow prediction and extension of durability and lifetime of electrode materials and devices.
In nonstoichiometric transition-metal oxides with variable oxygen content, such as GdxCe1-xO2-δ, chemical expansion effects can modulate mechanical properties such as elastic modulus.30,31 Likewise, nonstoichiometry resulting from electrochemical intercalation reactions could influence the mechanical properties of Li-storage materials. Computational studies of lithiated graphite have shown that the orientation-averaged elastic modulus changes by a factor of 2–3 upon maximal lithiation,29 and variations consistent with these calculations have been reported experimentally.28 Similarly, reduction of elastic moduli by a factor of 2–3 has been predicted computationally for lithiated silicon alloys32 and verified experimentally.19,21–27 Mechanical property variations of this magnitude affect the stress distributions developed in electrochemically active materials.29,33 Thus, the design and selection of mechanically robust battery electrode materials requires knowledge of how mechanical properties change during electrochemical cycling.
Here, we investigate the mechanical properties of the model lithium intercalation compound, LiXCoO2 (LCO), as a function of electrochemical delithiation. The coupling between material chemistry and mechanical behavior is referred to as chemomechanics; with the added dimension of electrochemical control of composition, we refer to this coupling as electro-chemo-mechanics. Of particular interest is whether and to what extent the fracture toughness KIc, which quantifies resistance to fracture, depends on electrochemical history and instantaneous composition. The availability of dense polycrystalline sintered LCO, an air-stable compound, facilitates direct measurement of the mechanical properties of individual crystallites (grains) via instrumented nanoindentation.17 The phase behavior of LCO within the cycling range has been studied thoroughly and is well understood.34–37
The fracture toughness of the starting LCO, which is assumed to be well-annealed and relatively defect-free, was measured previously via the nanoindentation-based pop-in method, described extensively elsewhere.17,38–41 This experimental approach relates KIc to so-called "pop-in" events (see Figure 1 and Methods) that manifest when cracking is induced during nanoindentation loading. Briefly, the resulting crack length c is determined from displacement bursts at a given applied load; the calculated KIc depends on c as well as the Young's elastic modulus E and hardness H of the uncracked material. This provides a means to determine fracture toughness of small, brittle material volumes without direct imaging of indentations or optical measurement of c. While Qu et al. established previously that this approach could be used to quantify KIc at the level of individual LCO grains or crystals, the effect of electrochemical charging on fracture toughness or other mechanical properties has not previously been investigated.
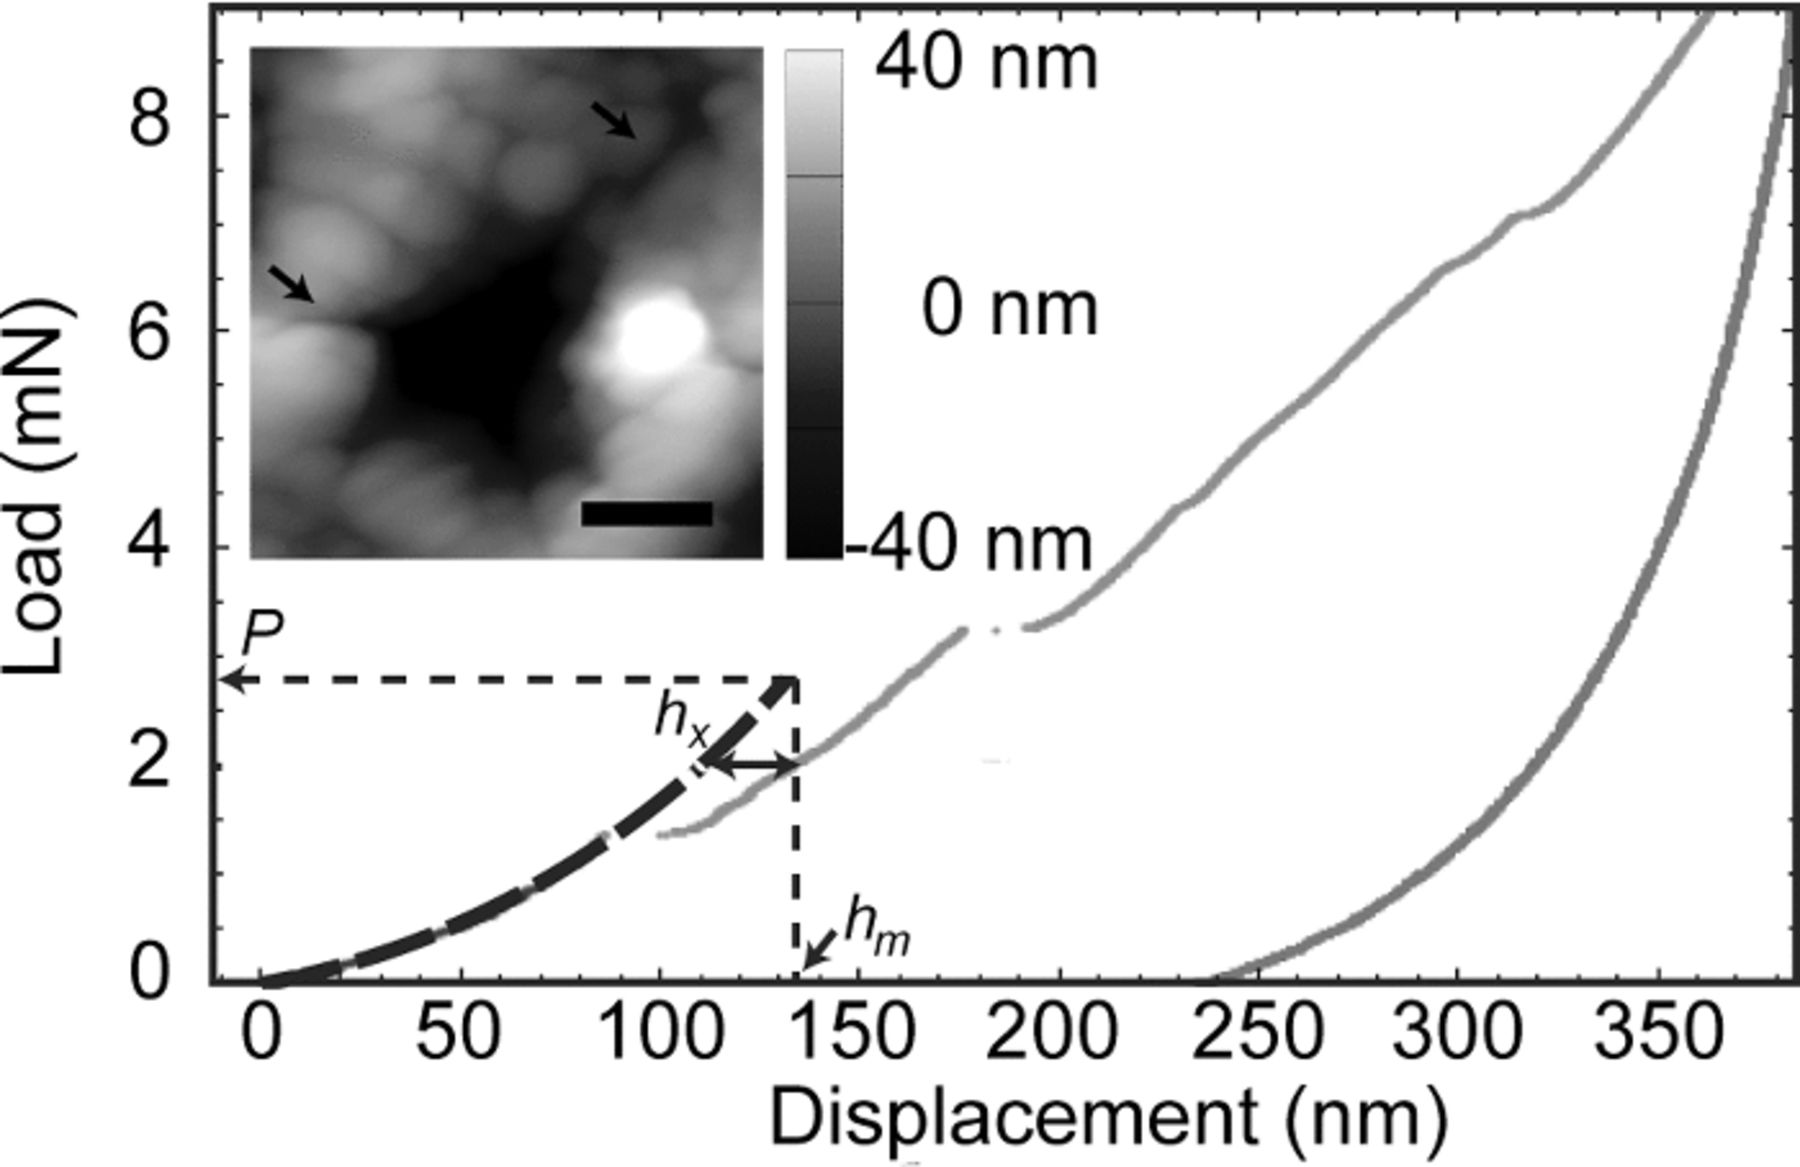
Figure 1. Indentation load-depth response, showing pop-ins and parameters hx, hm, and P used to calculate fracture toughness KIc. Inset shows an atomic force microscopy (AFM) contact mode image of an individual indent exhibiting radial cracks highlighted by black arrows. The scale bar is 1 μm.
In the present work, E, H, and KIc of individual grains within sintered pellets of LCO were measured via instrumented nanoindentation for several samples charged (delithiated) to varying degrees. The values of all three mechanical properties decreased significantly upon a single electrochemical half-cycle. The same properties were also measured for thermally shocked LCO, to distinguish changes in the measured properties due to microstructural damage, namely intergranular and transgranular fracture of the polycrystalline microstructure, from those due to compositional changes in electrochemically delithiated LCO.
Methods
Sample fabrication
Dense, polycrystalline LCO pellets were prepared from commercial, battery-grade LiCoO2 powder (AGC Seimi Chemical Co. Ltd, Kanagawa, Japan) by pressing ∼1.8 g of powder into a 1.3 cm-diameter die under an applied uniaxial compressive stress of 100 MPa. Pellets were sintered at 1060°C for 8 h with a heating rate of 9°C/min and furnace cooled, yielding an average grain diameter of ∼10 μm. To coarsen the grains further to obtain single crystallites that were large compared to the indentation volumes, the samples were fired a second time at 1090°C for 12 h with the same heating and cooling rates. The density of the pellets was found to be 4.80 g cm−3 (96% relative density), as determined by Archimedes' method in isopropanol. The grain size of the polished pellets was determined by a method similar to the lineal intercept procedure in ASTM Standard E112, but with fewer than 50 grains per line.
Coarsened samples were polished using silicon carbide sandpaper of decreasing grits (500, 800, 1200, 2400 and 4000) and diamond polishing pads (UltraPrep, Buehler Limited, Lake Bluff, IL); grit sizes of 3 μm, 1 μm, and 0.5 μm were used for the final polishing steps to achieve a mirror-like finish on the LCO surface. Samples were cleaned with water between each polishing step.
The polished pellets were used as the positive electrode in a Swagelok-type half-cell, with the polished face of the sample against the separator and the opposite side of the pellet against the current collector. The electrolyte was a blend of alkyl carbonates with 1.2 M LiPF6 salt, and all cells used 2 pieces of Tonen E20MMS separator and a Li metal (Alfa Aesar) negative electrode. To reduce contact resistance between the electrodes and the current collectors, the current collectors were coated with a compliant conductive binder that is a mixture of polyvinylidene fluoride (PVDF), carbon black (Ketjenblack ECP), and vapor grown carbon fiber (VGCF) in n-methyl-2-pyrrolidone (NMP). This binder was cured overnight at 120°C in a vacuum oven before transferring the current collectors to a glove box for cell assembly. Four pellets were charged on a MACCOR 4000 tester at a constant rate of 0.135 mA/g (equal to a charge-rate or C-rate of C/1000 assuming uniform charging of the entire sample and 135 mAh/g specific capacity) for durations of 50 (two pellets), 100, and 500 h. These samples will be referred to in the text by the duration of the charging process in units of hours (e.g., the pellet charged for 500 hours at the C/1000 charge rate will be denoted LCO-500). Samples were not re-polished after this electrochemical cycling, prior to indentation analysis, but were cleaned by sonication in acetone prior to indentation.
An identically prepared and polished LCO pellet was thermally shocked as a control; this sample is referred to hereafter as LCO-TS. A tube furnace (Lindberg/Blue M) was pre-heated to 950°C in air. The pellet was placed upon a bed of LCO powder in a high-alumina boat, and this boat was inserted to the center of the tube furnace and heated for 30 min. The boat was withdrawn and the pellet was observed to be glowing orange-red hot; it was immediately quenched in a hydraulic oil bath (∼3.8 L) held at room temperature (∼22°C). The sample was allowed to cool for 10 min in the bath, after which it was ultrasonically cleaned in acetone.
Materials characterization
Optical images of sample surfaces were collected using differential interference contrast (DIC, Nikon Eclipse L150). The DIC images were analysed to quantify microstructural surface damage using open-source image analysis software ImageJ.42 As intergranular cracking (i.e., along grain boundaries) was evident in charged samples and in LCO-TS, the extent of microstructural damage was quantified by measuring the lengths of cracked and uncracked grain boundaries. Intragranular cracking (i.e., emanating from a grain boundary to the grain interior) was also present, but due to the high variability of these features the quantification of intragranular crack lengths and numbers was much less precise. Grain orientation with respect to the indentation loading direction and relative misorientation among adjacent grains were not assessed.
The atomic force microscopy (AFM) height image in the inset of Fig. 1 was acquired in contact mode (Asylum Research MFP-3D, with Olympus AC160TS silicon cantilever of ∼9 nm tip radius), with pixel width of 19.4 nm.
X-ray diffraction (XRD) patterns were collected over a range of 2Θ = 15° to 80° using copper Kα tube-source radiation (PANalytical X'Pert Pro). Micro-Raman characterization was conducted using a Horiba LabRAM 800HR spectrometer with a 514 nm excitation source, 100X objective lens, and 80 s collection times.
Nanomechanical characterization
E, H, and KIc were measured in air via instrumented nanoindentation (Hysitron, Inc. Triboindenter, Minneapolis, MN) for 27–30 individual grains per sample within each sintered LCO pellet. Within each grain, sixteen load-depth hystereses were acquired to measure E and H up to a maximum load of 1.2 mN (below loads that would induce detectable cracking) and another sixteen indentations were acquired at a maximum load of 9 mN to measure KIc. Via an integrated optical microscope, all indentation grids were intentionally placed far from grain boundaries, such that the nearest indentation was ∼5 μm from the nearest visible grain boundary; this minimized potential for mechanical contributions from the grain boundaries to the measured properties.17 The resulting indentation depths (∼100–350 nm) were significantly less than the average grain diameter of ∼80 μm. Following Qu et al.,17 a diamond Berkovich indenter was used, with loading and unloading times of 10 s and a dwell period of 10 s at maximum load. Center-to-center indentation spacing for E and H indentations was 10 μm, while for KIc indentations the spacing was 20 μm. Reduced elastic moduli Er were calculated from the load-depth curves using the method of Oliver and Pharr,43,44 from which E was calculated using Equation 1 with an assumed Poisson's ratio ν of 0.3 for LCO, and the Ei and νi of the diamond probe at 1070 GPa and 0.07, respectively:17,38–41,45
![Equation ([1])](https://content.cld.iop.org/journals/1945-7111/161/11/F3084/revision1/jes_161_11_F3084eqn1.jpg)
Hardness H was calculated according to Equation 2, where A is the projected indentation contact area at the maximum load pmax:
![Equation ([2])](https://content.cld.iop.org/journals/1945-7111/161/11/F3084/revision1/jes_161_11_F3084eqn2.jpg)
Figure 1 illustrates the parameters used to calculate the fracture toughness of brittle materials from nanoindentation hystereses, according to the pop-in method of Field et al.38 The crack length c was determined according to Equation 3, where E and H were measured as described above for indentations at lower loads, and pop-in depth hm and length hx as defined in Fig. 1 were determined for each indentation according to a Hertzian fitting procedure using a custom Mathematica 7.0 (Wolfram) code:
![Equation ([3])](https://content.cld.iop.org/journals/1945-7111/161/11/F3084/revision1/jes_161_11_F3084eqn3.jpg)
The unitless prefactor Q was 4.55, following Refs. 17 and 38. Qu et al. previously confirmed that crack lengths calculated using Equation 3 were comparable to crack lengths measured using AFM imaging post-indentation, for uncharged LiCoO2.17 Figure 1 inset shows an example AFM height image of an indentation, with radial cracks indicated by arrows and confirmed via additional AFM, SEM, and focused ion beam (FIB)/SEM imaging (see Supplementary Material Figure S5). Load-depth hystereses that did not exhibit detectable pop-in displacements up to the maximum load of 9 mN were excluded from further analysis, such that there were 5 to 16 replicate indentations used to determine KIc in each grain according to Equation 4:
![Equation ([4])](https://content.cld.iop.org/journals/1945-7111/161/11/F3084/revision1/jes_161_11_F3084eqn4.jpg)
where P is defined in Fig. 1 and the unitless prefactor k was 0.036.17,38 The assumed magnitude of k can range from 0.036 for a cube-corner indenter to 0.018 for a Vickers indenter, with various possible adjustments as a function of equivalent cone angle, number of sides, etc.38–41
Data for E, H, and KIc for each sample are reported as the mean ± the standard error of the mean measured for the 27–30 individual grains for each sample. See Section 1 of the Supplementary Material for discussion of the non-normal distribution of KIc. Differences among samples in the mean mechanical properties were considered according to p-values derived from Student's t-test; see Supplementary Material (Section 2). Results of further nanoindentation of sample cross-sections are provided in Section 3 of the Supplementary Material.
Results and Discussion
Upon electrochemical delithiation, the measured values of E and H decreased significantly, as shown in Fig. 2a–b. E decreased by over 40%, while H decreased by over 50% for all charged samples. Interestingly, E and H did not decrease significantly with further charging; LCO-500 exhibited similar mechanical properties to LCO-50 despite being charged for ten times as long. These same trends are apparent in Fig. 2c, which shows that KIc decreased by more than 60% at the minimum level of electrochemical charging, and also remained nearly constant for all longer charge durations (lower Li content). From the results described below, we propose that this dramatic reduction in these mechanical property values can be attributed to a combination of chemical expansion and phase changes due to Li depletion within the near-surface volume sampled by nanoindentation.
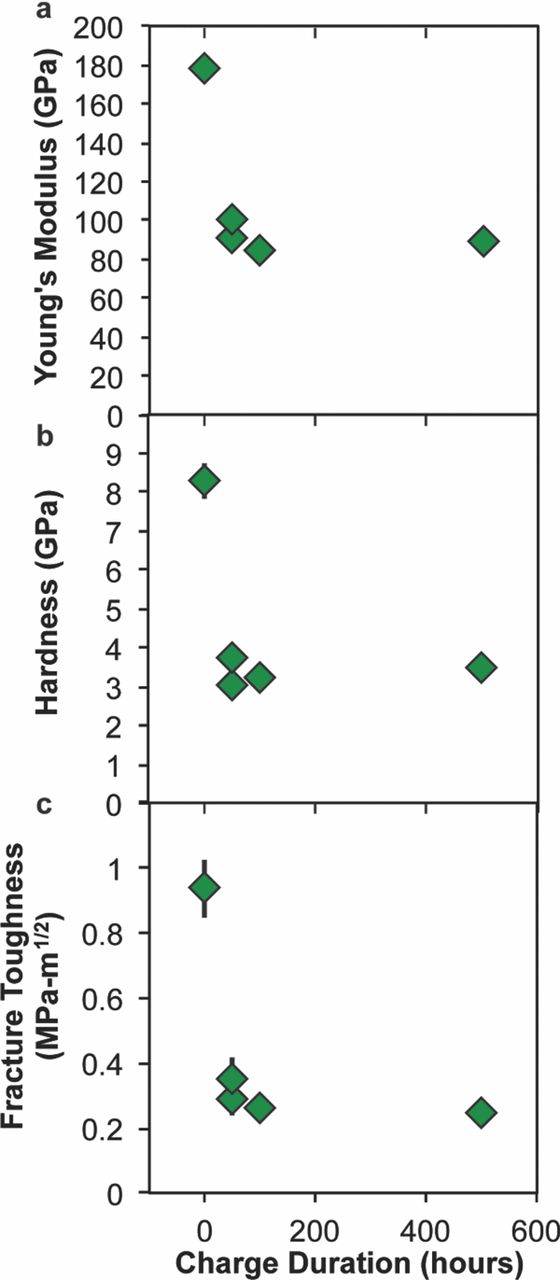
Figure 2. (a) Young's modulus and (b) hardness are each plotted against charge duration in the first charge-cycle of LiXCoO2 samples. After even the smallest charge duration (50 hours at rate C/1000), a significant decrease is observed for both properties. (c) Fracture toughness KIc as a function of first-cycle charge duration as determined by the pop-in method. After the smallest charge duration, the fracture toughness has decreased by about 70%. Error bars are standard error of the mean.
E for the uncharged LCO grains was 177 ± 4 GPa and H was 8.3 ± 0.5 GPa. The mean KIc of these LCO grains was 0.9 ± 0.1 MPa-m1/2, with a median magnitude of 0.8 MPa-m1/2. The present results for E, H, and KIc of the uncharged LCO sample are in good agreement with the previously reported results of Qu et al.17 (see Supplementary Material, Section 4).
The reduction in KIc observed for electrochemically charged samples correlated with extensive microstructural damage of LCO surfaces. Figure 3 displays both quantitatively and qualitatively the significant grain boundary cracking near the free surface of all the electrochemically charged samples. This microstructural damage is quantified in Fig. 3a as the percentage of grain boundary length exhibiting intergranular cracking (for a fixed image surface area), determined from DIC images of sample surfaces as shown in Fig. 3b–e. Intergranular cracking was evident for 50% of grain boundary length in LCO charged for 50 h (LCO-50), as compared to only 10% of grain boundary length in uncharged LCO (LCO-0) but further increases in charge duration caused only modest increases in this observed microstructural damage. Figure 3f shows a cross-section of LCO-500, in which cracking occurred only over a depth of ∼70 μm from the free surface; the interior of the sample displayed no identifiable intergranular cracking. This trend was also observed in cross-sectional imaging of LCO-50. Because surface cracking and delithiation occurred concurrently, an additional experiment was conducted to decouple the contribution of each to the observed decreases in mechanical properties.
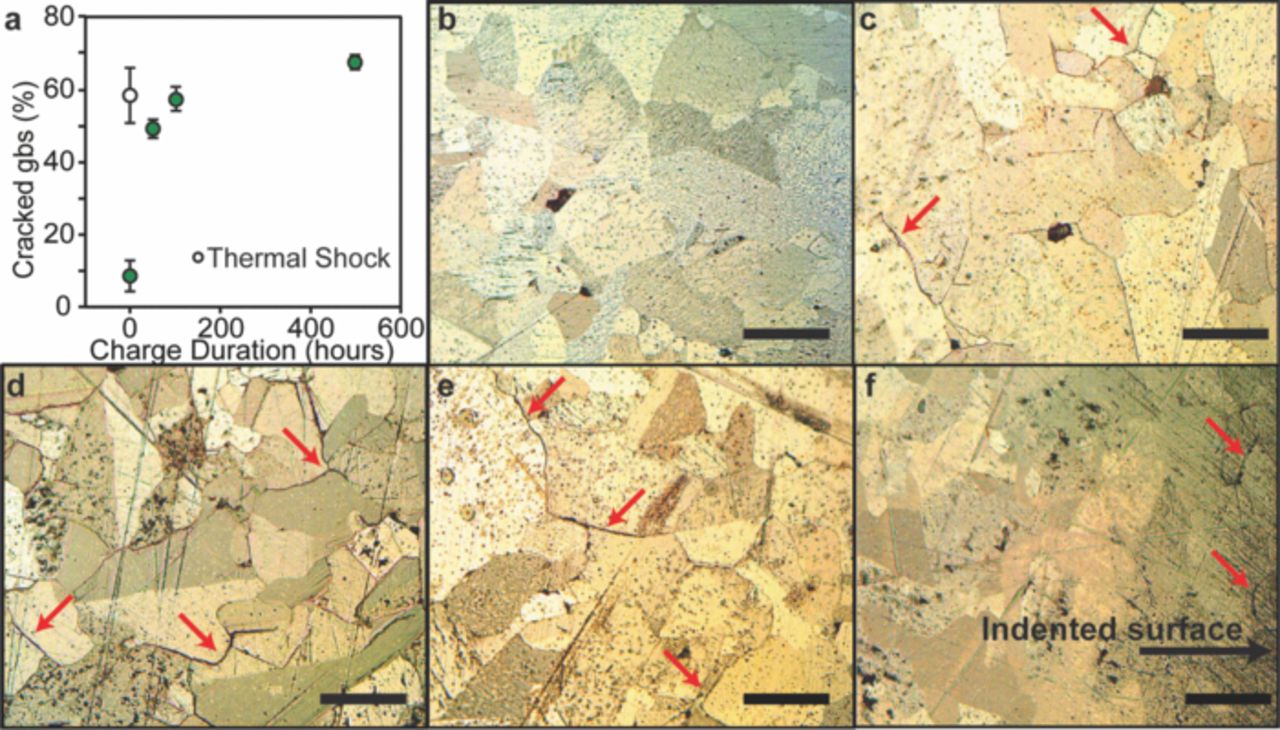
Figure 3. Grain boundary cracking appears on sintered pellet surfaces after electrochemical cycling in LiXCoO2 (LCO). (a) Electrochemically charged samples show increased grain boundary (gb) cracking as compared to uncharged LiCoO2. Differential interference contrast (DIC) images of the indented surface of (b) LiCoO2 (LCO-0) (c) LCO-50 (pellet charged at C/1000 for 50 h), (d) LCO-500, and (e) thermally shocked LiCoO2 (LCO-TS). (f) DIC image of a cross section of LCO-500, showing grain boundary cracks near the polished surface. Red arrows highlight cracking between grains. Scale bars are 100 μm.
Here, we considered the possibility that intergranular (or the less pronounced intragranular) cracking could alter the far-field boundary conditions on the indentations, due potentially to either extension of such cracks in the charged samples under indentation loading or to indentation-induced grain sliding. Accordingly, to isolate the effect of microstructural damage in the absence of Li depletion, nanoindentation testing was conducted on the thermally shocked sample of LCO (LCO-TS). The surface of LCO-TS displayed intergranular cracking comparable to the electrochemically charged samples, as shown in Fig. 3a. However, E of LCO-TS decreased by less than 10% relative to the uncharged sample (see Table I). This decrease had a p-value of 0.027 and was much less than the reduction in E of 40–55% found for all charged samples. Similarly, H upon thermal shock decreased modestly (by 17%, p = 0.071) relative to the uncharged LCO, while H in response to electrochemical charging decreased by 45–70%. Similarly, KIc of the thermally shocked sample did not differ significantly from the uncharged sample, retaining a mean value of 1.0 MPa-m1/2 (p = 0.60). Note that thermal shock produced similar levels of grain boundary cracking and microstructural damage (Fig. 3a, e) in the absence of any electrochemical shock. Thus, microstructural damage alone cannot account for the degraded stiffness, hardness, and fracture toughness observed in the electrochemically charged grains. Therefore, both the observed decreases in E, H, and KIc and the observed intergranular cracking in charged samples can be attributed plausibly to the electrochemically induced Li nonstoichiometry.
Table I. Mechanical properties of electrochemically charged and thermal shocked LiXCoO2.
| Sample | Elastic Modulus (GPa)a | Hardness (GPa)a | Fracture Toughness (MPa-m1/2)a |
|---|---|---|---|
| LCO-0 | 178 ± 5 | 8.3 ± 0.5 | 0.94 ± 0.09 |
| LCO-50 | 100 ± 3 | 3.1 ± 0.2 | 0.29 ± 0.03 |
| LCO-50 (2) | 92 ± 3 | 3.8 ± 0.1 | 0.35 ± 0.07 |
| LCO-100 | 85 ± 3 | 3.3 ± 0.1 | 0.26 ± 0.03 |
| LCO-500 | 89 ± 3 | 3.5 ± 0.1 | 0.25 ± 0.03 |
| LCO-TS | 161 ± 5 | 6.9 ± 0.5 | 1.04 ± 0.1 |
Note that E, H, and KIc were sensitive to whether the LCO was uncharged or charged, but insensitive to the duration of electrochemical charging. This apparent insensitivity to charge duration can be understood as the result of a similar composition near the free surfaces of all charged samples. Electrochemical charging of polycrystalline samples of mm-scale thickness presents the possibility of non-uniform composition across the total sample thickness. Because lithium removal occurred preferentially through a single external surface—the free surface facing the separator during electrochemical cycling, which was subsequently indented—the structure and composition of the samples had the potential to be non-uniform through the thickness. In fact, Figure 4 summarizes characterization of the sample surfaces via XRD and Raman spectroscopy, which together indicated that the sample surfaces were all overcharged (i.e., Li-poor) compared to the volume-averaged or bulk composition. The inset of Fig. 4a also shows a representative optical micrograph of the sintered polycrystalline samples, for which we quantified an average grain diameter of 70–85 μm.
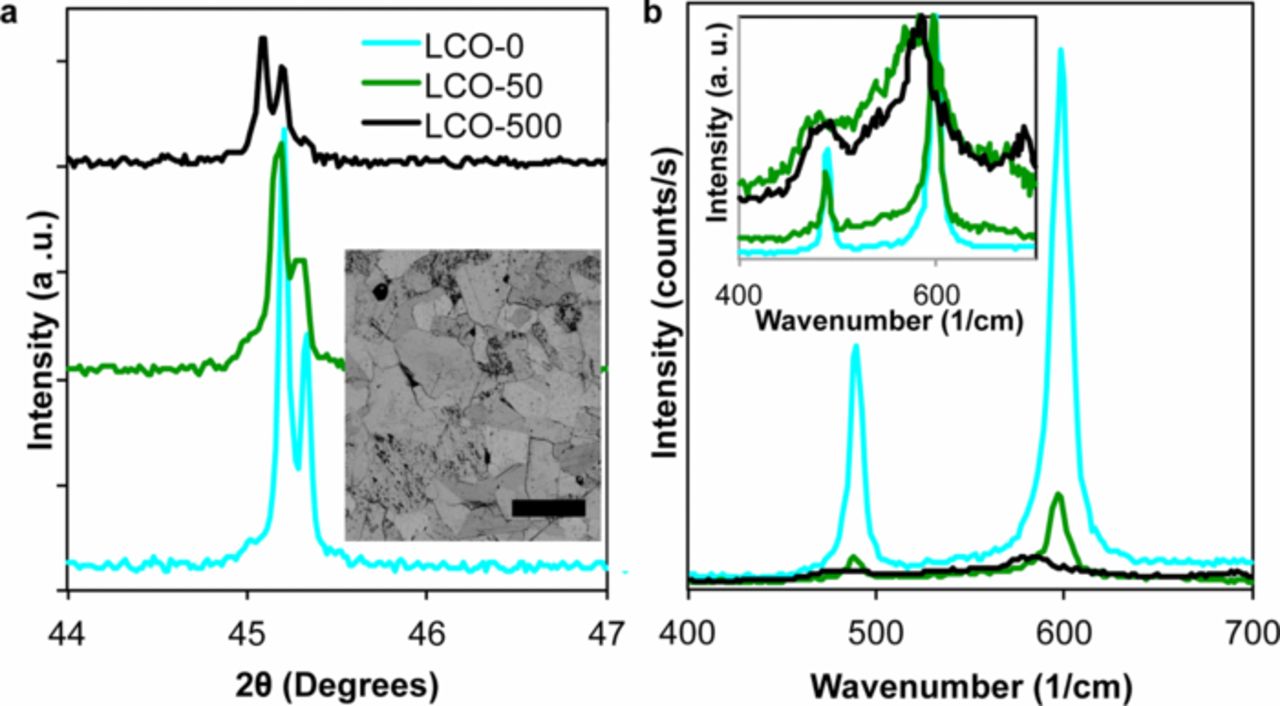
Figure 4. (a) (104) X-ray diffraction (XRD) Bragg peak and (b) Raman spectra for three compositions of LiXCoO2 (LCO). XRD patterns show a peak shift at 45° as a result of chemical expansion with decreasing Li content. Inset to (a) shows an optical microscope image of LCO-500 (pellet charged at C/1000 for 500 h), showing grain sizes averaging around 80 μm. The scale bar is 200 μm. (b) Raman spectra show a significant loss of intensity upon electrochemical charging as well as a shift in peak positions (inset to (b), showing normalized spectra). For LCO-50, two spectra are shown in the inset to (b) representative of shifted and non-shifted spectra observed in different regions of the sample.
The crystal structure of all LCO samples was confirmed by XRD to be that expected from established phase diagrams. Lattice parameter variation upon electrochemical charging was also confirmed from the XRD patterns, as illustrated by the downshift in the position of the (104) Bragg peak (2θ ≈ 45°) in Fig. 4a.34 Quantification of these peak shifts for LCO-50 and LCO-500 indicated compositions of LiXCoO2 at X = 0.71 and X = 0.6, respectively, over the X-ray sampling depths of ∼9 μm; this sampling depth was estimated via the automated mass attenuation coefficient calculator (PANalytical HighScore Plus). These compositions are within the range (1.0 ≤ X ≤ 0.5) accessed during normal electrochemical cycling of practical LCO-based electrodes.
The local Li content at the free surfaces of LCO-50 and LCO-500 was assessed at 0.6 ≤ X ≤ 1 and X ≤ 0.6, respectively, by Raman spectroscopy. Stoichiometric (X = 1) LCO has two Raman-active modes: A1g and Eg at 596 and 486 cm−1, respectively. Upon lithium deintercalation, both Raman peaks decreased in amplitude, and near X = 0.6 they shifted discontinuously to lower wavenumber.37,46,47 This behavior can be attributed to decreased laser penetration depth as a result of the first-order Mott transition between trigonal phases at X = 0.95 and X = 0.75, and/or to the emergence of the monoclinic phase via a second-order phase transformation at approximately X = 0.6.35,36,47 Figure 4b shows the Raman spectra for LCO-0, LCO-50, and LCO-500, indicating a decrease in peak intensity with increasing charge duration. The observed peak shift occurred in all spectra collected for LCO-500, and both the shifted and unshifted spectra were observed for LCO-50, as highlighted in the inset of Fig. 4b. This interpretation of Raman spectra suggests, consistent with the XRD results, that within the Raman sampling depth of ∼1 μm, the surface of LCO-500 had a Li content of X ≤ 0.6, and that LCO-50 had a composition between X = 0.6 and X = 1. The indentation plastic zones are estimated at several μm for the indentation depths and indenter geometries employed herein, and are comparable to the sampling depths of Raman spectroscopy and XRD. Thus, nanoindentation measurements made on sample surfaces reflect the mechanical properties of LCO compositions that are more Li-deficient than the nominal (i.e., uniform bulk) compositions expected from electrochemical charging at C/1000 for the different durations. See Supplementary Material Sections 5–8 for additional discussion of XRD, Raman, and scanning electron microscopy characterization of sample surfaces and imaging of radial cracks at individual indentations, and Section 3 for mechanical property measurements of sample interiors.
Together, these results suggest that electrochemical charging of LCO resulted in significant reduction in E, H, and KIc that is attributable to severe depletion of Li at the grain surface, associated with chemical expansion and phase transitions. Li deintercalation from LCO leads to expansion of the layered structure along the c-axis crystallographic direction (normal to the layers) and contraction within the a-b plane (within the layers), resulting in an overall volume increase of 1.9% when charging to the composition Li0.5CoO2.34 Additionally, the trigonal-to-monoclinic phase transition may result in differing mechanical properties of the material after significant charging, as compared to uncharged LCO. Further, in nonstoichiometric materials, increased bond lengths are correlated to decreased Young's elastic moduli,31 which can also correlate with decreased KIc. Additionally, residual stresses could plausibly develop due to coherency stresses at the interfaces between Li-rich and Li-poor phases, or due to compatibility stresses at the grain boundaries; LiCoO2 grains undergo anisotropic shape changes.48 Although we did not assess relative grain misorientation or residual stress, tensile residual stress would be expected to exhibit lower fracture toughness. Ultimately, these atomic-scale modifications as a function of Li content X also manifested as intergranular fracture at the electrochemically charged surfaces of the polycrystals. However, comparison to thermally shocked LCO of similar microcracking extent but unchanged fracture toughness showed that microcracking alone was not the source of the decreased mechanical property values within the LCO grains.
The dense monolithic electrodes used in the present work are not intended to serve as practical battery electrodes, but to enable measurement of mechanical properties at the level of individual grains with high precision. Nevertheless, the observed dependency of mechanical properties on Li content informs the design of practical electrodes. The unique electrode architecture that enabled our nanomechanical analysis also exacerbated the observed surface overcharging, which we expect to be less pronounced in practical electrodes comprised of active material particles (single or polycrystalline) of 10s of μms in diameter. Surface overcharging of the dense polycrystalline pellets of mm-scale thickness could have resulted from ion transport limitations that would be eased in smaller volumes with similar electrochemical histories. Concentration gradients in these samples can be more severe because of the highly-composition dependent ionic and electronic transport properties of LCO, particularly with this dense monolithic microstructure that requires all ionic transport to occur through LCO. Additionally, the first-order phase-transformation that occurs between compositions 0.95 ≥ X ≥ 0.75 may also exacerbate composition gradients; due to the nearly one-dimensional cell geometry used herein, this phase transformation would nucleate on the sample surface with a phase boundary separating Li-rich and Li-poor LCO phases. In normal battery electrodes, uniform electrochemical reactivity throughout the thickness of the electrode is facilitated by limiting electrode thickness to ∼100 μm, adding conductive materials to form composite electrodes, and having open porosity infiltrated with liquid electrolyte. Well-engineered composite electrodes would not experience the same solid-phase concentration gradients we observed. However, the total range of compositions over which we characterized the mechanical properties (0.6 ≤ X ≤ 1) is representative of normal cycling limits for LCO and other layered compounds. Therefore, the measured changes in mechanical properties between the discharged and charged states expand our understanding of the behavior of practical electrodes. Given the marked reduction in elastoplastic and fracture properties that we report, these variations should be taken into account in the design of mechanically robust electrodes.
Anisotropic chemical expansion and phase transformations in LCO and other intercalation compounds can generate stresses sufficient to drive electrochemical shock, often manifested as grain boundary fracture in layered materials such as LCO.4,10,14,48 This process is depicted schematically in Figure 5a. Design criteria for mechanically robust electrodes have been developed, but typically under the assumption of composition-independent mechanical properties. Figure 5b shows a schematic electrochemical shock map,48–51 which is a graphical summary of such design criteria. The horizontal axis of the electrochemical shock map is a representative microstructural length scale (particle size or grain size) and the vertical axis is the electrochemical cycling rate (C-rate); for convenience both axes are logarithmic. The lines on the map are drawn for constant KIc and serve to visually separate the conditions for which catastrophic fracture due to electrochemical shock is possible or not possible. Above and to the right of a failure line, fracture is possible; below and to the left of the failure line, it is not. The sloping portion of the failure line corresponds to fracture due to concentration gradient stresses, which are C-rate dependent;49,50,52 the vertical segments correspond to C-rate independent electrochemical shock mechanisms, for example the failure of a polycrystalline aggregate due to anisotropic shape changes of the individual grains48 or coherency stresses accompanying a first-order phase transformation.49,51 For each of the latter mechanisms, stresses develop in response to the overall composition change, not in response to the rate of cycling. The failure lines for two different magnitudes of KIc —1.0 MPa-m1/2 and 0.3 MPa-m1/2—are shown in Fig. 5b. These values are representative of the decrease in KIc that we observed in LCO upon charging over a single half-cycle, and illustrate how the observed reduction in KIc changes the predicted critical length scale below which fracture is averted. This schematic takes into account the composition-dependency of KIc, but additional effects will arise due to more complex stress states in materials with composition-dependent elastoplastic properties.33
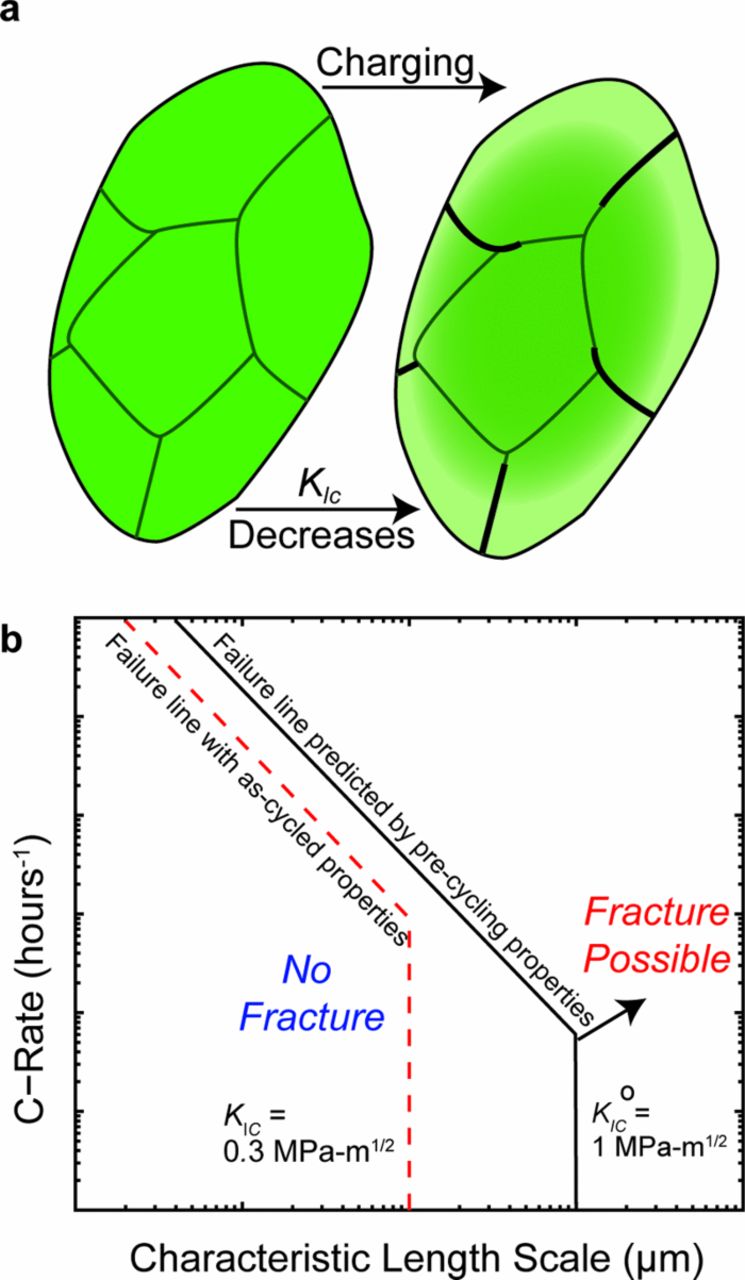
Figure 5. (a) LiXCoO2 particles before and after electrochemical charging will exhibit an overall decrease in average composition (indicated by color change), and a larger decrease in Li content close to the particle surface. The surface is a phase-changed region, which has significantly reduced fracture toughness. The appearance of grain-boundary cracking can be expected to develop after electrochemical charging within the severely Li-depleted region. The required characteristic length (particle or grain size) to avoid fracture due to electrochemical shock at a given C-rate and fracture toughness KIc is shown in the electrochemical shock map (b). The length scale required when one takes into account the as-cycled fracture toughness is smaller than that predicted based on uncharged material properties.
Conclusions
Decreases in E, H, and KIc of 40, 50, and 60%, respectively, were observed after electrochemical charging of LiXCoO2 surfaces to X ≤ 0.71. Comparison to a thermally shocked sample, along with XRD and Raman analyses, showed that this change is related primarily to chemical expansion and phase changes occurring upon lithium content reduction, and is not exclusively the result of microstructural damage which occurred concurrently in the polycrystalline samples. These dramatic changes in elastoplastic and fracture properties occur within the normal electrochemical cycling window of LiXCoO2, and therefore the design of mechanically robust electrodes should consider that the mechanical properties of the active compound can deviate significantly from those reported for uncharged compounds within even a single electrochemical charge cycle.
Acknowledgments
This work was supported by the U.S. Department of Energy, Basic Energy Sciences, Division of Materials Science and Engineering under award number DE-SC0002633. J. Swallow acknowledges support from the DOE-SCGF Fellowship Program administered by ORISE-ORAU under contract no. DE-AC05-06OR23100. F. McGrogan acknowledges support from the MIT Salapatas Fellowship. We thank Alan Schwartzman of the MIT Nanolab for valuable assistance with nanomechanical testing and access to the optical microscope, J.C. Grossman for access to the Raman spectrometer, W.F. DiNatale for assistance with and access to the focused ion beam (FIB), as well as J.M. Maloney, W. C. Carter, B. Yildiz, and H. Tuller for valuable discussions. This work made use of the MRSEC Shared Experimental Facilities at MIT, supported by the National Science Foundation under award number DMR-08-19762. Electron microscopy imaging was conducted in part at the Harvard University Center for Nanoscale Systems (CNS), a member of the National Nanotechnology Infrastructure Network (NNIN), which is supported by the National Science Foundation under NSF award no. ECS-0335765. FIB milling was conducted at the Institute for Soldier Nanotechnology (ISN) at MIT with funding by the Army Research Office.