Abstract
Enhancement of the specific capacitance in electrochemical double layer capacitors (EDLCs) is of high interest due to the ever increasing demand for high power density energy storage devices. Zeolite templated carbon (ZTC) is a promising EDLC electrode material with large specific surface area and straight, ordered well-defined micropores. In this study, ZTC samples were synthesized using a low pressure chemical vapor deposition (LP CVD) of carbon on sacrificial zeolite Y powder using acetylene gas as a precursor. We demonstrate for the first time how various post-treatments of the produced samples can affect the ZTC microstructure and porosity and how such modifications may significantly improve electrochemical performance characteristics of the ZTC-based EDLC electrodes. The effects of CO2 activation, ball milling and high temperature annealing process were systematically studied. The best performing samples achieved very large capacitance of over 240 Fg−1 at 1 mVs−1 in 1 M solution of tetraethylammonium tetrafluoroborate in acetonitrile and stable performance in symmetric EDLC devices with no noticeable degradation for over 20,000 cycles at a very high current density of 20 Ag−1.
Export citation and abstract BibTeX RIS

This is an open access article distributed under the terms of the Creative Commons Attribution Non-Commercial No Derivatives 4.0 License (CC BY-NC-ND, http://creativecommons.org/licenses/by-nc-nd/4.0/), which permits non-commercial reuse, distribution, and reproduction in any medium, provided the original work is not changed in any way and is properly cited. For permission for commercial reuse, please email: oa@electrochem.org.
Electrochemical double layer capacitors (EDLCs), also called supercapacitors and ultra-capacitors, have attracted extensive attention as EDLCs can provide high power delivery or update, high cycle efficiency, thermal stability, practically unlimited cycle life and relatively low cost of manufacturing.1 Furthermore, a wide operational temperature range and a relatively easy determination of the state of charge can be considered as additional advantageous aspects.1 Hence, there is an increasing growth in demand for EDLCs in industrial equipments, electronic devices, transportation market, and automotive applications.1–5 Yet, significantly smaller energy density (ca. 5 Wh kg−1) compared to the state of art rechargeable Li ion batteries (ca. 180 Wh kg−1) urgently calls for improvement in capacitance of EDLCs.6,7 In addition, for some applications it is crucial to further increase the charge-discharge rate capability without deteriorating energy density characteristics.1
The value of the double layer capacitance formed at the electrode/electrolyte interface (which directly impacts the energy density of EDLCs) is believed to depend on multiple factors, such as specific surface area (SSA) of the electrically conductive porous carbon electrodes,1,8–11 pore size distribution (PSD) of the carbon electrodes (which may affect both the pore access by electrolyte ions and the solvation shell distortion and the resulting pore wall – ion separation distance),1,3,9,12 electron density of states in carbon (which may affect the capacitance of the electrode side of the double layer),13 electrolyte-carbon interfacial energy (which may affect electrolyte wetting in both large and sub-nm sized pores),14,15 electrolyte-carbon interactions (which may impact electron density of states in carbon),16 the presence of doping species within carbon (which may impact interactions with electrolyte and additionally affect the carbon density of states),16–18 carbon microstructure, including the concentration of various defects and the fraction of the edge graphene planes exposed to electrolyte (which similarly affect the electron density of states and carbon-ion separation distance),19,20 and the presence of functional groups (which may affect the carbon-electrolyte interactions, induce so-called pseudocapacitance, affect the carbon density of states and wetting the smallest pores by electrolyte)1 and others.
The power performance of an EDLC strongly depends on the mobility of ions within electrode pores.1 The ion transport, in turn, similarly depends on the PSD (due to ion clogging within the smallest bottle-neck pores),21–24 on the carbon microstructure and functional groups (due to the interactions between electrolyte ions and carbon surface, which may increase the activation energy for ion diffusion and slow down ion transport)19 and the degree of pore alignment (due to the longer actual diffusion distance and, more importantly, reduced ion mean free path in highly curved pores).25
While larger pores may allow faster ion transport, their presence reduces electrode density and thus negatively affects volumetric energy storage characteristics. Similarly, while doping, formation of functional groups and defects within carbon may increase carbon capacitance, it may negatively impact other EDLC performance characteristics, for example, induce faster self-discharge and slow down ion transport rate.26,27 One of the straightforward strategies to improve both the energy density and power density of EDLC relies on developing electrode materials with large SSA, tailored pore size distribution and straight pores with low tortuosity.
In spite of the significant research in ELDCs based on mesoporous carbons, such as carbon fibers,28–30 single- and multi-walled carbon nanotubes,19,31–33 carbon onions,19,27,34–37 carbon aerogels38,39 and graphene,40–42 microporous carbon powders will likely remain a material of choice for the vast majority of commercial EDLC applications due to their higher volumetric capacitance, easier processing into thick electrodes and most commonly lower cost.1,43,44
Among microporous carbons, advanced activated carbons (AC)1,44–50 and carbide derived carbons (CDC)8,51–57 have been investigated the most. At the same time, microporous zeolite templated-carbons (ZTCs) pioneered by Kyotani et al. received significantly smaller attention.25,58–64 If properly synthesized, such materials may feature three dimensionally interconnected aligned micropores obtained after depositing a carbon monolayer on the low-cost zeolite template and the subsequent chemical etching of zeolite.65 The resultant large SSA and straight, fine-tuned pores of ZTC originate from the well-defined nanospace of the original zeolite templates.65
We have previously demonstrated that in aqueous electrolytes increasing the pore alignment in ZTC allows for up to three orders of magnitude increase in the rate performance of EDLCs with simultaneous increase in the specific capacitance to a very impressive ∼300 F g−1.25 In organic electrolytes, similarly produced ZTCs showed noticeably better rate performance than ACs and most CDCs, particularly at lower temperatures (down to – 70°C).63 However, the overall performance characteristics were more moderate with specific capacitance up to ∼140 F g−1 and significantly slower response.63
Herein, we present our systematic efforts to tailor morphological properties of ZTCs and enhance their electrochemical behavior by both tuning ZTC synthesis conditions and employing various post-treatments. These efforts are built on our previous work, where we demonstrated the ability of a low-pressure chemical vapor deposition (LPCVD) of carbon to reproducibly synthesize ZTC samples with greatly improved particle-to-particle and through-particle uniformities.66
Experimental
Synthesis of ZTC
A low pressure (1∼10 Torr) CVD using a simple hydrocarbon (acetylene, C2H2) was employed for depositing carbon onto the zeolite surface.66 During deposition ∼3 g of Zeolite Y powder (CBV100, Zeolyst International, Delfzijl, Netheraland) was placed in a 4.5 inch quartz boat, which was loaded inside of a quartz tube (1.2 inch diameter, 2 ft length) furnace (21100, Barnstead Thermolyne, USA). The zeolite was first heated to the desired temperature (700, 800 or 900°C) under an Ar gas flow. Once the temperature was stabilized, Ar flow was halted and acetylene gas was then allowed to flow at 100 sccm for desired time. After the deposition, acetylene flow was halted and Ar flow passed through the tube to avoid any possible formation of surface groups at high temperature while the furnace was cooled down for retrieval. Selected samples were additionally post-annealed under Ar. Subsequently, the carbon coated zeolite powder was submerged in a 10 wt% hydrofluoric acid (HF) solution for 24 hours to remove the zeolite template, and rinsed-off using a vacuum filtering system using a asymmetric polyethersulfone (PES) membranes (VWR, USA). Remaining impurities were removed by 50 wt% sulfuric acid and followed by repeated rinsing-off and drying under vacuum for 12 hours. Selected samples were ground by ball milling before etching the zeolite template. In these experiments, the samples were put together with 12 of 6 mm diameter stainless steel balls (Across International, USA) into a 50 ml vacuum jar (Across International, USA) assembled in an Ar-filled glove box (Innovation Technology, USA). A ball milling tool capable to control the rotating speed (QM-3SP04 Planetary Ball Mills, USA) was used to mill the samples for a desired time. Physical activation was performed on selected samples. For these experiments, the ZTC powders were heated to a desired temperature (700–900°C) in the furnace under Ar flow at a rate of 300 mL min−1. Once the target temperature was achieved, the Ar flow was halted and CO2 gas (99.9%, Air Gas, USA) was flowed at a rate of 150–300 mL min−1.
Electrochemical characterizations
ZTC powders were mixed with polytetrafluoroethylene (PTFE) as a binder in the ratio of 9:1 to prepare freestanding electrodes. The mixed and dried carbon-PTFE composite was then roll pressed to be a ∼200 μm thickness film. The produced electrode was dried in a vacuum oven at 100°C for at least 12 hours to remove any moisture left in porous carbons and cut into 1/2 inch diameter circles. The final electrode mass was around 6 mg. Coin cells were assembled inside an Ar-filled glove box (Innovation Technology, USA). Two symmetrical electrodes were separated by two overlapped 25 μm thick Gore PTFE separators (W.L. Gore and Associates, USA) and each electrode was attached to Al current collectors. Current collectors were prepared by spray coating of a thin layer of conductive graphite slurry (BW 525, Superior Graphite, USA) on a 300 μm thick Al foil to reduce interfacial resistance.67 1 M tetraethylammonium tetrafluoroborate (TEABF4) solution in acetonitrile (AN) solution was employed as electrolyte. Cyclic voltammetry (CV) measurements were recorded using a Solartron 1480A MultiStat (Solartron Analytical, UK) in the voltage range –2.3 V to +2.3 V with scan rates of 1 to 500 mV s−1. The carbon specific capacitance, C (F g−1), was calculated according to:
![Equation ([1])](https://content.cld.iop.org/journals/1945-7111/162/5/A5070/revision1/jes_162_5_A5070eqn1.jpg)
where I is the current (A), dV/dt is the scan rate (V s−1), and m is the mass (g) of carbon in each electrode. Charge-discharge (C-D) characteristics were recorded using an Arbin battery/supercapacitor electrochemical tester (Arbin Instruments, USA). Elecrochemical impedance spectroscopy (EIS) measurements were carried out using a Gamry reference 600 potentiostat (Gamry Instruments, USA) in the frequency range of 1 mHz – 100 kHz with a 10 mV AC amplitude. The gravimetric capacitance, C (F g−1), was calculated from EIS data according to Eqn. 2, where f is the operating frequency (Hz), Im(Z) and Re(Z) are the imaginary and real parts of the total device impedance (Ohm), and m is the mass (g) of carbon in each electrode.
![Equation ([2])](https://content.cld.iop.org/journals/1945-7111/162/5/A5070/revision1/jes_162_5_A5070eqn2.jpg)
Material characterizations
A field emission scanning electron microscope (FE-SEM, Zeiss Ultra60 FE-SEM, Germany) and a transmission electron microscope with scanning mode capability (Tecnai G2 F30 TEM, FEI, Netherlands) were employed for observing the structural and morphological features. Crystal structures were studied using X-ray diffraction (XRD) measurements collecting peaks from 2 Θ = 2° to 70° with a step size of 0.02°. The N2 adsorption isotherms were measured at –196°C using TriStar II 3020 surface area and porosity analyzer (Micromeritics Instrument Corporation, USA). Prior to the measurement the powder samples were degassed at 300°C for at least 4 hours using VacPrep 061 Degasser (Micromeritics Instrument Corporation, USA). The specific surface area (m2 g−1) was calculated using the Brunauer, Emmett, and Teller (BET) method. The pore size distribution (PSD) was determined via the density functional theory (DFT) methods using nitrogen adsorption data. Raman spectra were acquired using a Nicolet Almega XR spectrometer (Fisher scientific, usa) with an excitation wavelength of 488 nm.
Results and Discussion
Influence of ZTC synthesis conditions
In our initial studies we evaluated the influence of the temperature of carbon deposition on zeolite because it was expected to strongly affect the microstructure of a produced ZTC.66 Figures 1a–1c show the SEM images for the ZTC (after etching the zeolite template) at carbon deposition temperatures of 700, 800 and 900°C. We see that while the 700°C (and to a slightly less extent 800°C) deposition yielded very uniform carbon particles precisely replicating the shape of the zeolite templates, the deposition at 900°C resulted in ZTC having irregularly rough surface originating from collapsing the ZTC particles during zeolite etching. Accelerated decomposition of acetylene gas at such a high temperature evidently deposited carbon mostly on the outer surface of the template. The surface reactivity was so high that the LPCVD process was limited by the diffusion kinetics instead of the surface reaction and the precursor molecules (acetylene) did not have sufficient time to diffuse into the micropores of zeolite particles prior to decomposition. Not surprisingly, such samples exhibited the smallest specific capacitance (Fig. 1d), while the carbon produced at 700°C showed the best overall performance. For this reason, carbon deposition temperature was fixed at 700°C for the following experiments.
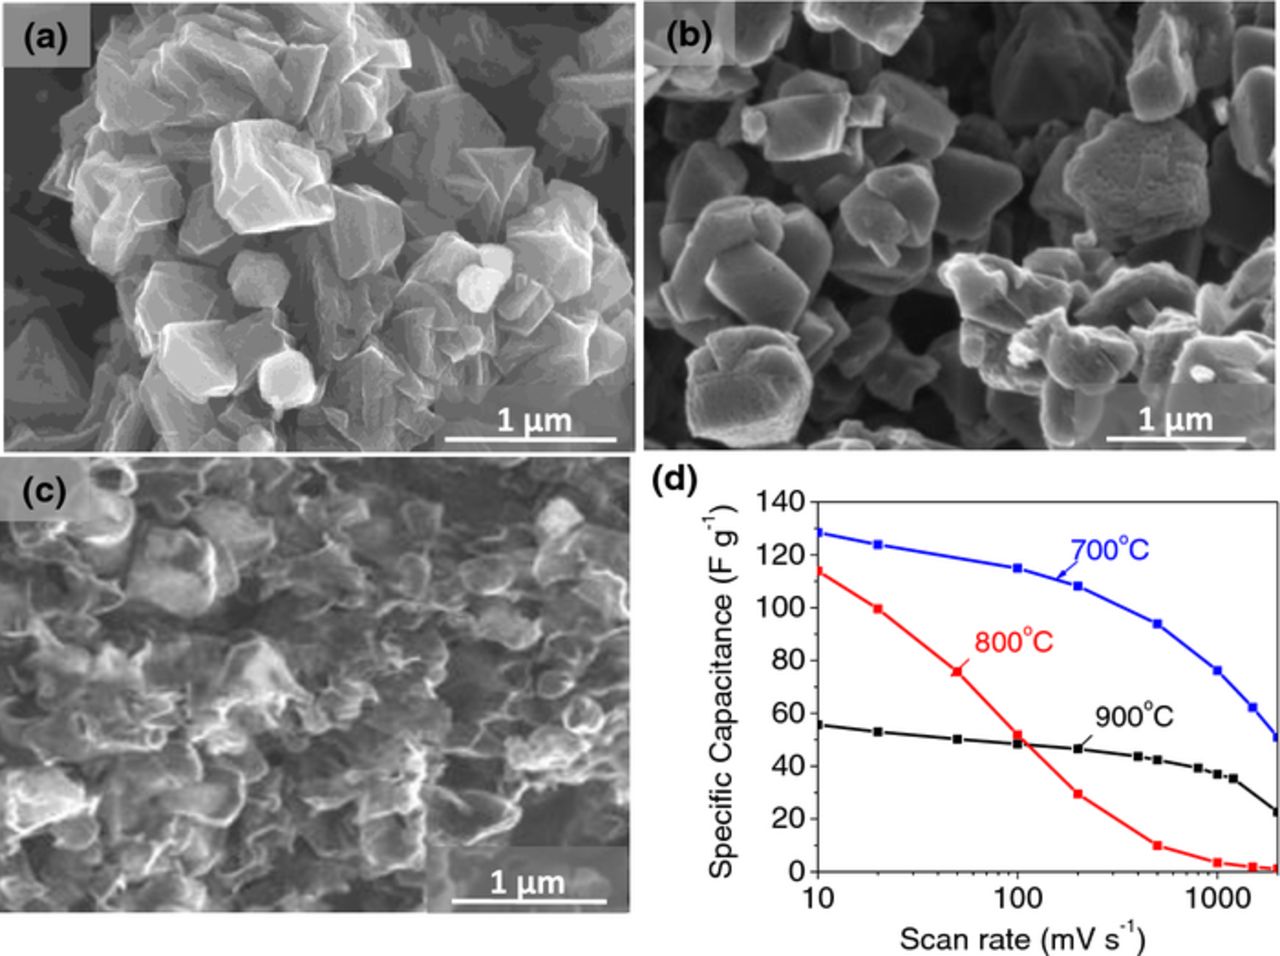
Figure 1. SEM images of the ZTC samples synthesized at (a) 700°C, (b) 800°C and (c) 900°C and (d) their specific capacitance (as measured from CV tests) retention with increasing scan rate.
Carbon activation
In order to enlarge the SSA in the produced carbon, CO2 activation was performed on ZTC samples. The effect of activation conditions including the activation temperature, time and flow rate of CO2 was investigated and the resulting porosities of the produced carbons are summarized in Table I. The ZTC powder without any post-synthesis treatments is named as n-ZTC. CO2 activated samples are named as C-ZTC followed by the temperature and the duration time of activation in minutes written in parenthesis.
Table I. Surface structural properties of CO2 activated ZTC.
| Time | CO2 | Temp | SSABET | Pore volume | |
|---|---|---|---|---|---|
| Sample | (min) | (ml/min) | (°C) | (m2 g−1) | (cm3 g−1) |
| C-ZTC900(30m) | 30 | 300 | 900 | 210 | 0.08 |
| C-ZTC900(20m) | 20 | 150 | 900 | 440 | 0.18 |
| C-ZTC900(15m) | 15 | 150 | 900 | 520 | 0.20 |
| C-ZTC800(20m) | 20 | 150 | 800 | 1640 | 0.74 |
| C-ZTC800(15m) | 15 | 150 | 800 | 2390 | 1.1 |
| C-ZTC800(10m) | 10 | 150 | 800 | 1730 | 0.8 |
| C-ZTC700(15m) | 15 | 150 | 700 | 1940 | 0.9 |
| n-ZTC | ̵ | ̵ | ̵ | 1650 | 0.9 |
Activation at 900°C resulted in an over-oxidation (burning) of the samples and a decrease in their SSA and pore volume. Longer time at such a relatively high temperature yielded smaller porosity. Activation at a more moderate temperature of 800°C resulted in a noticeable improvement with an optimized activation conditions (800°C for 15 min activation) yielding SSA as large as 2390 m2 g−1. The high sensitivity of the achieved porosity to activation conditions (See Table I) suggested that a very delicate optimization of the post synthesis activation of ZTC is generally required to induce additional pores in ZTC and remove amorphous carbon without burning pore walls, which are mostly composed of single graphene layers.65
Figure 2a summarizes the dependence of the specific capacitances of ZTC samples (after activation at different conditions) on the CV scan rate. Only the best performing (at each activation temperature) samples were included in this graph to make it less crowded. All samples activated at 900°C resulted in much lower specific capacitance compared to n-ZTC, which is consistent with their lower SSA and pore volume (Table I). In contrast, the samples activated at 700 and 800°C showed improved specific capacitances, particularly when measured at the slowest scan rates (Fig. 2a). The sample C-ZTC800(15m) showed the highest specific capacitances of 204 F g−1 at a sweep rate of 1 mV s−1. It also exhibits some of the pseudocapacitance peak near 0 V (Fig. 2b), which may increase its total capacitance, but at the expense of possible side effects, such as self-discharge.1 Other than that, the CV curves retained a near-rectangular shape at a relatively high sweep rate of 100 mV s−1, suggesting rather fast ion transport within the microporous ZTC electrodes. The possible origins of the often observed butterfly shape of the CVs (Fig. 2b) have been previously discussed in some of our former publications.14 The achieved values of the specific capacitance were found to correlate with the SSA of the produced ZTC.
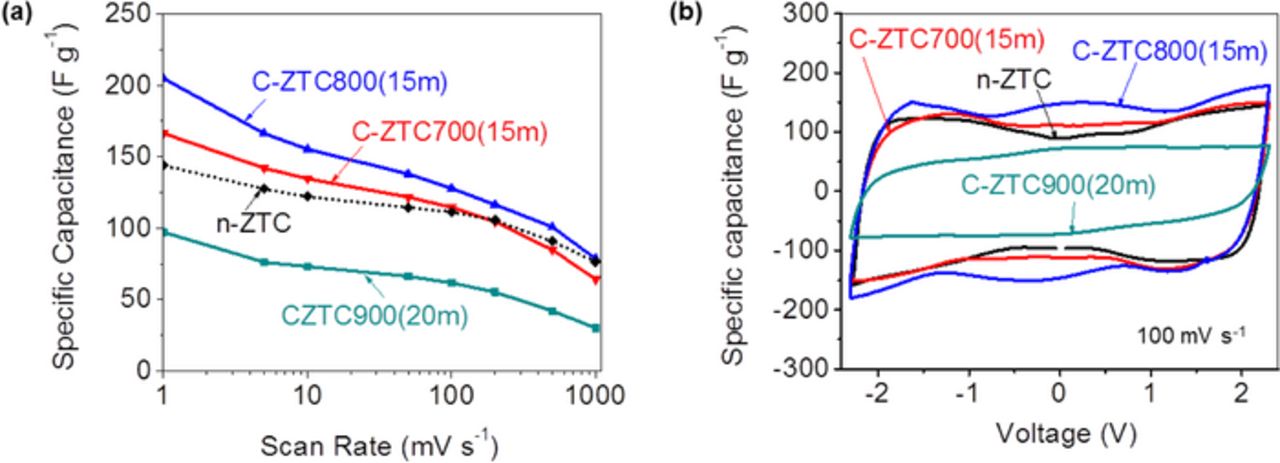
Figure 2. Effect of the CO2 activation on the ZTC samples produced at 700°C on (a) the specific capacitance as a function of scan rate and (b) shape of the CV curves at a relatively high sweep rate of 100 mV s−1. Only the best performing (at each activation temperature) samples are shown. Pseudocapacitive peak at 0 V is seen in sample C-ZTC800(15m).
The activation commonly resulted in a small reduction in the resistance and frequency response of the EDLCs. Figure 3 compares the EIS results of n-ZTC with that of the C-ZTC800(15m). Majority of the tested devices exhibit virtually no semi-circuit loop at high frequencies (Fig. 3a), which indicate a low resistance of the interface between the current collector and electrodes.68,69 We also see that activation resulted in lowering the equivalent series resistance, ESR (intersection of the graph with the x axis at the high frequency), from 2.7 to 1.2 Ohm cm2 in the case of 15 min activation at 800°C (Fig. 3a). This ESR includes electrolyte resistance as well as the electrode resistance. Since we used identical electrolytes and electrode thicknesses we can conclude that activation reduced electrode resistance, possibly by removing some of the amorphous carbon or defects that prevented efficient compaction of the ZTC particles in the assembled electrodes. The reduced resistance allowed slightly improved frequency response in the activated samples, where a capacitance drops to 50% of its maximum value at higher frequencies than in the as-produced sample, 0.3 Hz for C-ZTC800(15m) vs. 0.2 Hz for n-ZTC (Fig. 3b).
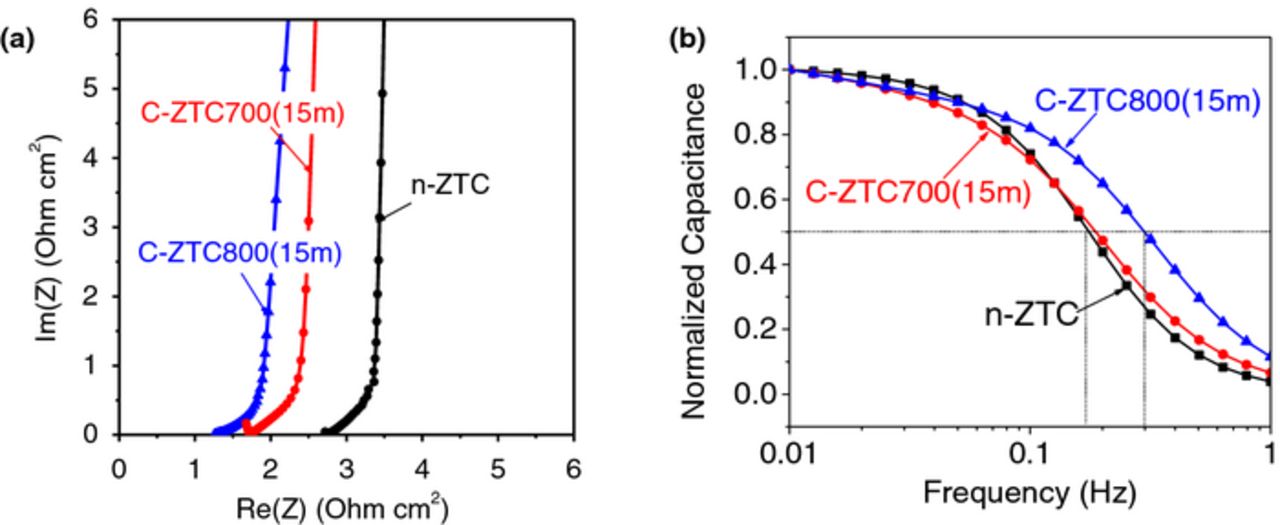
Figure 3. Selected examples of the EIS results: (a) Nyquist plots and (b) normalized capacity retention with increasing operating frequency in EDLCs obtained from selected activated and as-produced ZTC samples.
The pore size distribution (PSD) of the ZTC samples was derived from N2 adsorption isotherms at –196°C. The activation process did not change the PSD of the ZTC samples significantly. For example, the sample with the highest degree of activation, C-ZTC800(15m) showed PSD similar to that of n-ZTC, but with slightly larger pore volume observed in the range of 1.5-5 nm (Fig. 4). The slightly larger volume of mesopores may contribute to the slightly better frequency response of the activated samples (Fig. 3b).
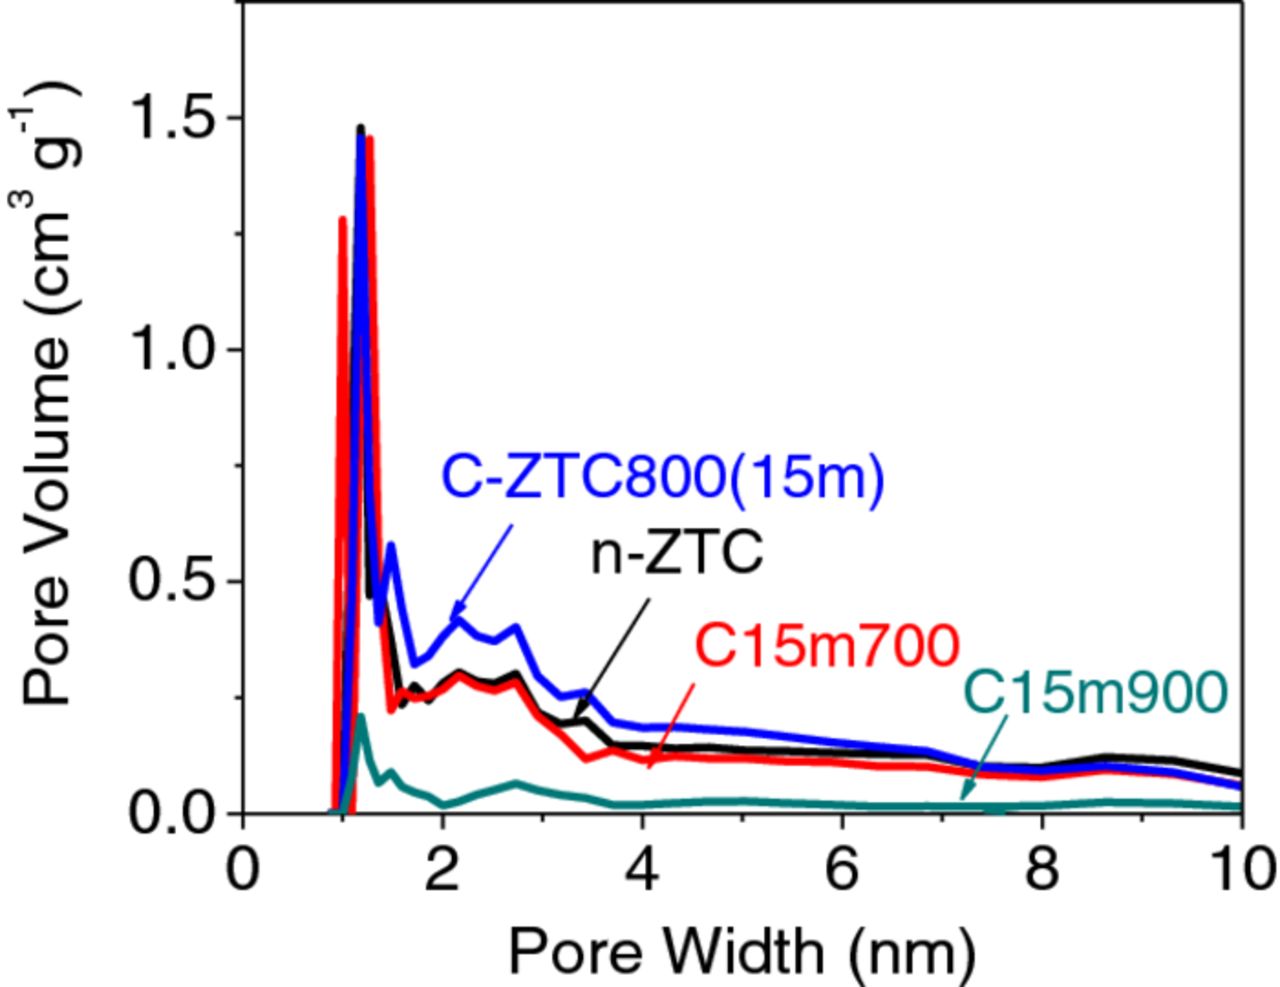
Figure 4. PSD derived from N2 adsorption isotherm at –196°C for ZTCs prepared with different activation conditions.
Ball milling
While the size of the primary ZTC particles was only 0.2–1 μm, the size of the aggregates was larger, 3–30 μm. Large size of agglomerates may, in principle, slow down ion transport. The high resolution TEM studies revealed that the surface of the ZTC particles (even those where carbon was deposited at 700°C) was coated with the 2–5 nm (for n-ZTC produced at 700°C and larger for samples produced at higher temperatures) layer of disordered carbon. Such a layer may reduce the N2 accessible SSA and similarly slow down the ion flux from outside of the ZTC particles to their inner pores. We hypothesized that a gentle ball milling process could break-up the agglomerates, thereby reducing the effective diffusion distance and additionally allowing electrolyte transport around the ionically resistive surface layer. In order to maintain the pore alignment (prevent collapse of the pores) and avoid complete crushing of the rather fragile ZTC particles, ball milling was conducted before etching the zeolite templates. The influence of ball mill time on the carbon porosity was investigated by N2 adsorption analyses. The summary of which is shown in Table II.
Table II. Surface structural properties of ball milled zeolite templated carbons.
| Milling | SSABET | Pore volume | |
|---|---|---|---|
| Sample | time (min) | (m2 g−1) | (cm3 g−1) |
| n-ZTC | 0 | 1650 | 0.9 |
| B-ZTC(15m) | 15 | 1730 | 0.8 |
| B-ZTC(30m) | 30 | 1940 | 0.9 |
| B-ZTC(120m) | 120 | 1920 | 0.9 |
Ball-milling enhanced samples are named as B-ZTC, followed by the milling duration time in minutes written in parenthesis. B-ZTC(15 m) indicates that 15 min of ball milling was applied to the C-coated zeolite before zeolite etching. Increasing the ball milling time up to 30 min, the BET SSA gradually increased by ∼300 m2 g−1 compared to the original sample, n-ZTC. Longer ball milling process did not affect the SSA (Table II).
The effect of post-ball milling process on improving the specific capacitance is shown in Figure 5a. Surprisingly, B-ZTC(30 m) sample (which possess the highest surface area, Table II) did not show significant improvement in the specific capacitance (Fig. 5a). The PSD of this sample was rather similar to that of the initial n-ZTC sample (Fig. 5b), with a small reduction in the relative volume of the smallest micropores. The reduced volume of such pores may lead to the reduced capacitance,9 even if the SSA is 18% higher. Interestingly, B-ZTC(120 m) sample provided the highest specific capacitances of 194 F g−1 at a sweep rate of 1 mV s−1. The PSD of this sample showed that the 120 min ball milling creates the highest content of small micropores (∼1 nm), which might be the reason for the great increase in the capacitance at slow scan rates as well as for a significant capacitance drop at rates higher than 100 mV s−1. We hypothesize that these additional pores may originate from the activation of the C coating by the zeolite substrate induced by mechanical forces (mechanochemical reactions).
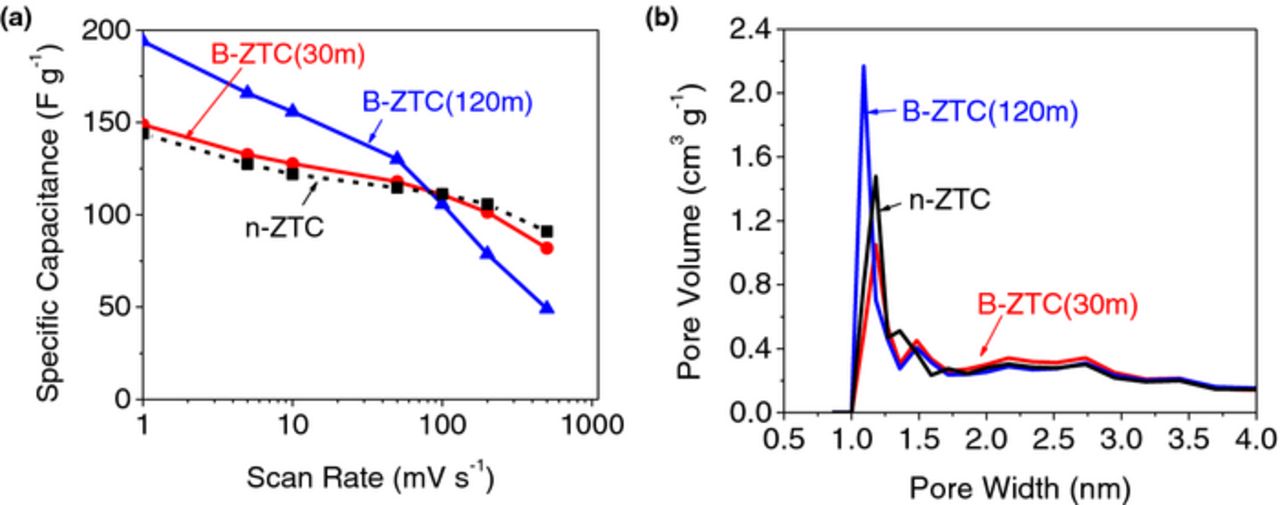
Figure 5. Effect of the ball milling performed on the C-coated zeolites on (a) the specific capacitance at different scan rates and (b) the PSD.
Annealing
Annealing of the ZTC samples in an inert environment at temperatures higher than that of the synthesis (carbon deposition) temperature was performed in order to test a hypothesis that such an annealing process can heal the defects in the produced carbon structure, which, in turn, might allow for better retention of the pore alignment. For this series of experiments, carbon-coated zeolite samples were annealed at temperatures of 800, 900 and 1000°C under Ar prior to zeolite etching (the finally produced ZTC samples were named A-ZTC800, A-ZTC900 and A-ZTC1000, respectively). Selected samples were additionally subjected to ball milling prior to zeolite etching (the finally produced ZTC samples were named AB-ZTC800, AB-ZTC900 and AB-ZTC1000 respectively) in order to see the sequential effect of annealing and ball milling processes.
Annealing at 900°C resulted in the most noticeable performance improvements. Figure 6a shows the effect of individual annealing (900°C) and ball milling processes as well as the combined effect of annealing followed by ball milling on improving the capacitance of ZTC. Annealing at 900°C improved the overall capacitance by a moderate ∼20 F g−1, without significantly affecting the rate performance. This was in contrast to our prior studies in aqueous electrolytes, where significant improvements in both capacitance and rate performance was achieved upon implementing the post-deposition annealing.25 We may conclude that larger size of ions in organic electrolytes and their stronger interactions with the walls of relatively small 1 nm pores affected the ion transport rate more significantly than concentration of defects within carbon. More importantly for practical applications, we observed a synergetic effect when annealing was conducted prior to the ball milling (AB-ZTC900). The highest value of the specific capacitance (240 F g−1 at a scan rate of 1 mV s−1) and improved rate performance was observed compared to the ball milled ZTC (Fig. 6a). Figure 6b shows that this best performing sample exhibited larger volume of 2–4 nm mesopores and nearly ∼1000 m2 g−1 higher SSA than the regular n-ZTC sample (Table III).
Table III. Surface structural properties of sequentially annealed and ball-milled zeolite templated carbons. Ball mill grinding time was fixed at 30 min.
| Temperature | SBET | Pore volume | |
|---|---|---|---|
| Sample | (°C) | (m2 g−1) | (cm3 g−1) |
| AB-ZTC800 | 800 | 2160 | 1.16 |
| AB-ZTC900 | 900 | 2630 | 1.28 |
| AB-ZTC1000 | 1000 | 2050 | 1.05 |
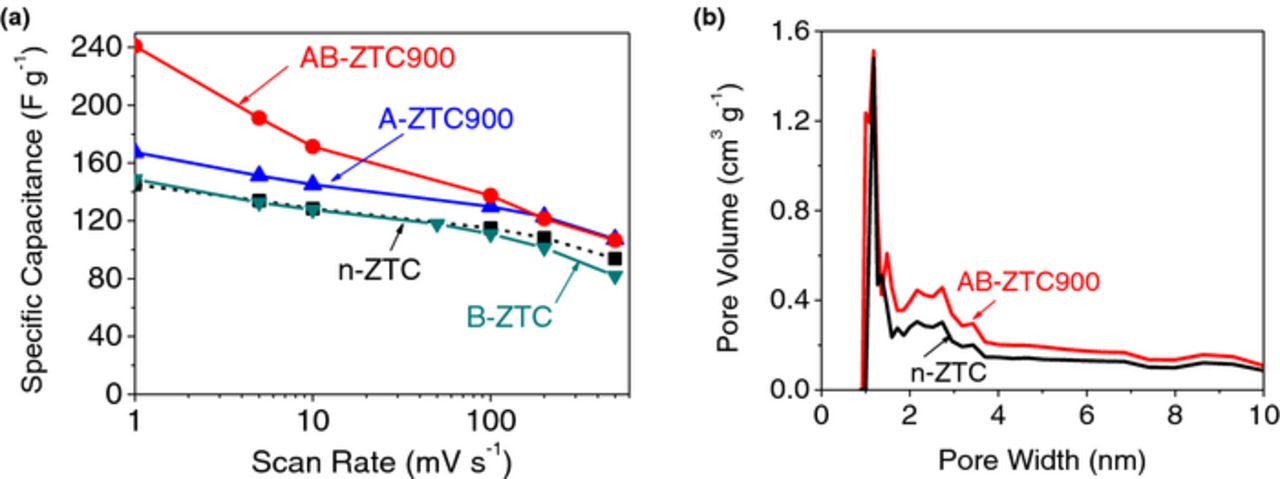
Figure 6. Changes in (a) the specific capacitances and (b) the PSD with the sequential annealing at 900°C and ball milling (30 min) processes.
Inspired by these promising results we systematically investigated the impact of the temperature of the (post-carbon deposition / pre-milling) annealing. The annealing process at all temperatures from 800 to 1000°C resulted in higher SSA and pore volume compared to both regular ball milled samples (compare Table III and II), suggesting that annealing assisted in retaining the pore structure and prevented collapse of at least some of the pores. The optimal performance, however, was achieved for the 900°C annealing. Not surprisingly (considering somewhat similar PSD), significantly enhanced SSA of the annealed samples resulted in higher values of the specific capacitance (Figure 7).
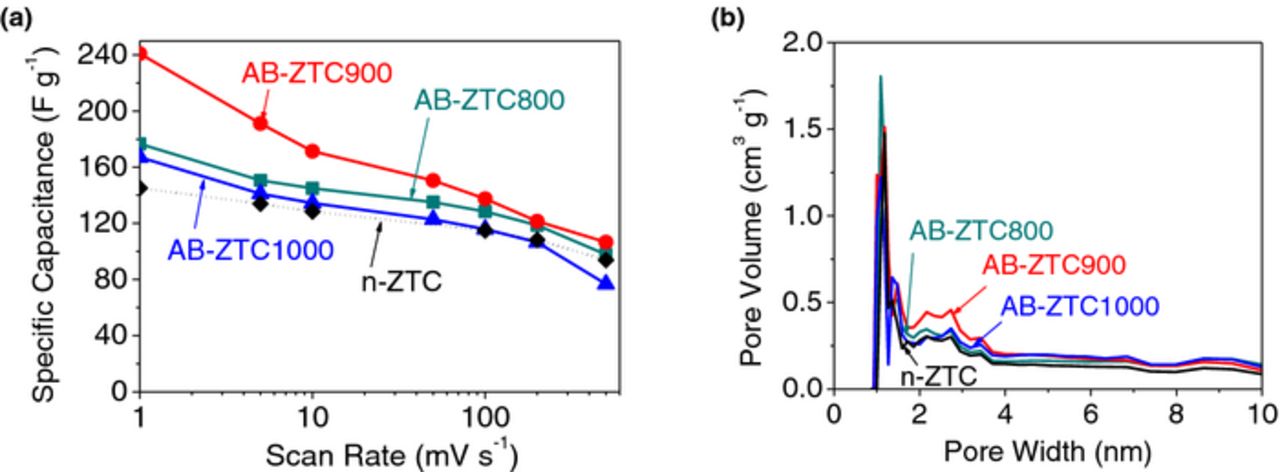
Figure 7. The effect of post C deposition annealing temperature on (a) specific capacitance and (b) PSD of the resultant ZTC.
In order to quantify the changes in the degree of carbon ordering upon annealing or ball milling we conducted Raman spectroscopy studies. However, the broad Raman bands of disordered (and mostly single-walled) carbon in ZTC samples showed only small changes among samples. We could detect some changes in the average ratio of the integrated intensity of the D (disordered carbon) and G (graphitic carbon) Raman bands in the ZTC samples upon implementation of the annealing procedure (Fig. 8a), but even these changes were relatively small. High resolution TEM studies did not show significant changes as well. The TEM micrographs showed rather disordered structure (even for annealed samples), typical for porous carbons (Fig. 9b). We hypothesize that in order to observe significant (and easily detectable) degree of ordering higher annealing temperatures could be required. Hoverer, temperatures higher than 1000°C result in a collapse of the zeolite structure and the reaction between C and zeolite and thus could not be undertaken.
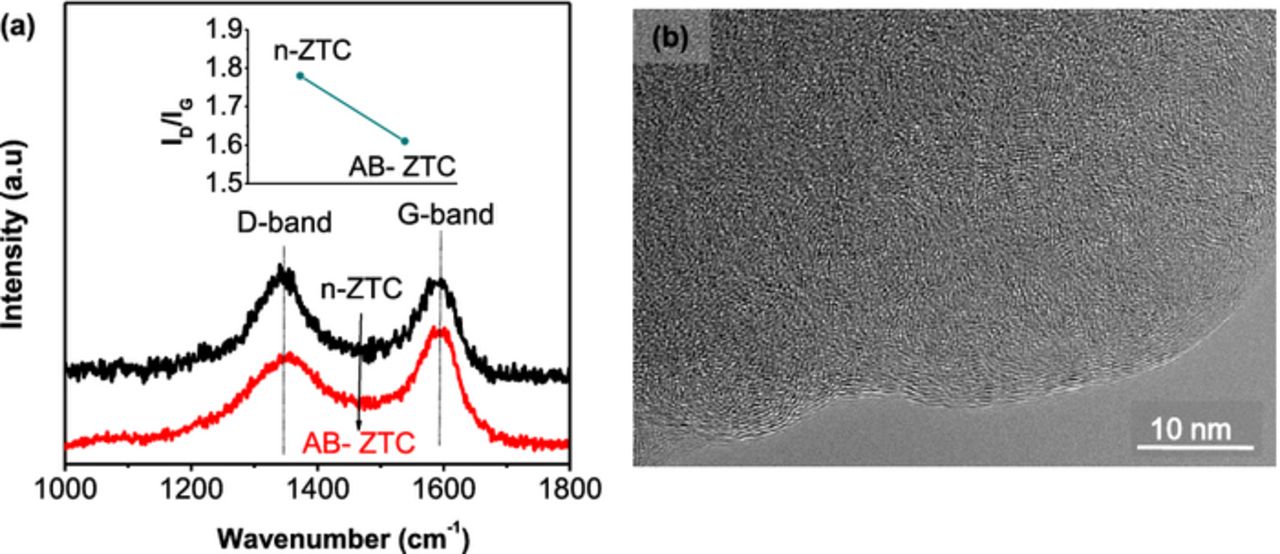
Figure 8. (a) Raman analysis of the ZTC samples comparing the ID/IG ratio of n-ZTC and AB-ZTC and (b) TEM micrograph of the annealed ZTC sample.
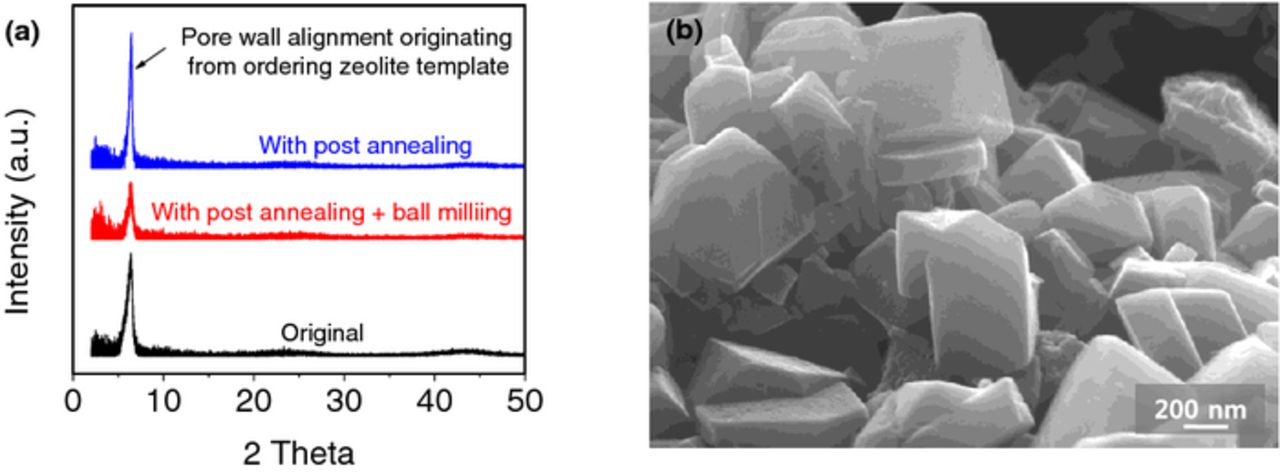
Figure 9. Evidences for the retention of the pore alignment and particle shape upon ball milling: (a) XRD of the ZTC samples without and with annealing and with annealing and ball milling; (b) SEM images of the post-annealed and ball milled sample (AB-ZTC900).
We would like to emphasize that according to our XRD studies all the samples produced by LP CVD of C at 700°C (including those that undergone ball milling procedure) retained some level of pore ordering / alignment originating from that of the zeolite templates (Fig. 9a). The low angle peak at ∼6° in this figure corresponds to the carbon walls regularly spaced at ∼1.3 nm and originates from the ordering of the (111) planes of the ZTC templates increased by the post annealing process.66 Similarly, it is important to note that the employed ball milling procedure was rather delicate and did not result in any noticeable damages in the shape of the particles (Fig. 9b). We noticed somewhat smoother surface and better zeolite shape retention in the ZTC samples that underwent annealing (including those that were annealed and ball milled prior to zeolite etching, Fig. 9b). This may qualitatively support our previous conclusion of the positive impact of annealing on pore volume retention upon zeolite etching.
Combination of annealing, ball milling and activation
In search of the best way to prepare ZTC samples, we wanted to explore if the combination of all three post-synthesis treatments may lead to the most promising performance. Therefore, sequential post-synthesis annealing, ball milling and finally activation procedures were performed. For all samples, ball mill grinding time was fixed at 30 min and activation condition was fixed at 15 min, 150 mL min−1 of CO2 flow and 800°C. Annealing temperature was varied from 800°C to 900°C. Surprisingly, three combination of post synthesis treatments resulted in lower SSA and pore volume (Table IV) compared with the original sample. Such results indicated that after ball milling (and presumably partial removal of the disordered carbon surface layer and fracturing of some of the larger agglomerates) the C-coated zeolite samples become significantly more sensitive to activation. In this case even moderate activation conditions evidently resulted in over-oxidation (burning) of carbon pore walls and noticeable particle collapse after zeolite etching. The smaller SSA resulted in smaller capacitance (results not shown for brevity).
Table IV. Surface structural properties of two zeolite templated carbons prepared by sequential annealing, ballmilling, activation, zeolite etching and purification.
| Annealing Temperature | SBET | Pore volume | |
|---|---|---|---|
| Sample | (°C) | (m2 g−1) | (cm3 g−1) |
| ABC-ZTC800 | 800 | 1573 | 0.64 |
| ABC-ZTC900 | 900 | 1388 | 0.61 |
Figure 10 demonstrates the virtually linear relationship between the specific capacitance and SSA (at least in case of high surface area samples). The low SSA of the C-ZTC samples activated at the highest temperature of 900°C suggest that they are mostly composed of the surviving thicker (e.g. multi-walled) graphitic structures, which are expected to exhibit higher free electron density and thus may show higher area-normalized capacitance.13 In addition, we cannot exclude the possibility of the intercalation of ions into the closed pores inaccessible by N2 utilized in the SSA measurements.
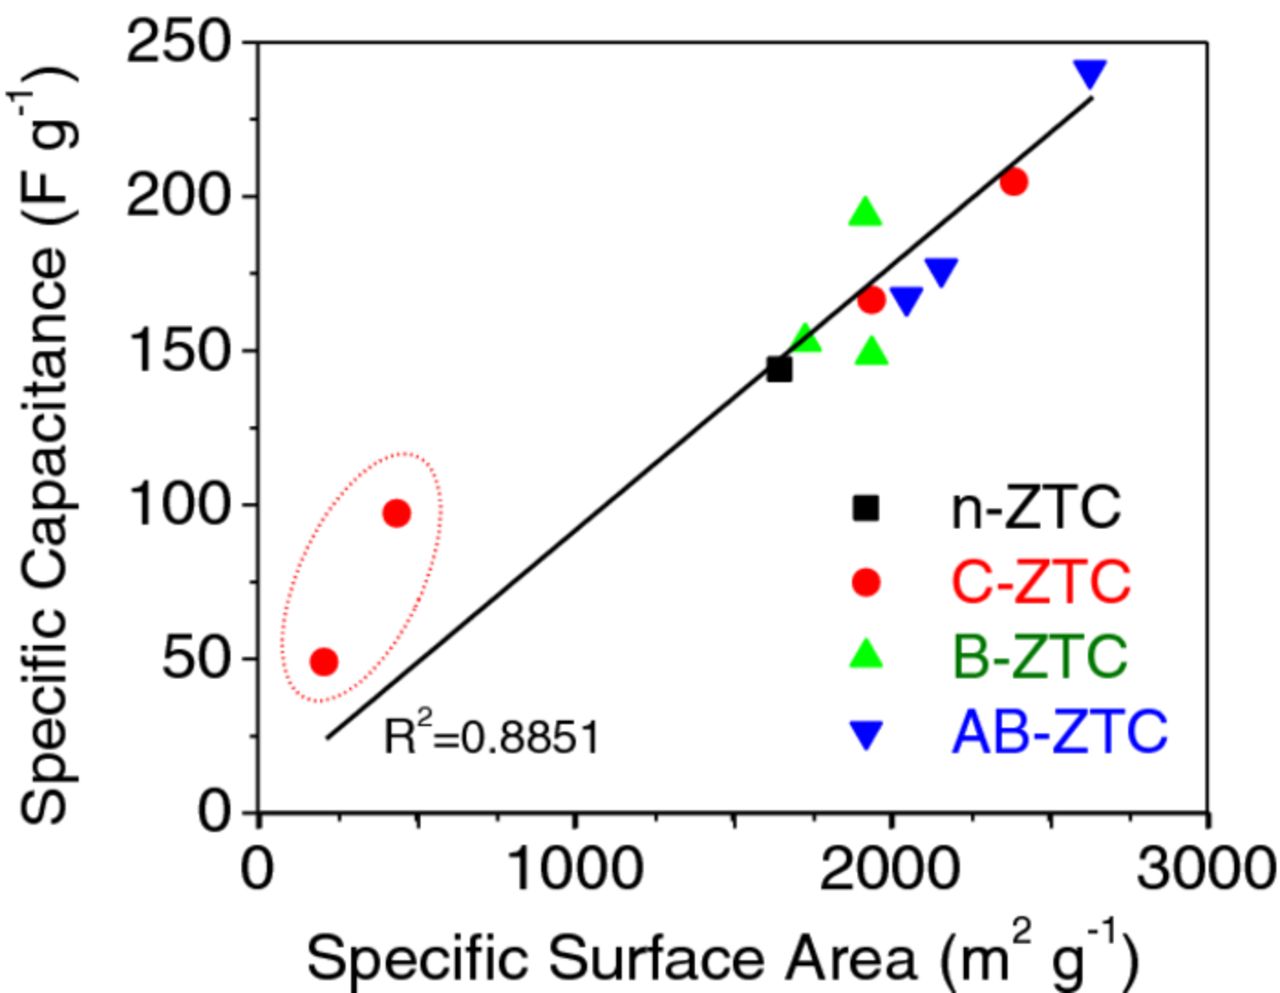
Figure 10. Specific capacitance dependence on BET SSA.
Cycle life tests
Carbon-based EDLC are known to exhibit a very stable performance in organic electrolytes if the purity of carbon is sufficiently high and if the remaining impurities do not induce unfavorable reactions with current collector or electrolyte.1 In our case, several EDLCs built with ZTC samples underwent C-D tests. Even when tested at a high current density of 20 A g−1 these EDLCs did not show significant signs of degradation after 22,000 cycles (Fig. 11).
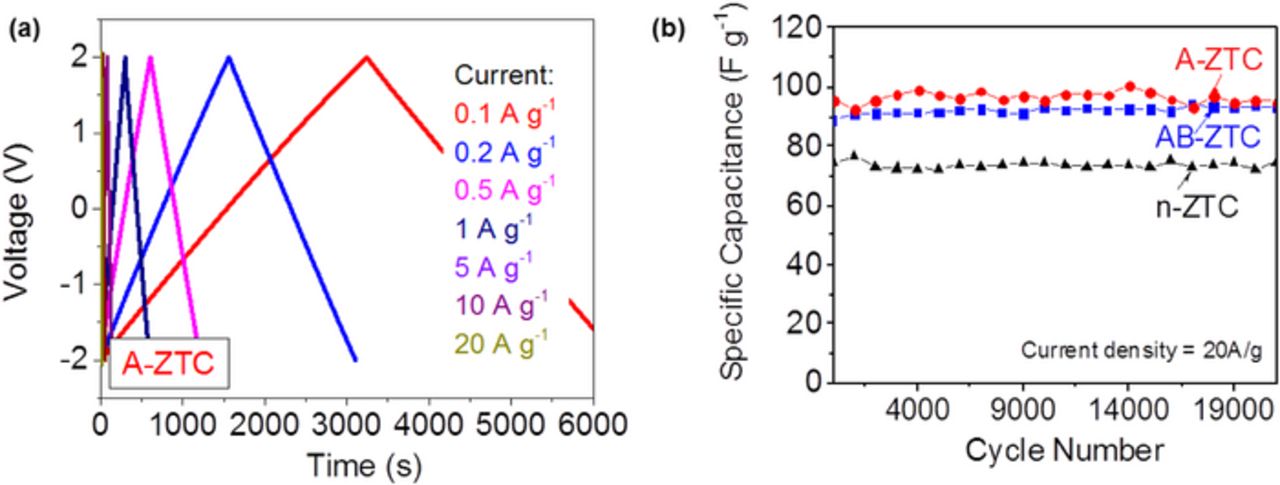
Figure 11. Results of the charge-discharge tests on selected ZTC samples: (a) examples of the charge-discharge profiles at different current densities and (b) cycle stability tests conducted at a very high current density of 20 A/g.
Summary
In the course of our study we have identified promising routes to produce porous zeolite-templated carbons with ordered micropores and high SSA of up to ∼2630 m2 g−1, close to theoretical one for graphene ∼2600 m2 g−1. It was demonstrated that post-carbon deposition treatments, such as annealing, ball milling and activation allow one to enhance ZTC porosity and improve their performance in EDLCs. In our experiments, the highest specific capacitance of 240 F g−1 at 1 mVs−1 in organic electrolyte was achieved when a combination of annealing and ball milling was employed. This value is among the highest one ever reported for microporous carbon powders in identical electrolytes.1 Further studies may allow one to enhance ZTC performance further.
Acknowledgment
This work was partially supported by the NSF grant 1228723. We thank Dr. V. Svoboda for useful discussions and help.