Abstract
A combined chemical/mechanical accelerated stress test (AST) was developed for proton exchange membrane (PEM) fuel cells based on relative humidity cycling (RHC) between dry and saturated gases at open circuit voltage (OCV). Membrane degradation and failure were investigated using scanning electron microscopy and small- and wide-angle X-ray scattering. Changes to membrane thickness, hydrophilic domain spacing, and crystallinity were observed to be most similar between field-operated cells and OCV RHC ASTs, where local thinning and divot-type defects are the primary failure modes. While RHC in air also reproduces these failure modes, it is not aggressive enough to differentiate between different membrane types in >1,333 hours (55 days) of testing. Conversely, steady-state OCV tests result in significant ionomer morphology changes and global thinning, which do not replicate field degradation and failure modes. It is inferred that during the OCV RHC AST, the decay of the membrane's mechanical properties is accelerated such that materials can be evaluated in hundreds, instead of thousands, of hours, while replicating the degradation and failure modes of field operation; associated AST protocols are recommended as OCV RHC at 90°C for 500 hours with wet/dry cycle durations of 30s/45s and 2m/2m for automotive and bus operation, respectively.
Export citation and abstract BibTeX RIS

This is an open access article distributed under the terms of the Creative Commons Attribution Non-Commercial No Derivatives 4.0 License (CC BY-NC-ND, http://creativecommons.org/licenses/by-nc-nd/4.0/), which permits non-commercial reuse, distribution, and reproduction in any medium, provided the original work is not changed in any way and is properly cited. For permission for commercial reuse, please email: oa@electrochem.org.
The cost and durability of proton exchange membrane (PEM) fuel cells are major barriers to the commercialization of these systems for transportation and stationary power applications.1 To rapidly evaluate materials that address these limitations, accelerated stress tests (ASTs) must be developed based on the degradation and failure mechanisms present in these systems under relevant operating conditions.
The need for ASTs is apparent given the target lives for fuel cell systems: 5,000 hours (∼7 months) for automotive, and 60,000 hours (∼6.8 years) for stationary applications.2 Thus, ASTs that enable screening of individual components to determine their durability characteristics are needed for evaluating new component durability in a reasonable timeframe. These tests are also used by developers to quantitatively evaluate the tradeoffs in cost (e.g. lower platinum group metal loading), lifetime (e.g. a lower surface area carbon with better corrosion resistance), and performance (e.g. a thinner membrane or a diffusion medium with better water management properties).
The ion-conducting polymer, or ionomer, material (e.g. perfluorosulfonic acid [PFSA]), which comprises the PEM, is especially susceptible to damage, which leads to eventual system failure. During cell operation, variations in temperature and relative humidity (RH) cause fatigue stresses in the PEM due to cyclic swelling and shrinkage.3,4 These stresses generate through-thickness cracks, in-plane tears, and local thinning, which increase the crossover of reactant gases and diminish the ionic conductivity and electronic resistivity of the PEM.3,4 In addition, exposure to damaging chemical species that form as intermediates and side-products of the fuel cell reactions cause chemical degradation in the form of pinholes and global PEM thinning, which also increase gas crossover. Thus, the membrane durability is ultimately controlled by both chemical and mechanical stressors, which act synergistically, leading to accelerated failure and performance loss. Recent reviews describe these degradation modes and mitigation strategies in detail.1,5–7
To evaluate the mechanical durability of PEMs, catalyzed PEMs (i.e., membrane electrode assemblies [MEAs]) are supplied with inert (N2 or air) gases at elevated temperatures (>80°C) and exposed to hygral cycles by switching the gases from 0% RH to RH above saturation for prescribed time intervals, typically 2 minutes.2,8,9 PEM degradation is quantified through gas crossover and shorting resistance measurements that are performed periodically throughout the test. Gas crossover measurements may either be performed electrochemically, using linear sweep voltammetry10 or physically, where crossover is detected using a flow meter.11
The chemical stability of the PEM is typically evaluated using steady-state open circuit voltage (OCV) testing at high temperature (80–90°C) and low RH (30–50% RH), in order to promote the formation of peroxide and radical species, which are directly responsible for chemical degradation of PFSA.2,10–18 Gas crossover and fluoride emission rate (FER) measurements are performed intermittently to quantify the rate of such degradation.6
While both mechanical and chemical stability ASTs are useful for screening for durable PEMs, they may not accurately reproduce the conditions that MEAs experience during field operation. In order for a fuel cell system to respond to power demands during automotive operation, MEAs experience transient fluctuations in RH, temperature, and cell voltage. These variations induce both chemical and mechanical stresses, simultaneously, which results in synergy between the degradation modes.5,19 Localized mechanical stresses may increase PEM susceptibility to radical attack by reducing the activation energy necessary for such attacks to proceed.20–22 Chemical degradation of PFSA diminishes the bulk mechanical properties of the PEM, such as the ultimate tensile strength, strain-to-failure, fracture toughness, and resistance to creep, which further increases its susceptibility to physical failure.23–30
To assess an MEA's resistance to simultaneous chemical and mechanical stresses, a variety of combined AST protocols have been proposed.8,26,28,32 Ballard has developed an AST which consists of a high temperature, low RH OCV phase followed by intermittent hygral cycling in N2, which serially induces chemical and mechanical stresses.27 In the protocol developed by Panha, et al., cells were operated at 100% RH and OCV conditions, where dry reactant gases were supplied for 10 minutes every 2 hours. This test resulted in increased FERs and performance losses and decreased cell lifetimes compared to 100% RH OCV operation.31
The combined AST established by W.L. Gore consists of steady-state operation at 0.2 A/cm2 in H2/air with simultaneous humidity cycling.8 During this test, the anode inlet RH varies from 10% to 44% RH, while the cathode varies from 4% to 80% RH. The outlets experience hygral swings from 41% to 108% RH. Cell failure occurred near the inlets of the cell, where low RH and RH cycles are present, concurrently.
General Motors (GM) has presented a similar AST consisting of simultaneous current and RH cycling. By discharging the cell cyclically between 0.05 and 0.8 A/cm2, the inlet experiences a constant RH of 40% RH, while the outlet RH fluctuates between 50% and 100% RH.25 Here, MEAs that can withstand tens of thousands of RH cycles would be expected to fail near the inlet due to chemical degradation caused by exposure to low RH reactant gases. In the GM test protocol, however, they fail near the outlets, suggesting that chemical degradation caused by the low RH phase of the current cycle diminishes the strength of the PEM until RH cycle-induced mechanical failure occurs.25 It must also be noted that the RHs in the GM protocol are hardware-specific and measured using a segmented cell, which is not a typical laboratory testing capability.
To address shortcomings in current membrane AST protocols in terms of simulating the correct degradation mechanism and length of testing time, we developed and present a new membrane AST which involves cycling cell RH from wet to dry reactant gases at optimized time intervals at OCV. This AST is derived from correlation of cell degradation and failure modes between the AST and field and drive cycle operation. These recommended AST protocols may be applied to screen membrane materials more rapidly and to address durability issues that currently hinder PEM fuel cell deployment.
Experimental
Field testing
MEAs containing P5 and HD6 membranes were used by Ballard Power Systems in fuel cell bus stacks starting in 2002 and 2007, respectively. The P5 MEA was based on a 50 μm thick membrane with a total Pt loading of 1.05 mg/cm2; the HD6 MEA had a total Pt loading of 1 mg/cm2 and a 25 μm thick membrane. The P5 stacks were operated in buses in Hamburg, Germany on different routes for approximately 3,000 hours, while the HD6 module was operated in the laboratory on an Orange County Transit Authority (OCTA) drive cycle for 6,842 hours.32 Noting that these membrane materials were between 11 and 16 years old at the time of this publication, they do not include mechanical reinforcement, thus, the chemical degradation and subsequent changes to water domain spacing and crystallinity are considered to be accurate.
Accelerated stress testing and drive cycle protocols
ASTs were performed on Ballard P5 and HD6 MEAs using standard 50 cm2 single cell hardware in a fuel cell test stand (Fuel Cell Technologies, Inc.). ASTs were also performed on MEAs containing Nafion XL (DuPont) membranes that are chemically and mechanically stabilized using Ce ions and polytetrafluoroethylene (PTFE) reinforcement, respectively.33 Nafion XL MEAs were prepared identically by Ion Power, Inc., and had Pt contents which approached DOE automotive targets (∼0.2/0.1 mgPt/cm2 on anode/cathode), corresponding to catalyst layer thicknesses of 6–12 μm.
After cell assembly, MEAs were conditioned using a break in protocol which consisted of cyclic operation at 0.6 V, OCV, and 0.3 V for 45, 30, and 60 seconds, respectively, for 2 hours at 80°C and 100% RH in H2/air with stoichiometries of 1.2/2 and outlet pressures of 101/101 kPaabs. At the time of this publication, the U.S. DRIVE Fuel Cell Tech Team has not recommended a break-in protocol for membrane testing because it is not expected to have a significant effect on membrane stability.
After conditioning, MEAs were exposed to ASTs consisting of (i) steady-state OCV hold, (ii) RH cycling in inert gases, and (iii) RH cycling at OCV. In these tests, high reactant gas flow rates were utilized in order to minimize any variation of stressors over the active area of the cell. Steady-state OCV tests were performed at 90°C and 30% inlet RH in H2/air with gas flowrates of 0.7 and 1.67 standard liters per minute (SLPM) and outlet pressures of 250 and 200 kPaabs, respectively.34 In this test, asymmetric outlet pressures are not expected to have a significant effect on degradation rate.35 The RH cycling (RHC) test was performed at 80°C in air with anode and cathode flowrates of 2 SLPM and outlet pressures of 101 kPaabs. During the RHC AST, humidifier bottles (Fuel Cell Technologies Inc.) were switched from dry to wet (dew point = 90°C) every 2 minutes. The combined RH cycling at OCV (OCV RHC) test was identical to the RH cycling test, but performed at 90°C in H2/air.
In addition to ASTs, Nafion XL-containing MEAs were tested in accordance with the U.S. DRIVE drive cycle protocol, which includes current cycling at 80°C in both supersaturated (dew point = 83°C) and 30% RH conditions.2 Additionally, a modified version of the U.S. DRIVE drive cycle durability protocol operating with only the supersaturated portion of the cycle, called the 'wet' drive cycle, was utilized. All AST and drive cycle protocols are summarized in Table I. Additional details regarding current U.S. DOE recommended AST protocols may be found in Reference 2.
Table I. AST and drive cycle test protocols used in this study.
| Parameter | ||||||
|---|---|---|---|---|---|---|
| Anode/cathode | Relative | Current | Anode/cathode | Anode/cathode | ||
| Protocol | Temperature | reactant gas | humidity | density | gas flow rate | outlet pressure |
| OCV | 90°C | H2/air | 30% | 0 A/cm2 | 0.7/1.67 SLPM | 250/200 kPaabs |
| RHC | 80°C | air/air | 2 min dry/2 min 90°C dew point | 0 A/cm2 | 2/2 SLPM | 101/101 kPaabs |
| 2m/2m OCV RHC | 90°C | H2/air | 2 min dry/2 min 92°C dew point | 0 A/cm2 | 1/1 SLPM | 101/101 kPaabs |
| 30s/45s OCV RHC | 90°C | H2/air | 30 sec dry/45 sec 92°C dew point | 0 A/cm2 | 1/1 SLPM | 101/101 kPaabs |
| U.S. Drive drive cycle | 80°C | H2/air | Wet phase a,b: 50% RH | 30 sec 0.02 A/cm2/30 sec 1.2 A/cm2 | 96/1.6 stoich, 108/1.8 stoich | 101/101 kPaabs |
| Dry phase c: 83°C dew point | 30 sec 0.1 A/cm2/30 sec 1.2 A/cm2 | 5/25 stoich, 5/25 stoich | 101/101 kPaabs | |||
| Wet U.S. Drive drive cycle | 80°C | H2/air | 83°C dew pointa | 30 sec 0.02 A/cm2/30 sec 1.2 A/cm2 | 96/1.6 stoich, 108/1.8 stoich | 101/101 kPaabs |
aanode and cathode inlets at 85°C. btransition after wet phase in H2/air with 70°C dew points, 0.6 A/cm2, for 2 minutes or until dry phase dew points are reached. canode and cathode inlets at 80°C.
Characterization
Electrochemical gas crossover
Electrochemical gas crossover of MEAs was characterized every 24 hours during ASTs using linear sweep voltammetry from 0.1 to 0.5 V at a scan rate of 2 mV/s. Before characterization, cells were equilibrated at 80°C in H2/N2 at 100% RH for 30 minutes.
Fluoride emission measurements
Ion chromatography (IC) was used to analyze effluent water for trace concentrations of fluoride ions during the OCV RHC AST and the U.S. DRIVE drive cycle durability test. Effluent water samples were collected from the anode and cathode gas outlets using a jacketed condenser system and analyzed using a Dionex ICS 2100 IC system in accordance with standard test protocols.36 At each collection interval, fluoride emission rates (FERs) were calculated as previously described, in detail.37
Post mortem SEM
To conduct scanning electron microscope (SEM) evaluation of MEAs after ASTs and drive cycle testing, 2 × 1 cm specimens were cut at various locations (inlet, middle, and outlet) of dried MEAs. To prepare MEA cross sections for imaging, specimens were immersed in liquid nitrogen and freeze-fractured using fresh, carbon steel razor blades. The fractured surfaces were analyzed using a FEI Quanta 45 SEM with an accelerating voltage of 5 kV. Either a secondary or backscatter electron detector was used, when necessary, to obtain optimal contrast between the PEM and catalyst layers.
X-ray scattering
To characterize the morphological changes in fresh and degraded PEMs, small- and wide-angle X-ray scattering (SAXS/WAXS) experiments were carried out on Beamline 7.3.3 of the Advanced Light Source at Lawrence Berkeley National Laboratory. Specimens were cut from the middle of fresh and degraded MEAs and the CLs were removed using a carbon steel razor blade. To avoid the deleterious effects of CL removal with a solvent,38 we have reported ionomer nanostructure data only for the membranes that were easily separated from the MEA, or that were already delaminated. Because of the high reactant gas flowrates, degradation during ASTs and the wet drive cycle is uniform across the active area. Therefore, such specimens are expected to be representative of overall PEM degradation. All scattering experiments were performed on the cathode side of each specimen. Additional anode-side measurements were also performed, when necessary.
The X-ray wavelength used was λ = 0.124 nm, with a monochromator energy resolution of E/dE of 100, and the presented patterns were collected using a 2D Dectris Pilatus 2 M CCD detector (172 μm x 172 μm pixel size). The scattering wave vector, q = 4π sin(θ/2)/λ, where θ is the scattering angle, was in the range of 0.001 to 0.04 Å−1 for SAXS and 0.5 to 3 Å−1 for WAXS. SAXS images for liquid-equilibrated samples were taken in-situ using custom-designed temperature-controlled liquid solution cells with X-ray transparent Kapton windows (for details, see previous studies33). All of the experiments were carried out at 25°C and the samples were equilibrated in liquid water for at least 2 hours prior to imaging. The collected two-dimensional scattering patterns were azimuthally integrated to generate 1-D intensity profiles which were corrected for background scattering. From the SAXS data, hydrophilic-domain spacing and inter-crystalline spacing were calculated using a Gaussian fit to the peaks. The relative degree of the crystallinity, xc, was calculated from the relative integrated area of the crystalline and amorphous peak intensities, which were determined after the deconvolution of the WAXS peak, as shown in previous work.33
Results
MEA degradation and failure during in-field bus operation
After long-term bus operation, two failed P5 MEAs and three failed HD6 MEAs were removed from their respective stacks for analysis. The P5 MEAs were operated in buses for ∼3,000 hours (4.1 months) in Hamburg, Germany, and the HD6 MEAs were stack-tested for 6,842 hours (9.4 months) in the Orange County Transit Authority (OCTA) drive cycle. Both MEAs contained significant "divot-type" damage, as shown in SEM micrographs (Figure 1a). This type of degradation is characterized by catalyst layer (CL) delamination from the PEM and local PEM thinning (Figure 1b). It is possible that CL delamination is initiated by a weakened CL-PEM interface due to chemical stress, which results in localized PEM thinning.39 However, it is difficult to determine if CL delamination or PEM thinning occurs first during field operation. Regardless, local PEM thinning leaves the PEM more susceptible to mechanical stresses, which generate local cracks and tears (Figure 1c) that lead to eventual MEA failure. While both P5 and HD6 MEAs showed multiple divots near the inlets and outlets after field operation, significant global PEM thinning was not observed.40 It should be noted that during bus operation, such MEAs typically experience temperatures of >70°C for <15% of their cycle duration with concurrent RH cycles between 85% and 100% RH.32 In contrast, the U.S. DRIVE automotive drive cycle consists of operation at 80°C with RH cycles between 30% and 100% RH.2 The more benign conditions of bus operation are a contributing factor to the lack of any global thinning which is otherwise accelerated under high temperature and low RH automotive operating conditions.
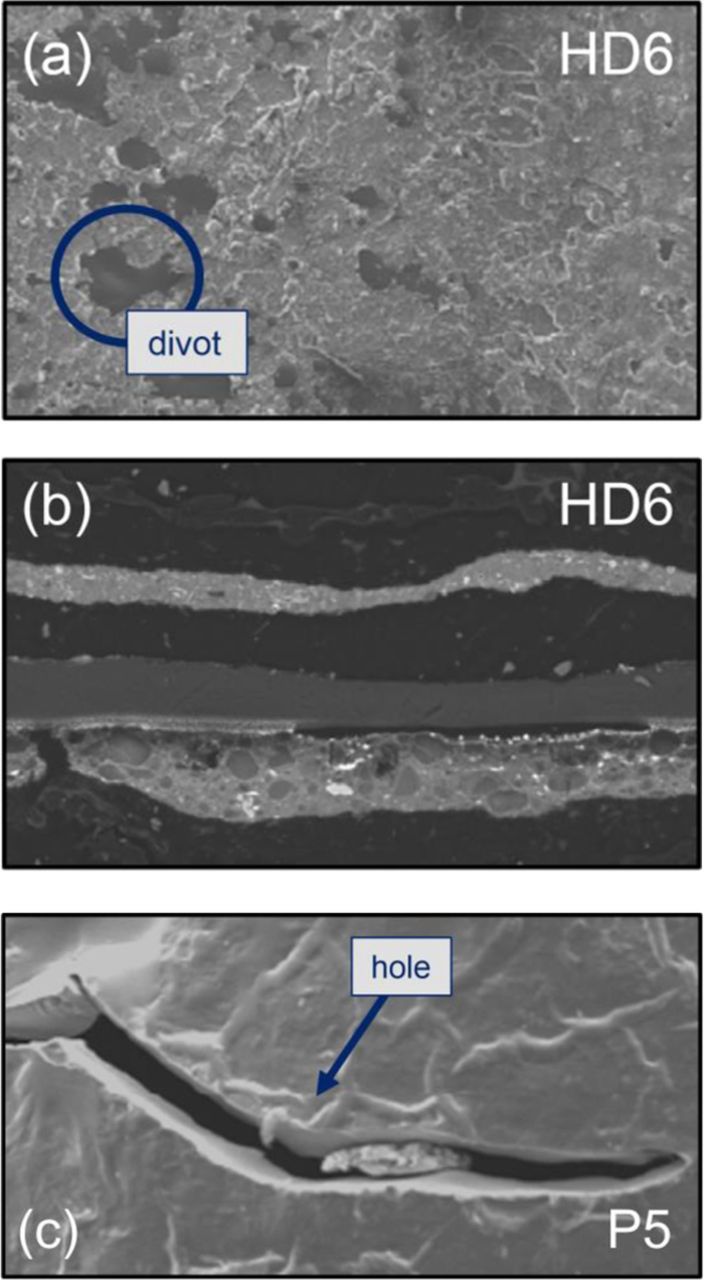
Figure 1. SEM micrographs of MEAs after field operation, which demonstrate the (a) divot-type failure mode, in which (b) the CLs pull away from the PEM causing local thinning which leads to (c) local PEM tearing and failure.
Degradation and failure of MEAs during laboratory testing
The RHC AST at 80°C resulted in no observable increase in gas crossover in either the P5, HD6, or Nafion XL MEAs after >20,000 cycles (1,333 hours) of testing (Figure 2a), which is consistent with the work of Crum and Liu.8 This AST was not able to differentiate between MEAs without mechanical reinforcement (P5 and HD6), and Nafion XL MEAs, which contain PTFE reinforcement that is known to substantially improve PEM mechanical durability.41 Further, the divot-type failure observed after field operation was only replicated in one location of the P5 MEA and was absent in the HD6 MEA.
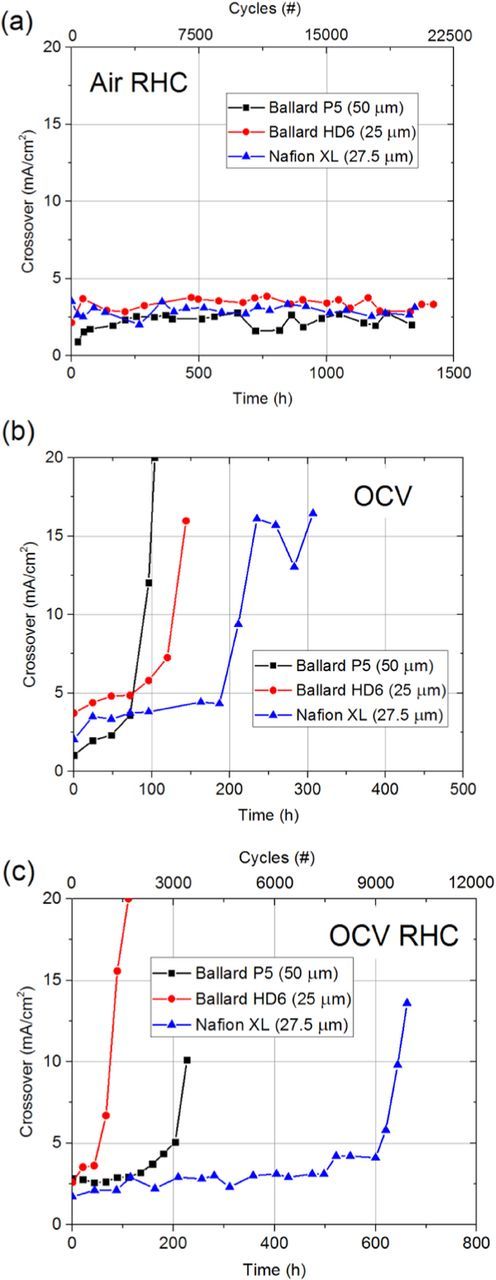
Figure 2. Gas crossover rates of Ballard and Nafion XL PEMs during (a) RHC, (b) OCV, and (c) OCV RHC ASTs.
As shown in Figure 3b, this test did, however, result in local PEM tears near the cathode side of the P5 MEA, similar to those observed after field operation (Figure 1c). Here, there is a strong correlation between the location of cathode CL cracks in fresh MEAs (Figure 3a) and mechanically-induced cracks in the AST-tested MEAs (Figure 3a), which is in good agreement with the results of Singh, et al.42 Although the RHC AST has the ability to replicate mechanical failure via PEM cracks, it does not provide sufficient acceleration of field stresses, which does not enable it to have the ability to differentiate between PEMs with different mechanical properties on a reasonable time scale.
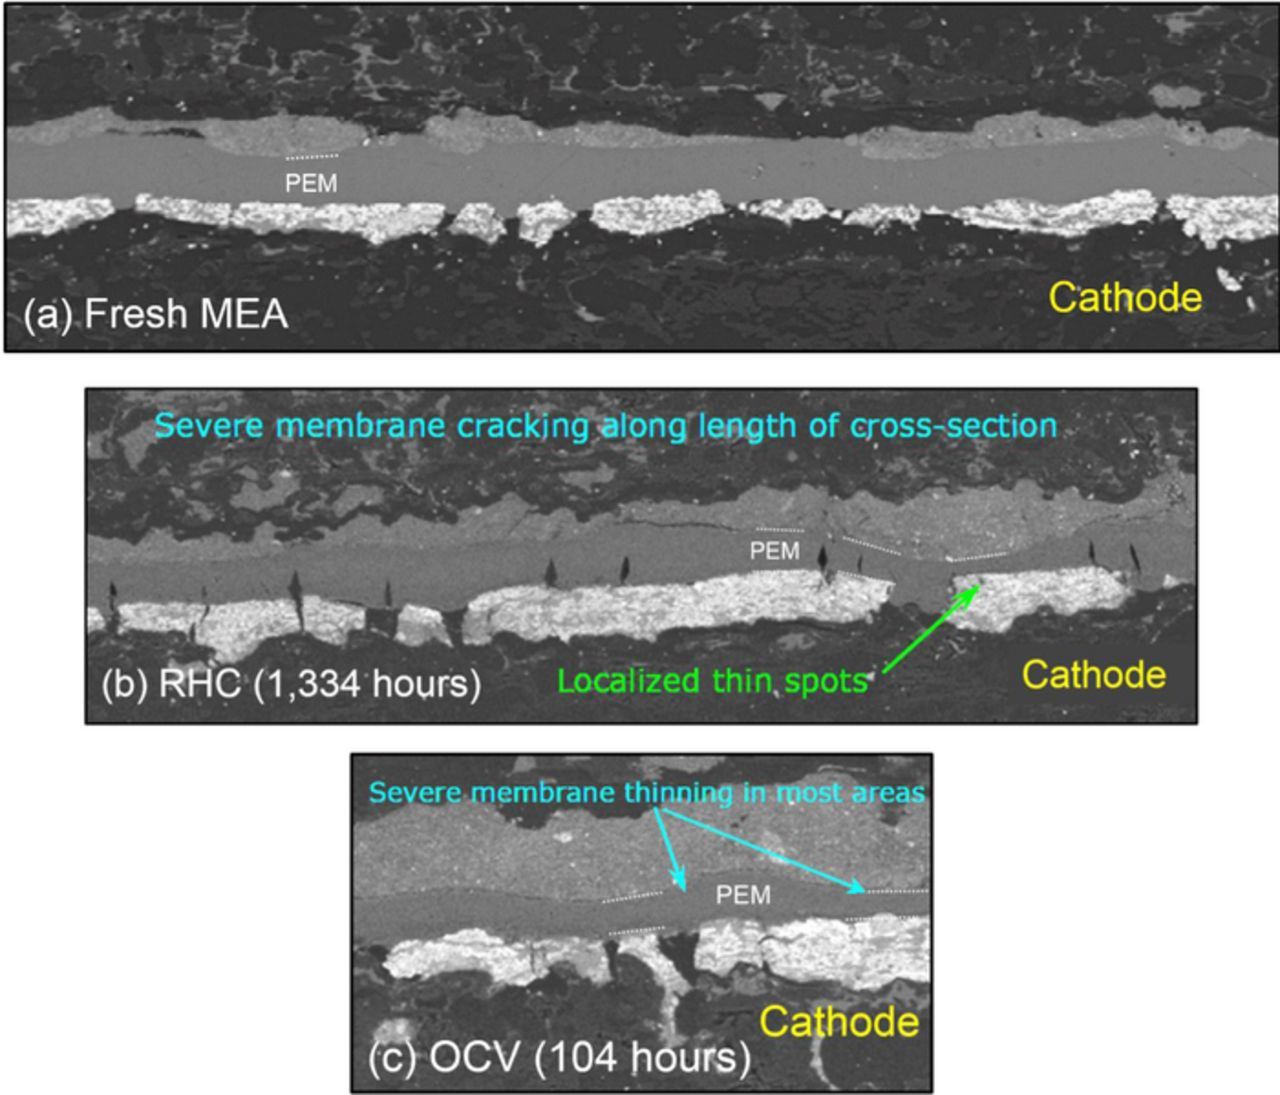
Figure 3. Cross sectional SEM micrographs of Ballard P5 MEAs (a) before testing and after (b) RHC and (c) OCV ASTs. The cathode CL is at the bottom of each micrograph.
The steady-state OCV AST at 30% RH and 90°C resulted in failure of the P5 and HD6 MEAs after ∼100 hours, while the Nafion XL MEA failed after ∼250 hours (Figure 2b). This test also caused significant global PEM thinning in both the P5 (Figure 3b) and Nafion XL MEAs (Figure 4) without through-thickness cracking or CL delamination. Thinning rates for different ASTs shown in Table II were calculated using previous data,43 along with the SEM micrographs shown Figure 4. These results demonstrate that OCV testing at high temperature and low RH increases PEM thinning rate by over two orders of magnitude compared to field-tested MEAs. Further, the Nafion XL MEA contains Ce-based radical scavengers and reduces thinning by a factor of 3x during the OCV AST compared to the Ce-free P5 and HD6 PEMs, which is reflected from membrane thinning data shown in Table II. However, even the non-stabilized MEAs operated under field conditions in the buses show no thinning, indicating that this AST overestimates the impact of chemical degradation in the field by a factor of >100x. It should be noted that mechanical PEM failure occurred in the field before any noticeable membrane thinning occurred. Thus, it is suggested that the OCV AST does not accurately capture the magnitude of PEM degradation occurring in the wetter bus module environment.
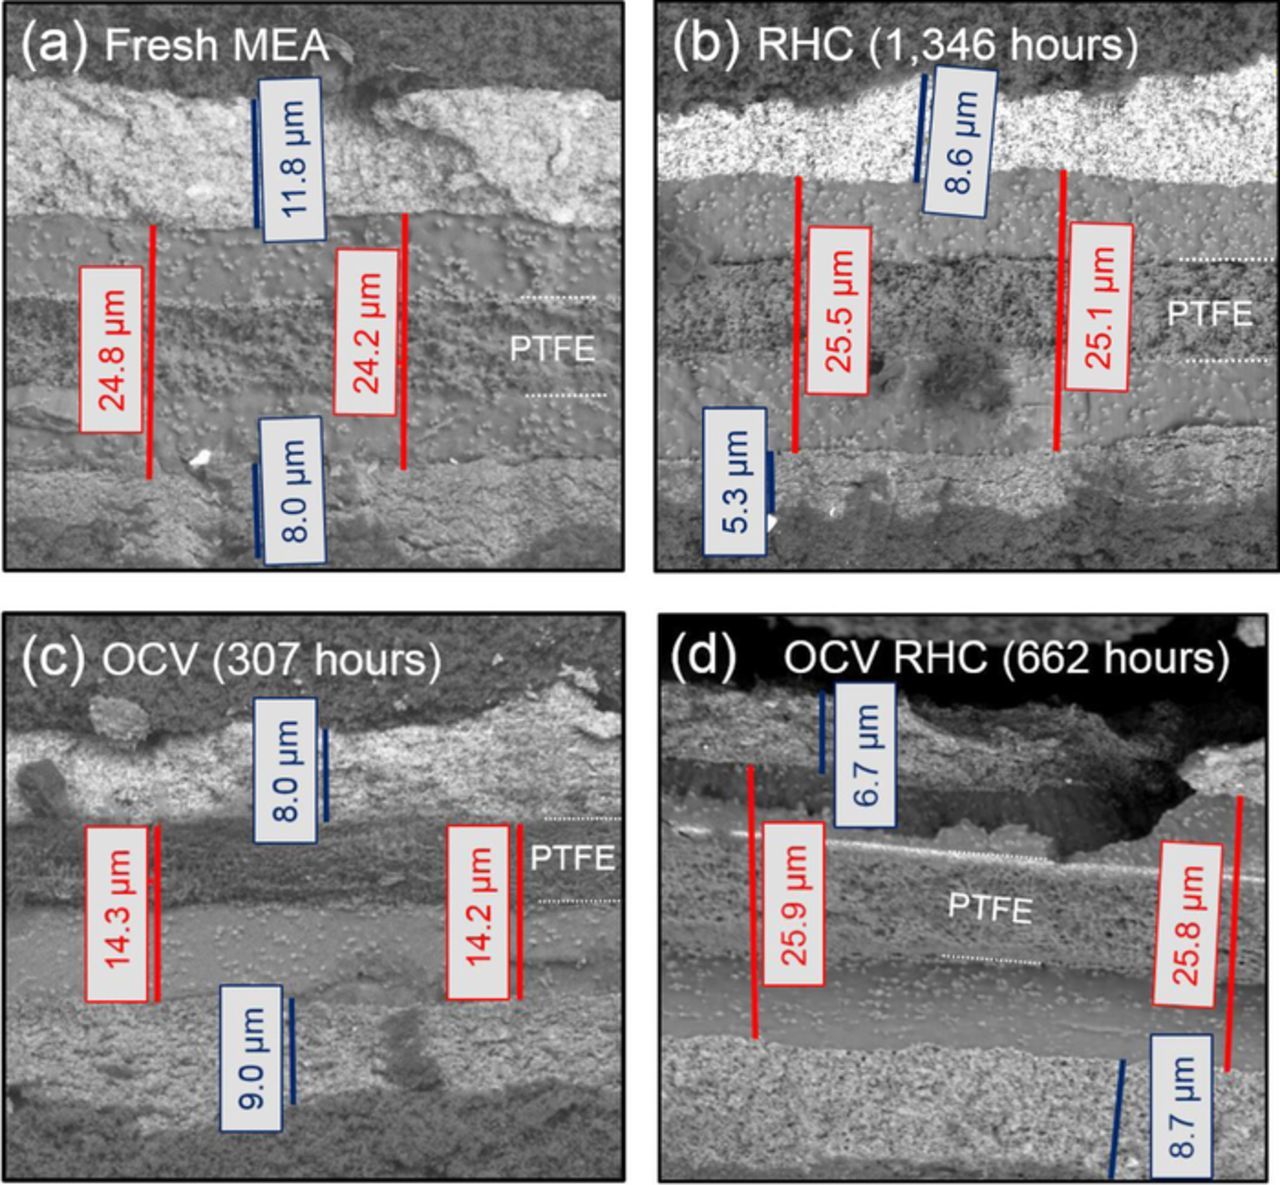
Figure 4. SEM micrographs showing Nafion XL MEA cross sections near the outlet of (a) an untested MEA, and after AST testing with (b) RHC, (c) OCV, and (d) OCV RHC ASTs. The cathode CL is near the top of each micrograph. The PEM and CL thicknesses are indicated by red and blue scale bars, respectively. The location of the PTFE reinforcement layer is also shown.
Table II. Thinning rates of field- and AST-tested MEAs.
| Sample | Thinning rate (nm/hr) |
|---|---|
| Field tested (Ballard avg.) | 0.21 |
| 90°C OCV (Ballard avg.) | 77.1 |
| 90°C OCV (Nafion XL) | 27.2 |
| 90°C OCV RHC (Nafion XL) | 0.29 |
As shown in Figure 2c, the 90°C OCV RHC AST resulted in the failure of the HD6 and P5 MEAs after ∼100 and ∼200 hours, respectively, where PEM cracking and local PEM thinning were also observed. The Nafion XL MEA failed after ∼675 hours. As shown in Table II, during the OCV RHC AST protocols, PEM thinning rates are more similar to the field data. These results imply that the magnitude of chemical degradation during OCV RHC is significantly less than that during the constant 30% RH OCV test, alone. The reduction in chemical stress is attributed to the 2 minute hydration component of the cycle. As the MEA becomes humidified, sulfonic acid end groups in the PFSA are fully ionized and exist in the inert proton form (–SO3−) which are not susceptible to hydrogen abstraction by the hydroxyl radical.44 Such hydrogen abstraction leads to irreversible degradation of the side chain which results in complete chemical decomposition of the main chain and side chains associated with that PFSA molecule.43 Presumably, during both field operation and the OCV RHC AST, the PEM is chemically degraded until mechanical failure occurs. The magnitude of this chemical degradation, however, is significantly less than that at OCV, alone.
Gas crossover measurements and SEM micrographs indicate that even beyond DOE AST targets, the RHC AST does not significantly accelerate PEM degradation and local failure. Conversely, the OCV AST introduces a mode of global PEM thinning which was not observed during field operation. The OCV RHC AST results in mechanical membrane failure that is accelerated by the chemical degradation, with the ability to distinguish between various types of membranes within a reasonable testing time. Therefore, to better capture the modes of PEM degradation and failure observed in the field, the combined chemical/mechanical OCV RHC AST is recommended. While the mechanical properties of the PEM during these ASTs were not measured directly, it is clear that their decay is significantly enhanced during the OCV RHC AST compared to field and drive cycle operation. As a result, using the OCV RHC AST, PEM stability may be assessed in hundreds of hours, compared to the latter modes of operation, which can require thousands of hours of testing.
Changes to ionomer morphology after field, drive cycle, and AST testing
To develop a better understanding of the changes in morphology of PEMs induced by various degradation modes, SAXS/WAXS of membranes were examined before and after durability testing. The SAXS results shown in Figure 5 indicate changes to the hydrophilic domain spacing for the different membranes and testing conditions. The broadness and the peak location of the ionomer SAXS peak change significantly after testing for both Ballard and Nafion membranes. Compared to the fresh, beginning of life (BOL) samples, two key changes are observed in the SAXS spectra of the tested/failed MEAs: (i) the ionomer peak shifts to the left indicating a larger average correlation length, which is attributed to the hydrophilic domain spacing, d-spacing, and (ii) the peak becomes broader indicating a wider distribution of d-spacing and weaker phase-separation.
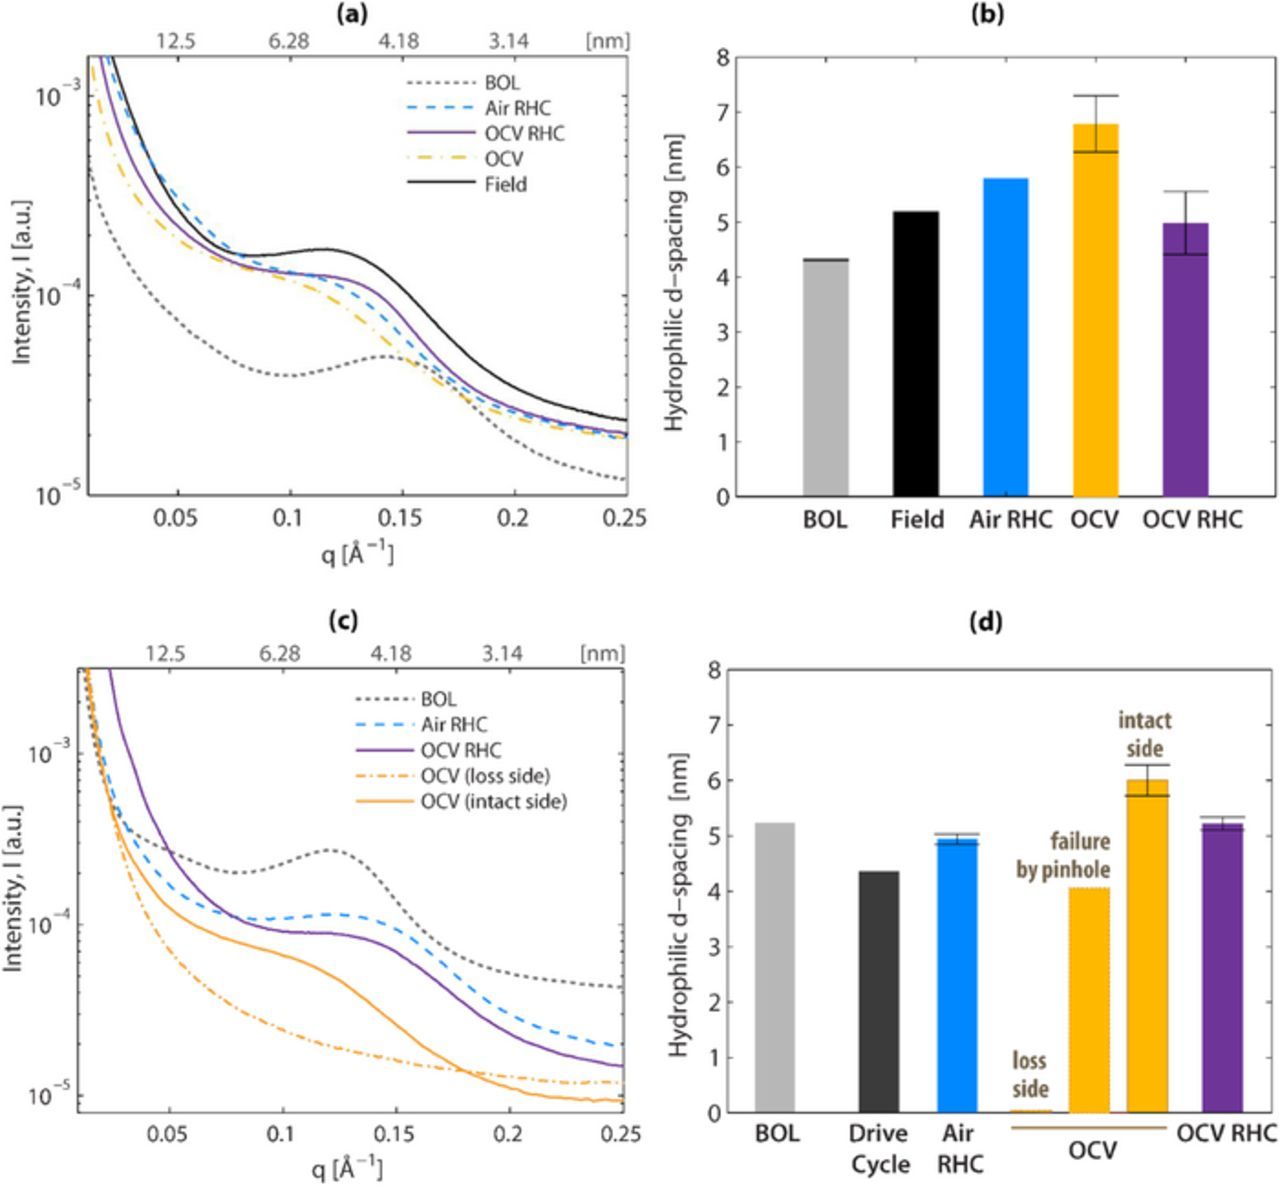
Figure 5. SAXS spectra and corresponding domain spacing for hydrated (a,b) Ballard and (c,d) Nafion XL MEAs exposed to different test conditions.
Changes to the hydrophilic domain spacing were measured after ASTs using SAXS (Figure 5). The d-spacing values for fresh MEAs are 4.5 ± 0.5 nm. The d-spacing of Ballard MEAs increases by 20% after RHC or drive cycles (Figure 5b). In these MEAs, domain spacing in both RHC and OCV RHC ASTs are more similar to the field-tested MEA than the OCV-tested MEA, which is substantially increased. This result is consistent with previous electron microscopy studies that show an increase in the spacing of sulfonic acid domains due to chemical degradation.45 A similar trend exists for the Nafion XL MEAs (Figure 5d). The most dramatic change in Nafion XL membranes occurs after the OCV test, which increases d-spacing to 6 nm. In the RHC and OCV RHC-tested Nafion XL MEAs, d-spacing was actually decreased, which may be attributed to increased concentrations of Ce ions in the active area of the membrane, which have previously been measured during humidified operation.37 Increased Ce contents may reduce d-spacing through ionomer-cation interactions and loss of local water uptake.46 The effects of cation migration on ionomer water uptake and structure are currently under investigation by our labs.
It is worth noting that nanostructural changes in the membrane after an OCV test changes depending on the location probed, concurrent with the microscopic changes observed in SEM images such as shown in Figure 4c. While a specimen probed on the cathode side, where heavy ionomer loss occurred (denoted loss side), does not give rise to any discernable scattering signal, the ionomer from the lower-loss anode side (denoted intact side) exhibits a typical SAXS spectra, albeit with a very broad peak. In addition, the d-spacing of the membrane that failed by pinhole formation shows a relatively smaller change in d-spacing which is comparable to the d-spacing of a fresh, BOL membrane. Thus, degradation-induced changes in nanostructure of ionomers manifest themselves the most in terms of degree of phase-separation, which can be associated with the domain-network properties and degree of structural disorder. Such changes in the morphology could also imply strong variation in transport properties and structural integrity of the ionomer, which could be related to membrane performance during the tests.
Overall, degradation-induced changes vary depending on both the membrane and type of tests, yet OCV is the most severe test for both membranes in terms of its impact on the nanostructure, in accordance with previous observations. Moreover, after an OCV test, nanostructural changes in the ionomer could also vary throughout the MEA due to the non-uniform material loss and local failure. Therefore the SAXS data provides morphological evidence toward the severity of the OCV test while confirming that the RHC OCV AST closely reproduces the morphological changes caused by the field (Ballard) and drive cycle durability (Nafion XL) tests.
Changes in crystallinity were measured after ASTs using WAXS (Figure 6). Since WAXS probes the relative degree of crystallinity, the values should be compared within the same sample set to assess the changes due to ASTs. The OCV AST increases crystallinity in both cases (Ballard MEAs in Figure 6a and Nafion XL MEAs in Figure 6b), whereas OCV RHC and RHC AST tested samples are most similar to field and drive cycle.
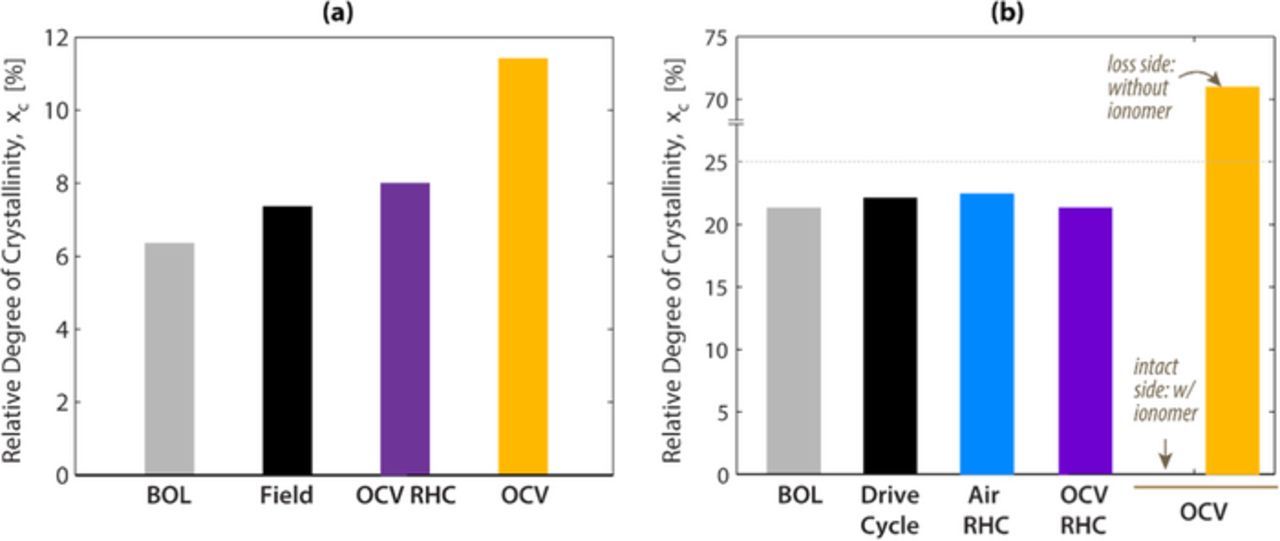
Figure 6. Relative degree of crystallinity calculated from WAXS spectra for (a) Ballard and (b) Nafion XL MEAs after different test conditions.
An interesting outcome of chemical degradation in Nafion XL after the OCV test is that the crystallinity is drastically reduced on the intact side of the membrane. It is inferred that at this location, chemical degradation destroys the structure of the PFSA molecules, which shortens the PTFE backbone length, thereby breaking the crystalline structure into amorphous one. On the loss side of the membrane, which is comprised of the PTFE reinforcement, the degree of crystallinity increases to over 70%, which is closer to the value of PTFE. Such high values of xc were reported and attributed to the crystalline features of the reinforcement phase in a previous study.33 These results indicate that the OCV AST test results in a significant change in the crystallinity of the ionomer which is not observed in either field or drive cycle operation. This extra degradation mode is not observed in the RHC OCV AST samples, providing further credence that the RHC OCV AST is more representative of the degradation modes present during typical PEM fuel cell operating conditions.
Under severe conditions of the OCV AST at 30% RH, while the ionomer phase of the MEA loses its characteristic features of phase-separated nanostructure, the intact reinforcement phase appears to preserve its structural integrity. Chemical degradation of the ionomer results in increased d-spacing and extreme chemical degradation can result in increased crystallinity of the ionomer. Mechanical degradation does not appear to induce any permanent change in ionomer structure (e.g., EW, backbone structure) and therefore does not affect the crystallinity of MEAs and can result in only a slight increase/decrease in d-spacing of the ionomer in PEMs, regardless of the presence of PTFE support.
Therefore, depending on the application, it is important to have an accurate combination of chemical and mechanical stressors in an AST to correctly reflect failure mechanisms in the field or a simulated drive cycle. Both SAXS and WAXS results of MEAs after various tests confirm that the morphological changes during field and drive cycle operation are most accurately reproduced by the mechanical RHC and chemical/mechanical OCV RHC ASTs rather than by a chemical OCV AST, alone.
Refining the RHC durations of the OCV RHC AST to match drive cycle durability
At OCV, 2 minute wet/dry cycles (denoted 2m/2m) were shown to fail mechanically a Nafion XL PEM without significant thinning (Figure 4d), which is similar to the wet U.S. DRIVE drive cycle-tested sample in terms of thinning rate (Table II), water domain spacing (Figure 5), and crystallinity (Figure 6). During automotive operation, however, MEAs experience drier, more aggressive conditions compared to either the bus field operating conditions or the OCV RHC.
To increase the magnitude of chemical stress in the OCV RHC AST, the 2 minute cycles were adjusted to 30 and 45 seconds of wet and dry operation, respectively (denoted as 30s/45s). Figure 7a shows the changes in HFR during the two cycling protocols, which are inversely proportional to the hydration of the PEM. Changing the cycle duration from 2m/2m to 30s/45s increases the number of hygral variations per unit time by a factor of 3 (Figure 7a).
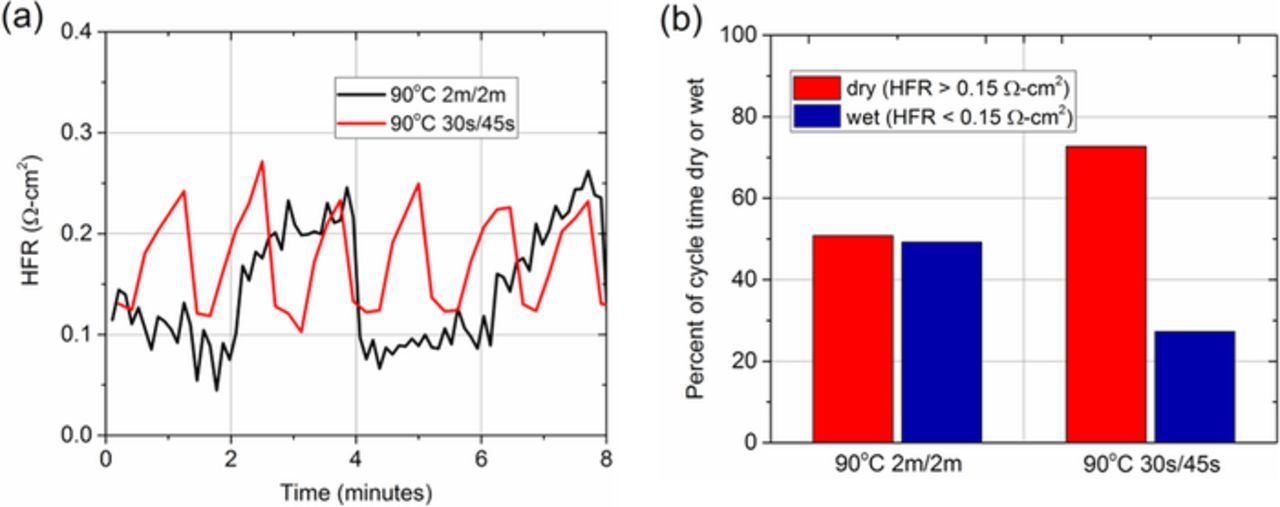
Figure 7. Changes in (a) HFR and (b) duration in each hydration regime for Nafion XL MEAs during OCV RHC ASTs at 90°C with 30s/45s and 2m/2m cycle durations.
As shown in Figure 7b, by adjusting the duration of the wet and dry intervals, the duration of the dry phase in each cycle (HFR > 0.15 Ω-cm2) is increased relative to the duration of the wet phase (HFR < 0.15 Ω-cm2). A 2m/2m cycle has approximately equal time dry and wet, whereas a 30s/45s cycle has about 75% dry time/25% wet time. This increased duration in the dry phase, along with increased temperature, leads to a higher magnitude of chemical stress, as explained above.
The gas crossover rates of Nafion XL MEAs during OCV RHC ASTs performed at 90°C with different cycle durations are shown in Figure 8. When cycle time is modified from 2m/2m to 30s/45s, AST lifetime decreases slightly from 660 to ∼600 hours. Here, the increased frequency of hygral cycles which result from reducing the cycle duration does not significantly reduce time to failure. This is consistent with previous results which suggest that MEA lifetime is more strongly influenced by the magnitude of stress and the accumulated time under stress rather than the amount or frequency of stress cycles.25 And indeed, as shown in Figure 7b, in the 30s/45s cycle, the magnitude of the hygral change during each cycle is ∼25% less than the 2m/2m cycle due to the shorter duration in the wet phase. Therefore, during this cycle duration the increase in chemical stress is offset by a decrease in mechanical stress which results in a very similar lifetime compared to the 2m/2m protocol.
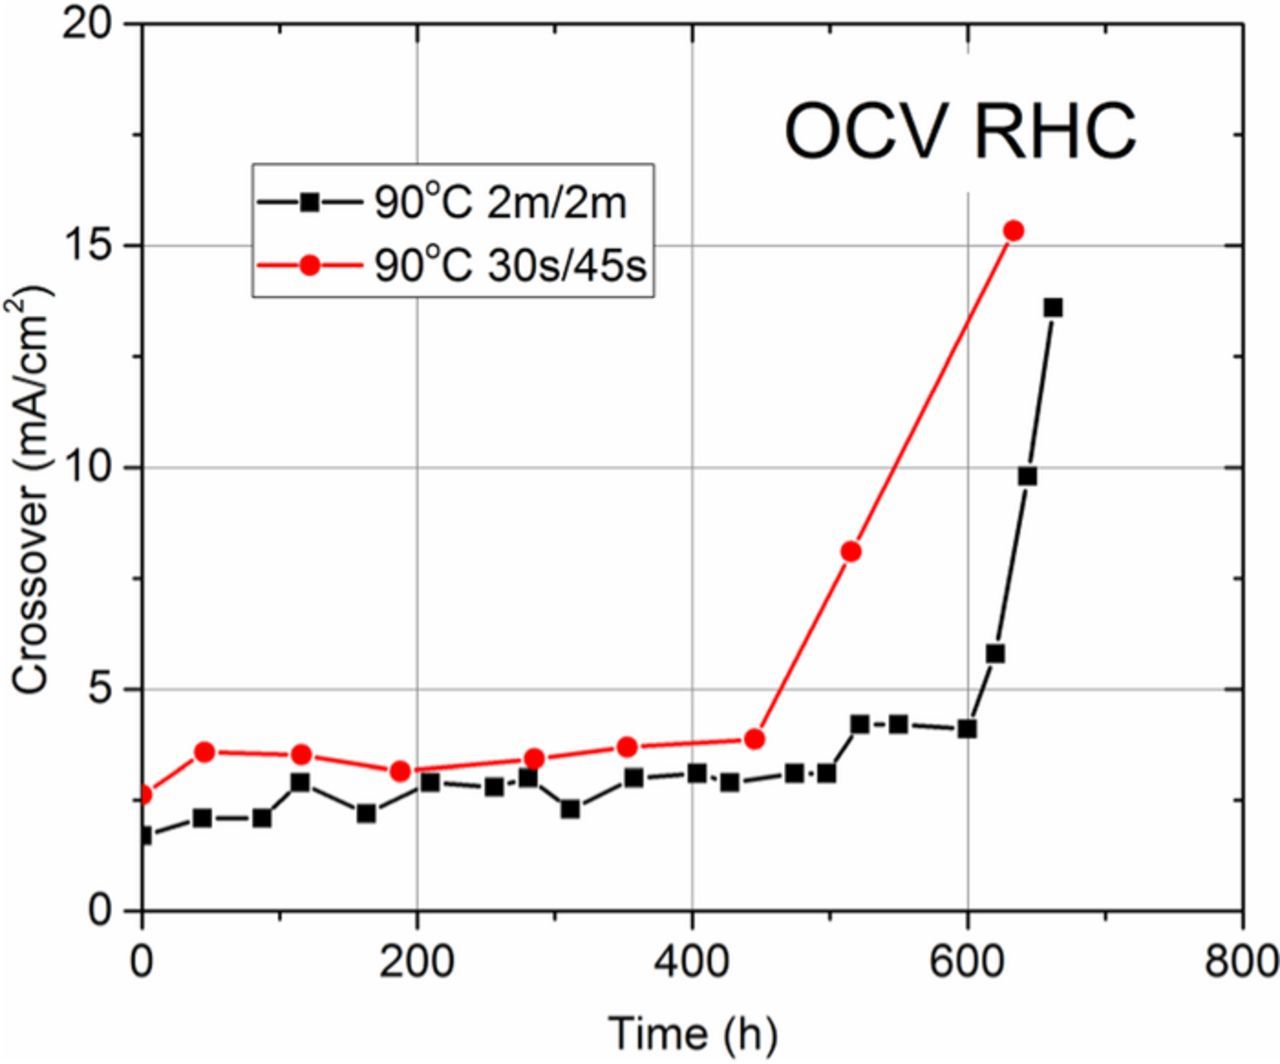
Figure 8. Gas crossover rates of Nafion XL MEAs during OCV RHC ASTs at 90°C with 30s/45s and 2m/2m cycle durations.
Since cross-sectional SEMs and X-ray scattering data for field-tested automotive MEAs are not yet available, the U.S. DRIVE drive cycle durability protocol was utilized for validation of ASTs. This protocol is designed to replicate stressors during automotive operation. In order to replicate bus operation, this protocol was also modified by eliminating the dry regime of the cycle (called "wet" drive cycle), as described above in the Experimental section.
The cross-sectional SEM micrographs of drive cycle tested MEAs and an MEA tested using the modified 30s/45s OCV RHC AST are shown in Figure 9. From this SEM data, thinning rates were calculated and compared to the Ballard field data, as shown in Table III. Here, it is observed that the drive cycle and the 30s/45s OCV RHC AST have similar thinning rates, which are 6x faster than Ballard field-tested and wet-drive cycle thinning reflecting the drier automotive environment.
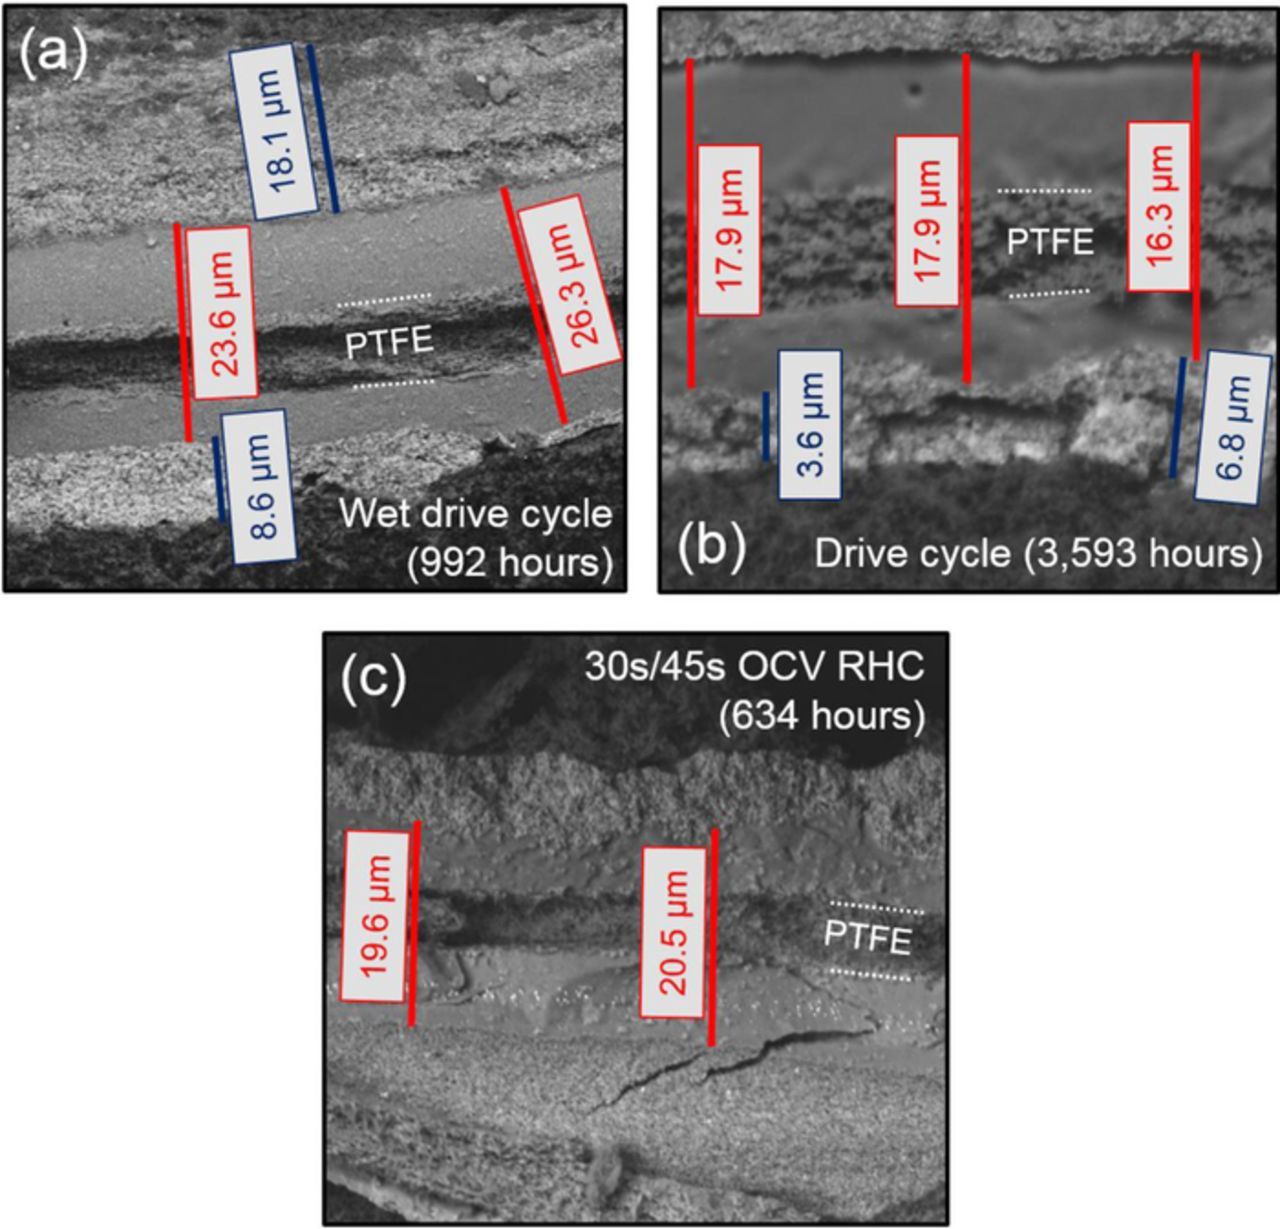
Figure 9. SEM micrographs showing Nafion XL MEA cross sections near the outlet after (a) wet U.S. DRIVE drive cycle testing, (b) U.S. DRIVE drive cycle durability testing, and (c) OCV RHC ASTs with 30s/45s cycles. The cathode CL is near the top of each micrograph. The PEM and CL thicknesses are indicated by red and blue scale bars, respectively. The location of the PTFE reinforcement layer is also shown.
Table III. PEM thinning rates for field-, drive cycle-, and modified OCV RHC AST-tested MEAs.
| Sample | Thinning rate (nm/hr) |
|---|---|
| Field tested (Ballard avg.) | 0.21 |
| Wet drive cycle (Nafion XL) | 0.75 |
| Drive cycle (Nafion XL) | 2.39 |
| 90°C 30s/45s OCV RHC (Nafion XL) | 1.93 |
During the drive cycle test, the average FER was 0.102 mg/cm2-h, while during the 30/45s OCV RHC test, it was 0.11 mg/cm2-h. These comparable FERs further suggest that the magnitude of chemical stress is similar between the 30s/45s OCV RHC AST and the U.S. DRIVE drive cycle durability protocol. Therefore, it is concluded that this RHC OCV AST protocol is most similar to the U.S. DRIVE drive cycle durability protocol and is most representative of the degradation MEAs experience during automotive operation. As fuel cell electric vehicles increase in prevalence, the availability of field-tested MEA data will be useful to further validate this modified protocol.
Conclusions
A new combined chemical/mechanical AST was developed for PEM durability, which incorporates RH cycling at OCV. This AST is shown to match changes in PEM thickness and nanomorphology most accurately compared to field- and drive cycle-tested MEAs. RHC testing in inert gases only imparts mechanical stresses on an MEA, which is shown to reproduce the local divot-type failures with the absence of global thinning, as shown in the field. However, because it is too benign, it cannot differentiate between MEA types in reasonable test durations. On the other hand, OCV testing at high temperature and low RH results in severe global PEM thinning which is over 2 orders of magnitude larger than that observed in the field, which does not accurately replicate the degradation modes observed during field operation.
By tuning the OCV RHC wet/dry cycles from 2m/2m to 30s/45s, the MEA experiences longer durations in the dry regime, which increases the magnitude of chemical stress during the test. As a result, the latter protocol is more representative of automotive operation, while the former is valid to simulate stressors present during bus operation. These new AST protocols will allow for more rapid screening of materials compared to drive cycle testing, which will enable the development of materials to address durability barriers that currently hinder widespread adoption of PEM fuel cells.
Acknowledgments
This work was supported by the Fuel Cell Technologies Office at the U.S. Department of Energy - Energy Efficiency and Renewable Energy. We acknowledge Dimitrios Papageorgopoulos (Fuel Cells Team Leader) and Nancy Garland (Technology Development Manager) for financial support through the FC-PAD consortium. This work made use of facilities at the Advanced Light Source Beamline 7.3.3, supported by the Office of Science, Office of Basic Energy Sciences, of the U.S. Department of Energy (Contract No. DE-AC02-05CH11231). The authors also wish to acknowledge John Davey, David Langlois, and Dennis Torraco for assistance with the ASTs.
ORCID
Rangachary Mukundan 0000-0002-5679-3930
Andrew M. Baker 0000-0001-8648-5579
Ahmet Kusoglu 0000-0002-2761-1050
Adam Z. Weber 0000-0002-7749-1624
Rodney Borup 0000-0001-7647-1624