Abstract
Potentiometric redox measurements were made in solutions of increasing biological complexity starting with buffer solutions containing either potassium ferri/ferrocyanide or ascorbic acid and finishing with plasma and blood. When the concentration of ferri/ferrocyanide was high (∼0.2 mM), both biofouled planar and nanoporous gold electrodes gave Nernstian slopes of 55–59 mV. However, at or below a critical concentration (≤ 0.1 mM), ∼20% loss in sensitivity was observed at planar gold in contrast to nanoporous gold where Nernstian behavior was retained. For ascorbic acid, a Nernst slope of −41 mV was observed at biofouled nanoporous gold electrodes. In contrast, biofouled planar gold electrodes failed to give any potentiometric redox response. At all concentrations studied, cyclic voltammetric measurements on biofouled electrodes revealed significant impairment of faradaic electroactivity at planar gold electrodes while no impairment was shown at nanoporous gold. These results indicate that nanoporous gold is an ideal electrode material to use when making both potentiometric and cyclic voltammetric measurements, particularly in complex solutions containing relatively low concentrations of redox molecules. As proof of concept, the redox potential of plasma and blood has been measured using nanoporous and planar gold electrodes and their values compared.
Export citation and abstract BibTeX RIS

This is an open access article distributed under the terms of the Creative Commons Attribution Non-Commercial No Derivatives 4.0 License (CC BY-NC-ND, http://creativecommons.org/licenses/by-nc-nd/4.0/), which permits non-commercial reuse, distribution, and reproduction in any medium, provided the original work is not changed in any way and is properly cited. For permission for commercial reuse, please email: oa@electrochem.org.
Potentiometry is a technologically simple and inexpensive approach to obtain important information about the redox state of a system and/or the concentration of ions in solution.1,2 The measurement itself is simple in that all that is needed is a high impedance voltammeter, a stable reference electrode, and a suitable indicating electrode. In contrast to voltammetric measurements, no current flows, and the concentration of the redox species in solution does not change nor does the indicating electrode surface become altered as a potential is not applied. Likely the most popular potentiometric measurement is the measurement of pH using an ion-selective electrode that incorporates a thin membrane responsive to the activity of protons in solution.3
For the work described herein, the indicating electrode is an inert metallic redox electrode that is purposely designed to be nonselectiveand will 'ideally' respond to all redox active species in solution able to exchange electrons with the metallic surface.1,2 When the indicator electrode is immersed in solution, it will equilibrate electrochemically with the dissolved redox species and a potential will develop at its surface. The measured potential is governed by factors such as (1) the redox species present, (2) their concentrations (activities), and (3) the rate of electron exchange with the electrode.2,4,5 Such redox measurements have been used to characterize the redox state of solutions with a complex matrix including milk, cheese, sludge, water and biological systems.6–13
An important and often neglected factor in the measurement of redox potential is the nature of the electrode surface, particularly the presence and extent of modification, contamination, and fouling/poisoning, as these variables can significantly reduce electron exchange rates. Natural systems, which often contain many redox species with varying electron exchange rates, are particularly challenging to study.4,14 It is possible that the measured redox potential is governed by one species, particularly if its concentration and electron exchange rate is significantly higher than other species present in solution.5,14 To increase the quantitative usefulness of redox potential measurements in complex environments, it's necessary to design electrodes that will minimize the impact of contamination on the electrode response and facilitate electron exchange with as many redox species as possible.2
In this work, we closely examined two electrodes - planar gold and nanoporous gold15–17 - and evaluated their potentiometric redox response in solutions of increasing biological complexity. Nanoporous gold (NPG), in particular, has been shown to minimize the effect of biofouling on an electrochemical response via a biosieving-like mechanism18–20 and facilitate charge transfer via nanoconfinement.21 In this work, the potentiometric response of nanoporous and planar gold electrodes previously exposed to a known biofouling agent was examined. First, a solution containing low concentrations of both forms of a redox couple with relatively fast electron transfer kinetics was studied. These experiments were then followed by experiments using a biologically relevant redox species, ascorbic acid. The redox potential of plasma and blood was then measured for the first time at NPG electrodes. We show that the concentration of the redox species is crucial in evaluating the sensitivity of the electrode in biofouling solutions and, furthermore, we show that nanoporous gold electrodes can be advantageous to use in solutions that contain a complex matrix.
Experimental
Electrode preparation
Planar gold slides were prepared by sonicating gold mirror slides (EMF Corporation) in ethanol followed by DI water for 10 minutes each. After drying with a stream of nitrogen gas, the gold slides were plasma cleaned (Southbay, 18 W) for 5 minutes and further cleaned by placing them under UV radiation (20 W) for at least six hours. Nanoporous gold (NPG) was prepared by dealloying 12 Karat gold leaf (Manetti, Fine Art Store) in concentrated nitric acid for 13 minutes (Caution: Nitric acid is dangerous).20 The etched leaf was transferred to a large petri dish filled with DI water, and left to sit in the water for at least 10 minutes. Using tweezers, a small clean planar gold slide was used to gently pick up the fragile gold leaf. The NPG electrode was dried with nitrogen gas and then left under UV radiation for at least 6 hours. The thickness of the nanoporous gold leaf is ∼110 nm as measured from cross-sectional scanning electron microscope images (SEM, Hitachi SU-70). The electrode area was defined by a 1/8 inch circle hand punched into a piece of tape (HYDE), which was carefully placed on the electrode surface just prior to use. The surface area of the NPG electrodes was measured in 0.5 M sulfuric acid as previously described20,22 and was ∼17 times larger than the geometric area.
Electrochemical procedures
Stock solutions of potassium ferri/ferrocyanide or ascorbic acid were prepared in pH 7.4 phosphate buffer (0.1 M in 0.1 M KCl), unless otherwise noted. To biofoul the surfaces, the electrodes were first vertically placed in 1 mg/mL of fibrinogen (Bovine, MP biomedical) in phosphate buffer. After soaking for several hours, the electrodes were removed and gently rinsed with DI water. The potentiometric experiments were initiated by pipetting a known volume of potassium ferricyanide [Fe(CN)6]3− into a 10 mL glass beaker. The open circuit potential (OCP; also referred to as a rest potential or equilibrium potential) was potentiometrically measured using a CHI potentiostat against a AgCl coated Ag wire reference electrode. After 10 minutes, aliquots of potassium ferrocyanide [Fe(CN)6]4− were added every ∼5 minutes while the solution gently stirred and the OCP measured. Upon completion of the potentiometric experiment, a CV was acquired at 50 mV/s. In this case, a Pt auxiliary electrode was also used. For the ascorbic acid experiments, a known volume of buffer was added to a 10-mL beaker and aliquots of 5 mM ascorbic acid were added while the OCP was measured. Fresh heparinized waste blood was obtained from the apheresis clinic at VCU, centrifuged and the plasma stored at −4°C and was used the following day.
Results and Discussion
Background
Potentiometric experiments are simple and inexpensive to implement and hold considerable promise as a tool to probe redox chemistry in unconventional solutions. Recent work by others have also indicated that potentiometry is less sensitive to the effects of biofouling as compared to cyclic voltammetry23 - at least at high concentrations - and perhaps lending itself well to probe redox chemistry in biological solutions. However, careful attention needs to be given to the electrode surface and the role it plays in the observed response, particularly in solutions that contain low concentrations of redox molecules such as those found in many natural systems that may contaminate/modify the electrode surface.14,24 To evaluate the impact of biofouling in more detail, we examined the potentiometric and voltammetric response of dilute solutions of a poised redox system consisting of potassium ferri/ferrocyanide (0.2, 0.1, 0.075 mM) at both planar gold and nanoporous gold electrodes purposely biofouled by exposure to fibrinogen.20,23 The potentiometric response was also examined using an unpoised redox system containing only ascorbic acid. In both cases, comparisons were made to clean electrodes not exposed to fibrinogen. Previous work has shown that albumin, fibrinogen, and other proteins adsorb very quickly on planar electrode surfaces.25–28
Potentiometry of [Fe(CN)6]3−/[Fe(CN)6]4−
Figure 1a shows a representative OCP vs. time trace obtained at a planar gold electrode, previously soaked in fibrinogen for 1.5 hours. The solution contained 0.2 mM [Fe(CN)6]3− to which aliquots of [Fe(CN)6]4− were added. With each addition of [Fe(CN)6],4− the potential decreased as the ratio of [Fe(CN)6]4−/[Fe(CN)6]3− in solution increased. A Nernst plot can be obtained by plotting the OCP vs. log [Fe(CN)6]4−/[Fe(CN)6]3−. As shown in Figure 1b, a linear plot was obtained yielding a slope of −59.8 mV, a y-intercept of 153 mV, and a linear regression coefficient of 0.997. The experimentally determined slope is nearly identical to the expected value of −59.2 mV for this one-electron redox couple at both planar and NPG electrodes. The y-intercept is near the expected value of the formal potential of 142 mV(vs. Ag/AgCl in 0.1 M KCl).24 Nearly identical results were also obtained at NPG previously soaked in fibrinogen.
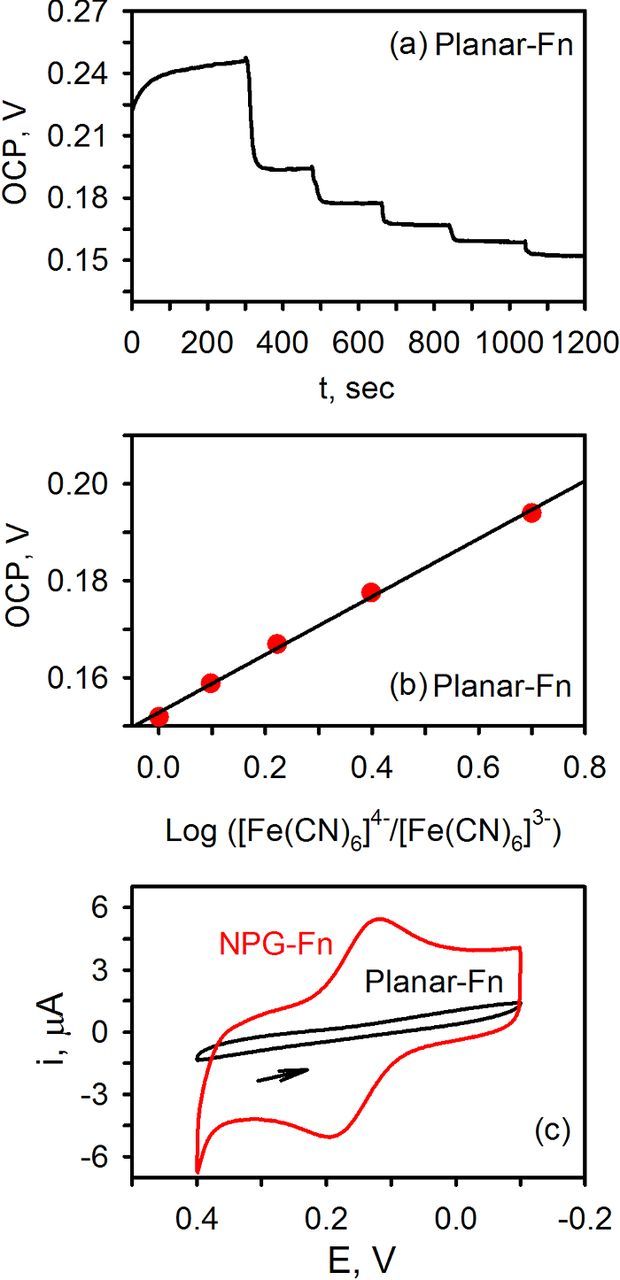
Figure 1. (a) OCP- time traces acquired at a biofouled planar gold electrode in 0.20 mM [Fe(CN)6]3− in pH 7.4 phosphate buffer following successive additions of [Fe(CN)6].4− (b) Corresponding Nernst plot. The solid line is the linear regression fit to the data points: y = −0.0598x + 0.153; R2 = 0.997. (c) CV acquired at the end of the potentiometric experiment, 50 mV/s. The final concentrations of ferri/ferrocyanide in solution were 0.18/0.22 mM.
A cyclic voltammogram (CV) acquired at the end of the potentiometric experiments, however, shows a very different result for the two electrodes, Figure 1c. On NPG, a characteristic CV with a peak splitting of 70 mV and a ratio of the peak faradaic current of 1.0 was observed, indicative of a kinetically fast and well-behaved redox system even after the electrode was exposed to fibrinogen. However, on planar gold, no faradaic response for the ferri/ferrocyanide redox couple was observed. Fibrinogen adsorbs on planar gold electrodes fairly rapidly and blocks electron transfer, thus giving rise to a CV showing only capacitive current.20 On NPG, protein adsorption also takes place. However, because of the electrode's pore morphology (Figure 2) and biosieving capabilities, fast electron transfer can still be achieved.20 In this case, because the nanosized pores are similar in size to fibrinogen molecules, the inner surface stays 'clean' providing a pristine surface for much smaller redox species (e.g., ferricyanide) to freely exchange electrons.20 What is interesting, however, is that at this concentration, the potentiometric response at the two electrodes is nearly identical even though CV shows significant differences as previously noted.23
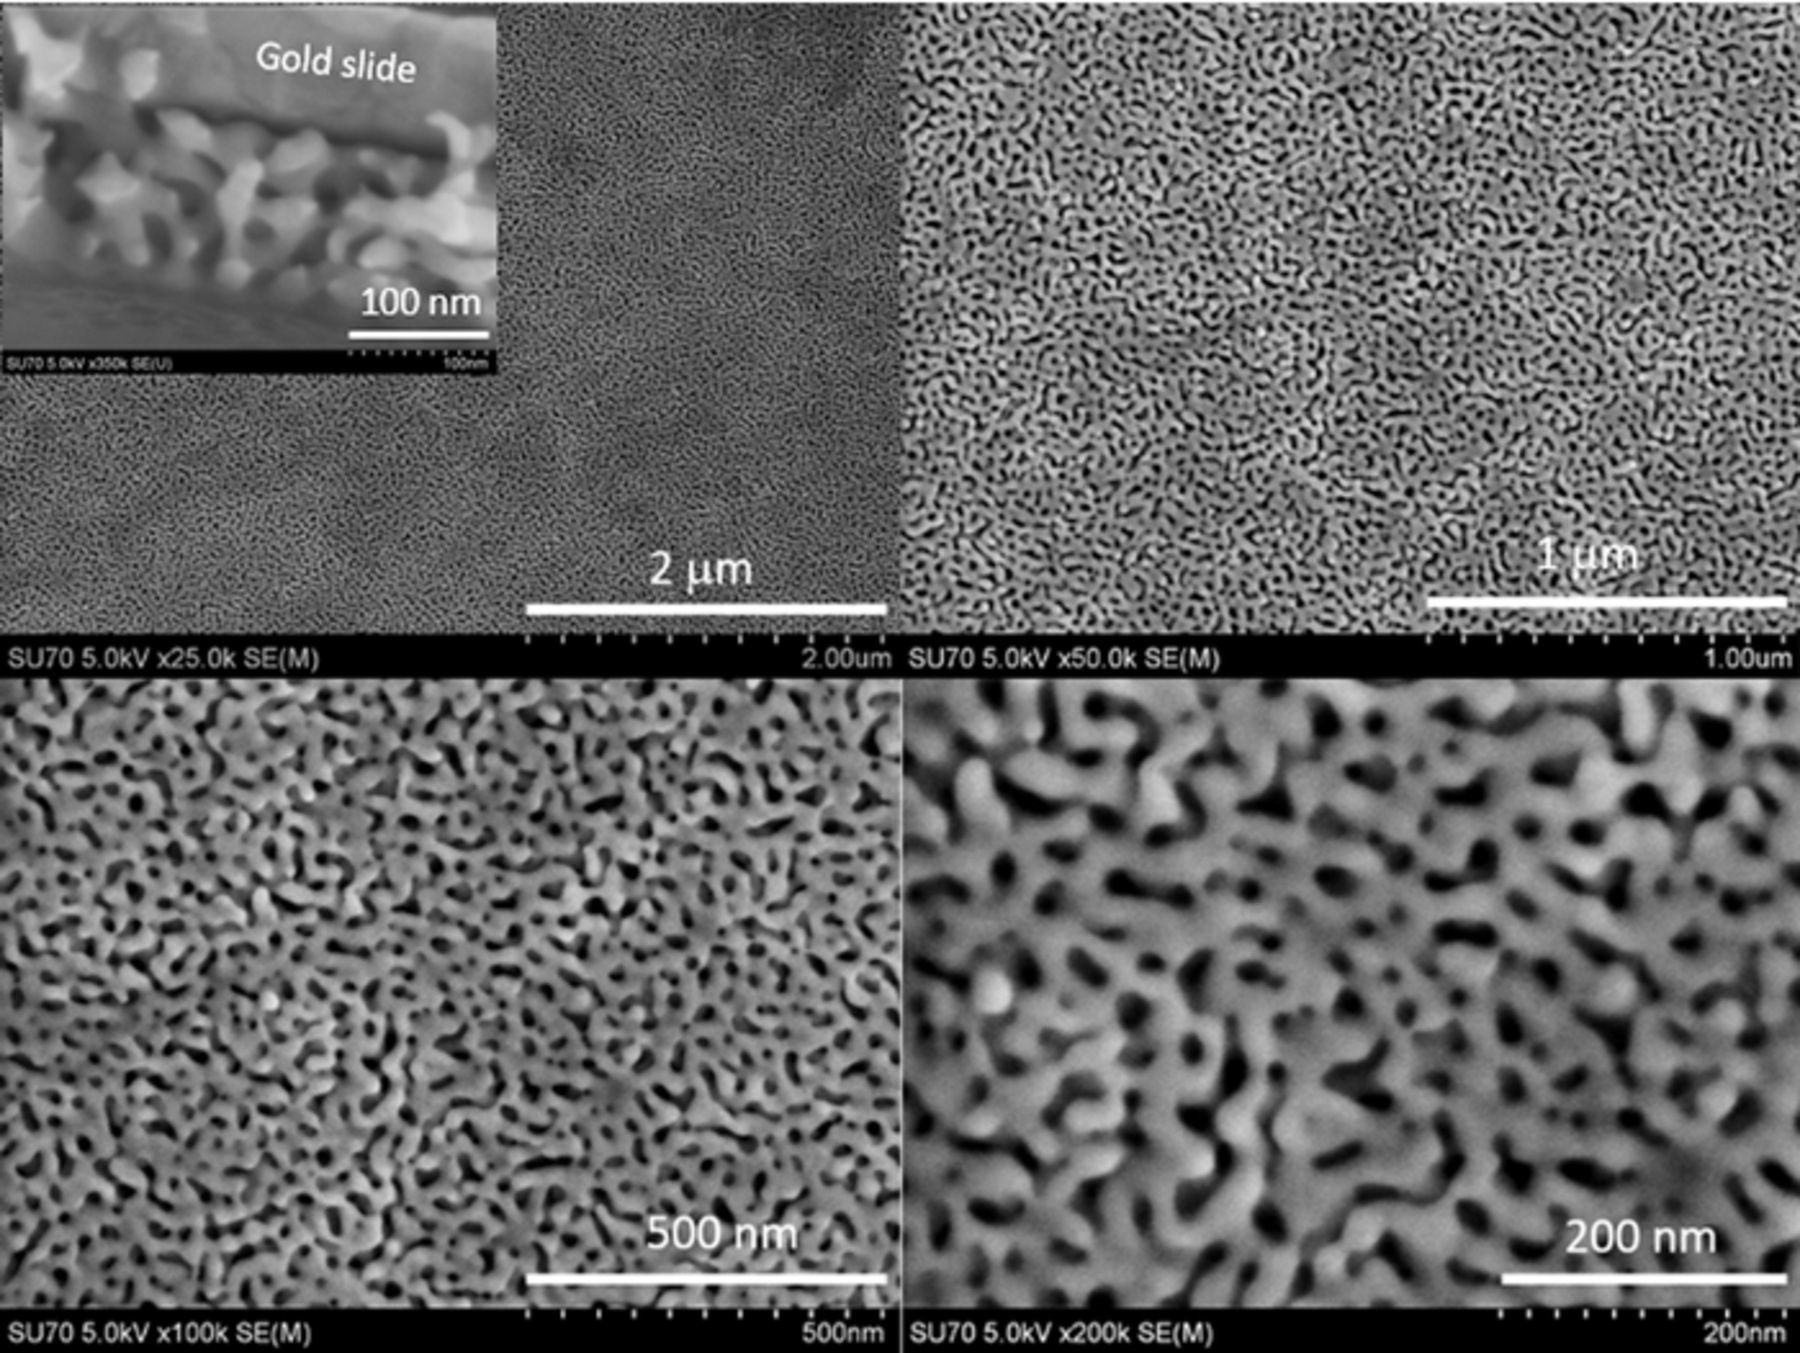
Figure 2. SEM images of nanoporous gold (NPG) at four different magnifications. Inset shows cross-sectional image.
To evaluate the response of the electrodes at low concentrations, the experiments were repeated using 0.1 mM and 0.075 mM [Fe(CN)6]3− solutions. Again, both biofouled and non-biofouled electrodes were examined. OCP-time traces similar to those shown in Figure 1 were observed, Figure 3a. From these results, Nernst plots were generated and the slopes determined by fitting the data via a linear regression analysis. Figure 3b shows the Nernst slope obtained at the three different concentrations examined. Error bars represent the standard deviation acquired from six electrodes made on different days. What can be seen is that for biofouled planar gold electrodes, the absolute value of the slope drops from −56 ± 4 mV to −45.4 ± 2 mV (N = 6) as the concentration of the redox molecules decreases from ∼0.2 mM to 0.075 mM. In contrast, at a clean planar gold electrode not exposed to fibrinogen, the slope is Nernstian. This result suggests that the potentiometric response is indeed affected by the presence of a layer of fibrinogen on the electrode surface. While the electrode still functions, there is ∼20% loss in its sensitivity. This result indicates that potentiometric measurements are perhaps much more sensitive to the effects of biofouling than what was first suggested.23 On NPG, however, the slope does not decrease and no loss in sensitivity was observed. The slope is in agreement with the theoretical value of −59.2 mV, regardless of the concentration of the redox molecules in solution.
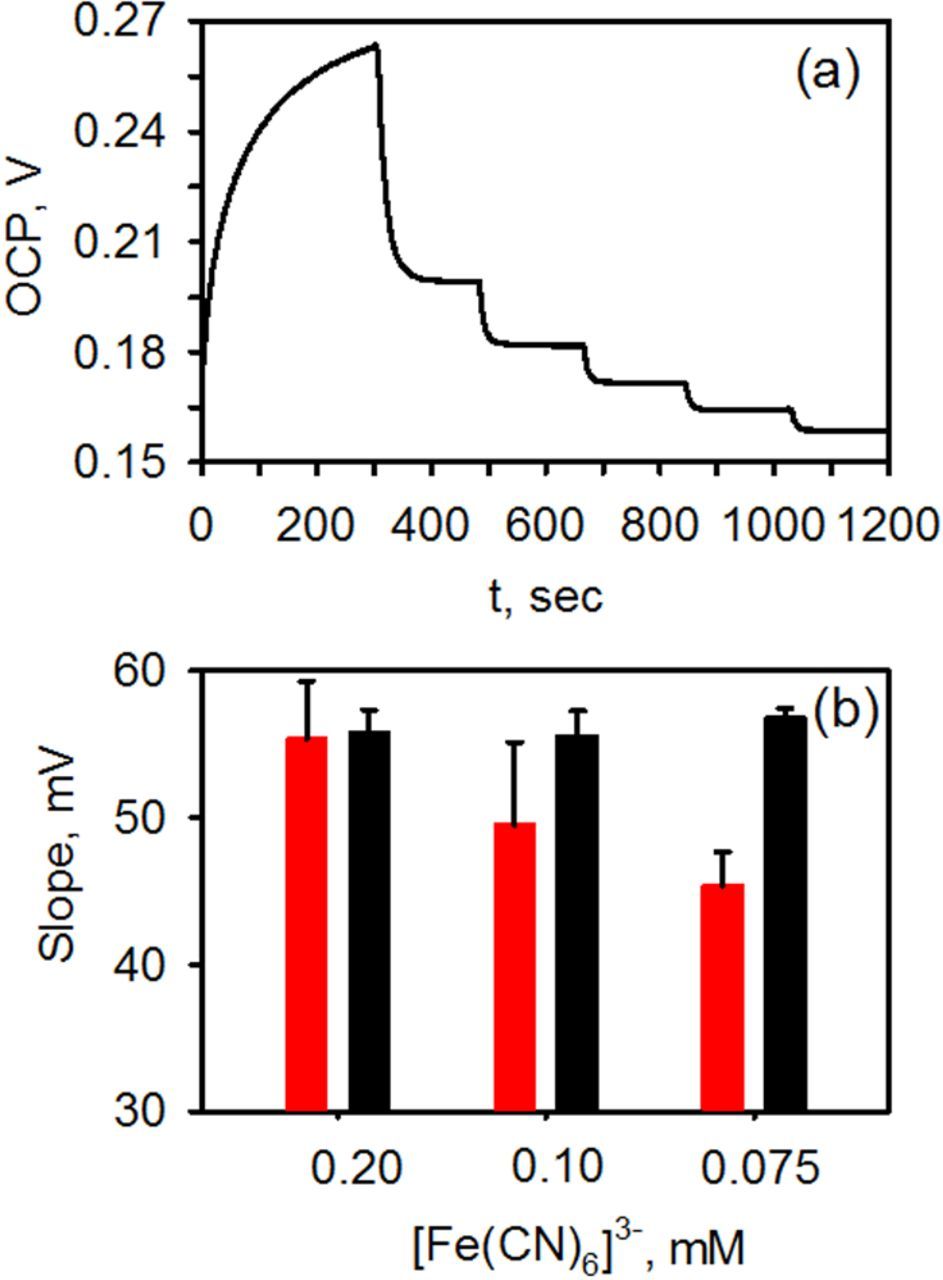
Figure 3. (a) OCP-time traces acquired at NPG after exposure to fibrinogen. The solution initially contained in 0.1 mM potassium ferricyanide in pH 7.4 phosphate buffer to which increments of potassium ferrocyanide were added. (b) Nernst slope (absolute value) obtained at biofouled planar gold (red) and nanoporous gold (black) electrodes at three different concentrations. Error bars represent the standard deviations from six electrodes made on different days.
Cyclic voltammograms collected at the end of the potentiometric experiments are shown in Figure 4. As expected, on NPG, the voltammetric response of potassium ferri/ferrocyanide is nearly ideal. Distinct faradaic peaks can be seen on top of a large capacitive current (because of the larger electrode area) with an observed peak splitting of ∼75 mV. On planar gold, however, no faradaic response was observed. These results indicate that nanoporous gold is a good electrode to use when making both potentiometric and cyclic voltammetric measurements, particularly in complex solutions containing relatively low concentrations of redox molecules where electrode fouling may take place.
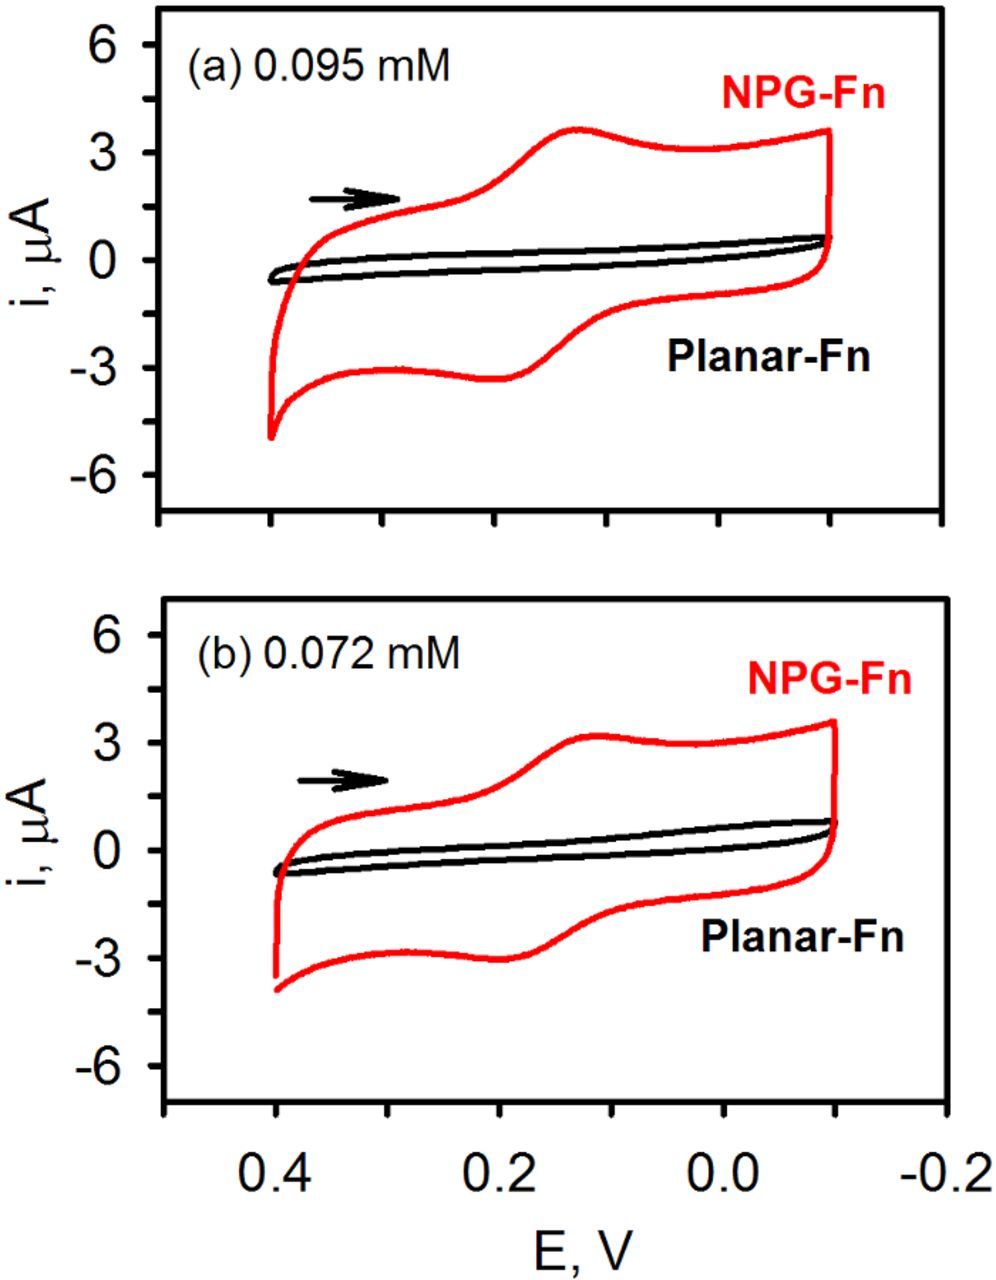
Figure 4. CVs acquired at the end of the potentiometric experiment, 50 mV/s, at nanoporous gold (NPG) and planar gold. The final concentrations of ferri/ferrocyanide were 0.095/0.095 (top) or 0.072/0.075 mM (bottom) in pH 7.4 phosphate buffer. The electrodes were soaked in 1 mg/mL fibrinogen for several hours prior to the potentiometric experiments.
Potentiometry of ascorbic acid: An unpoised system
We have also examined the potentiometric and cyclic voltammetric response of ascorbic acid, a biochemically important antioxidant, using biofouled NPG and planar gold electrodes. Comparisons were once again made to the pristine electrodes. Since only one form of the redox couple is present, this system is unpoised unlike that of ferri/ferrocyanide. In addition, the oxidation of ascorbic acid is also more complicated and involves 2e− and 2H+ and an electroinactive product.29 The results from the voltammetric and potentiometric experiments are shown in Figure 5. At clean planar and NPG electrode, the background subtracted CV of 0.27 mM ascorbic acid depicts a single faradaic peak at ∼0.2 V corresponding to the oxidation of ascorbic acid (Figure 5b). In contrast, when the electrodes were exposed to fibrinogen for two hours, the faradaic peak disappears at planar gold but remains on NPG (Figure 5c). These results are similar to that described for ferri/ferrocyanide where the voltammetry is very sensitive to the presence of surface contamination on planar gold while significantly less so on NPG.
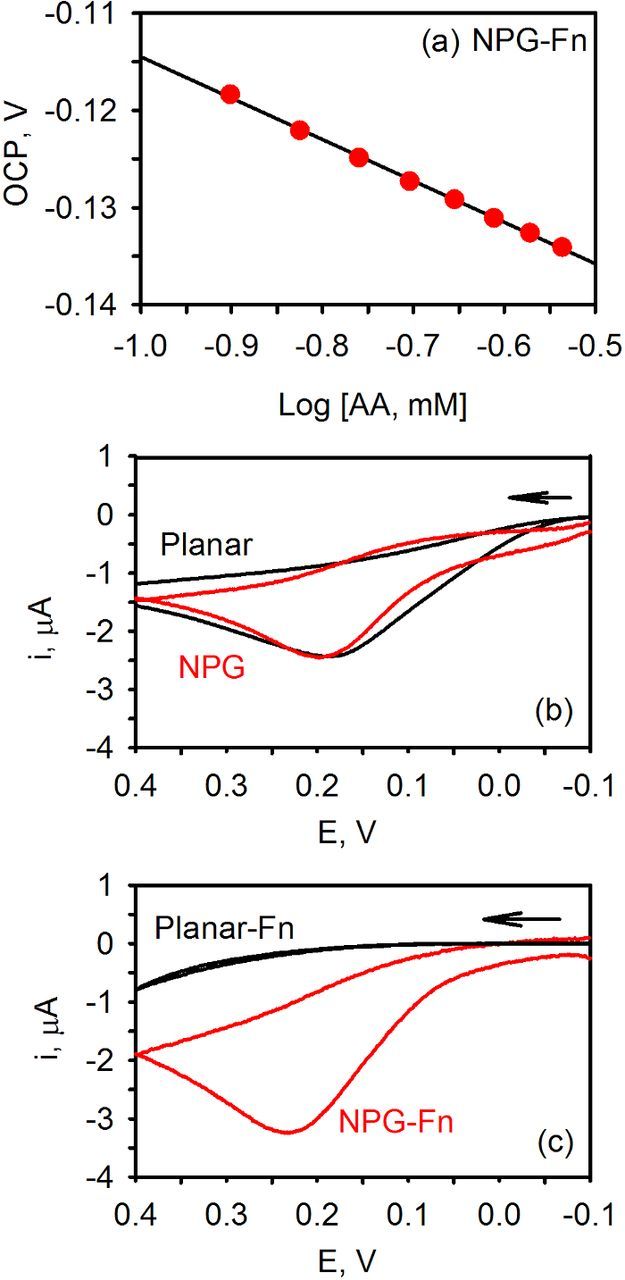
Figure 5. (a) Nernst plot for the addition of ascorbic acid to pH 7.4 phosphate buffer. The solid line is the linear regression fit to the data points: slope = −42.5 mV, R2 = 0.999. (b) Background subtracted CVs of 0.27 mM ascorbic acid in buffer at 50 mV/s at nanoporous gold (NPG) and planar gold electrodes. (c) Background subtracted CVs of ascorbic acid after modification of the electrodes with 1 mg/mL fibrinogen for several hours.
Nernst plots were obtained by measuring the OCP of the electrode immersed in phosphate buffer upon addition of successive aliquots of ascorbic acid while stirring. On unmodified NPG, a slope of −30.0 ± 2.1 mV (N = 4) was obtained consistent with a 2e− process. On planar gold, however, much more variability in the measured slope was observed: −32.2 ± 13.9 mV (N = 7). For several of the tested electrodes, the data was only linear at low concentrations, which suggests that the observed variability could be related to surface adsorption of ascorbic acid. After the electrodes were exposed to fibrinogen, Nernst plots were once again obtained, a representative example of which is shown in Figure 5a. A slope of −40.8 ± 5.3 mV (N = 8) for NPG was obtained, which is a slightly higher than the expected slope of −30 mV. In contrast, planar gold modified with fibrinogen (N = 6), were found to be insensitive to changes in the ascorbic acid concentration and no Nernst plots could be obtained. Collectively these results indicate that NPG electrodes are less sensitive to surface contamination than planar gold electrodes.
Blood redox potential
One example where potentiometric measurements of redox potential may be valuable is in blood and plasma as they contain low concentrations of redox molecules (ascorbic acid, ∼0.080 mM; uric acid, ∼0.2 mM) in a complex, biofouling matrix. Blood (or plasma) redox potential has been measured using commercial meters, typically with a planar platinum electrode. Investigations have evaluated changes in redox potential observed during exercise, in trauma patients, or in rabbits subjected to hemorrhagic shock.30–32 Potential variations were not large (10–20 mV). In one case, the biofouling issue was addressed by using an electrochemical pretreatment to desorb the adsorbed proteins just prior to measurement of OCP.33 Most other work does not address this problem and the impact it may have on the observed potentiometric response. Given the results described above, a better alternative may involve the use of NPG.
Figure 6 shows the continuous measurement of the redox potential of waste human plasma (heparinized) using unmodified NPG and planar gold for a time period of 10 min. As can be seen, the OCP reaches a near steady-state value quicker at NPG than at planar gold and the value of OCP recorded at 10 min is more positive at NPG vs. planar: −86 vs. −119 mV for this particular data set. The CVs acquired at 50 mV/s after the OCP measurements are shown in Figure 6b. A small faradaic response is observed at ∼0.35 V on NPG and ∼0.5 V on planar gold. This peak results from the oxidation of uric acid, ascorbic acid and quite possibly other antioxidants found in blood.34,35 Additional experimentation is necessary to understand what gives rise to the voltammetric peak and then to explain the origin of the peak shift observed on NPG vs. planar gold.
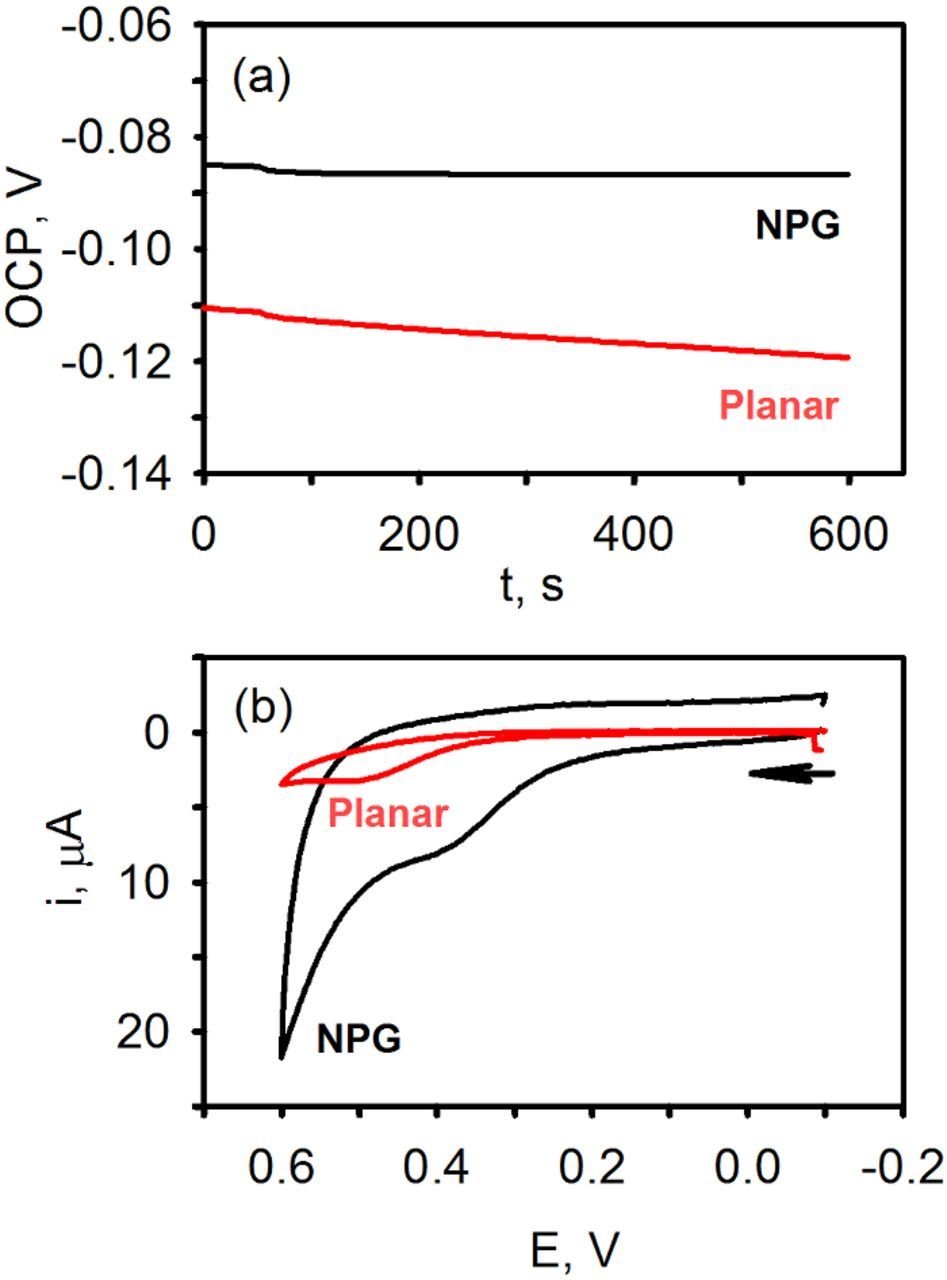
Figure 6. (a) Continuous OCP-time traces acquired at unmodified nanoporous gold (NPG) and planar gold in heparinized human plasma (b) CVs acquired at the end of the potentiometric experiments, 50 mV/s.
As can be noted, there are significant differences in the value of OCP of human plasma obtained at NPG and planar gold. We also noted such differences in waste heparinized animal blood as well. For example, pig blood OCP measurements at NPG and planar gold electrodes yielded values of −108 ± 7 vs. −151 ± 2 mV (N = 3), respectively. In rabbit blood, OCP using NPG and planar gold were −119 ± 4 vs. −155 ± 4 mV (N = 3), respectively.36 These differences likely reflect differences in the interfacial interactions between the different surfaces and redox molecules in blood. Planar gold will have a layer of adsorbed, likely denatured proteins on its surface, which will impede electron exchange, decrease the response rate, and reduce its sensitivity toward the OCP measurements. This undesired chemical modification of the electrode surface could also bias the value measured. On the other hand, NPG contains a trace amount of silver, has a much higher surface area, and a very different microscopic structure than planar gold. The presence of appropriately sized nanopores and nanopore architecture also ensures that there are plenty of places for electron exchange to take place with multiple redox species present in blood, even those that traditionally have slow rates of electron exchange.15,21 Additional work is needed to tease out these differences and the effect they have on blood redox potential measurements.
Conclusions
Both potentiometric and voltammetric measurements can be used to obtain valuable information about the redox chemistry taking place in solutions of varying complexity, particularly when careful attention is given to proper electrode design. When the concentrations are low and the matrix complex, nanoporous gold electrodes formed by dealloying gold leaf outperform planar gold electrodes. Faradaic peaks for the reduction/oxidation of potassium ferri/ferrocyanide via cyclic voltammetry are unperturbed on nanoporous gold exposed to fibrinogen while they are non-existent on planar gold also exposed to fibrinogen. Similar results were observed for ascorbic acid. In the potentiometric experiments, such biofouling effects are most prominent at low concentrations (e.g., 0.1 mM for potassium ferri/ferrocyanide) on planar gold whereas no biofouling effects and Nernstian responses were found using nanoporous gold. In plasma and blood, differences were also noted in both the potentiometric and cyclic voltammetric experiments undertaken at planar and nanoporous gold electrodes. In future work, we plan to further study and understand these differences with the goal of improving and expanding our ability to make electrochemical measurements in chemically complex biological solutions.
Acknowledgments
M.L. gratefully acknowledges support from the VCU Honor's summer undergraduate research program. Matt Ellenberg is thanked for his help with the acquisition of blood plasma.