
Abstract
The electrochemical splitting of water requires highly active, robust, and economical electrocatalysts. Titanium dioxide, a semiconductor, is an inactive oxygen evolution electrocatalyst because of its low conductivity and poor reactivity. Here, thin film of a low-symmetry (short-range order) mesoporous titanium dioxide (lsm-TiO2) electrocatalysts having about 200 m2 g−1 surface area and semi-crystalline anatase wall were prepared by evaporation-induced self-assembly (EISA) approach, followed by a two-step calcination process. The porosity, order, surface area, crystallinity and activity of lsm-TiO2 are controlled by tuning the titanium precursor/surfactant ratio. The lsm-TiO2 catalyst with a precursor/surfactant ratio of 1.5 wt% showed unprecedented electrocatalytic activity and substantial shift in the oxygen evolution onset potential to 1.55 V vs. RHE (overpotential ca. 320 mV), small Tafel slope (51 mv dec−1) and charge transfer resistance, and current density of 11 mA cm−2 was obtained at 1.65 V vs. RHE, significantly more efficient than highly ordered hexagonal mesoporous TiO2 counterpart and comparable to state-of-the-art transition metal oxide electrocatalysts. Furthermore, the lsm-TiO2 electrode has excellent durability and is activated during electrolysis with no visible current decays or potential drifting is observed after 12.0 h of electrolysis, demonstrating the promise of this low-symmetry mesoporous TiO2 as an electrocatalyst for energy conversion technologies.
Export citation and abstract BibTeX RIS
Over the past decades, increasing energy demand and concern over the environmental impact of fossil fuels have led to considerable efforts focused on the development of CO2-free and sustainable energy sources. Hydrogen is regarded as an ideal clean energy carrier due to its abundance and high energy density. In addition, hydrogen can be obtained from both renewable and nuclear energy. In this respect, electrochemical and photo-electrocatalytic water splitting using electrical or sunlight energy to generate hydrogen and oxygen as fuels is very attractive.1–3 However, finding an efficient, cost-effective, and long-lasting catalyst for renewable fuel generation through water splitting is challenging.4,5 The electrochemical oxygen evolution reaction (OER) is the key water splitting reaction in alkaline media, however a substantial overpotential is required to achieve the current densities, ≥10 mA cm−2 using precious-metal electrocatalysts.5,6 In addition, the oxygen evolution reaction (4OH− → 2H2O + 4e− + O2 in alkaline media) occurs through multistep proton-coupled electron transfers and is kinetically slow.7,8 During the last three decades, significant investigations have been carried out to develop suitable water splitting electocatalysts that have a small Tafel slope, the lowest possible overpotential, long lasting durability, and low cost.9–12 The most commonly used electrochemical OER catalysts to date are (RuO2) and (IrO2). However, these oxides are expensive and the metals are scarce; furthermore, they have poor chemical stability in alkaline media, making them inappropriate for large-scale commercial use.13–16 Because of their structural and chemical stability and their excellent catalytic activities, much effort has been made toward the development of inexpensive transition metal of cobalt, nickel and iron based electrocatalysts of oxides, hydroxide, oxy-hydroxides,17–20 perovskites21 phosphates22 vanadates12 borate composites23 and molecular complexes.24–26 Many nanostructured and mesoporous materials with various compositions such as NiFeOx nanoparticles,27 layered double hydroxides,28 binary Ni-Co hydroxide nanotubes,29 NiFe hydroxide nanoparticles confined by grapheme30 and mesoporous cobalt hydroxides have also been developed, and these have been shown to be excellent oxygen evolution catalyst.31 The improved catalytic performance of nanostructured and mesoporous materials is attributed to the presence of highly ordered three-dimensional (3D) interconnected porous networks that have a high ratio of surface atoms and highly efficient active sites. These factors result in the favorable diffusion of reactants and products, short ion and electron diffusion pathways, and large solid-electrolyte interfaces.32,33
A range of templating approaches with various surfactants and precursors have been adapted for the synthesis of mesostructured materials with different architectures and morphologies.34,35 The evaporation-induced self-assembly (EISA) method has been shown to be the most efficient approach for the synthesis of mesoporous materials with a controlled meso-architectures36–38 and composition39 allowing the preparation of macroscopic powders, thin films, and membranes.40 In this EISA process, a mixture of volatile solvent (commonly ethanol), surfactants or amphiphilic block copolymers, and inorganic precursors is subjected to controlled evaporation which driving the co-assembly of surfactant molecules and inorganic precursors. Subsequently, chemical or heat-treatment results in the formation of ordered inorganic mesostructures.41,42 However, the mesostructures can collapse during the removal of the surfactant by calcination due to the crystallization of the inorganic framework; thus, careful annealing condition under an inert atmosphere are required to obtain a highly ordered inorganic mesostructures.43
Titanium dioxide (TiO2) is an n-type semiconductor with very poor activity for the electrochemical OER in water electrolysis because of its high electrical resistivity (105 to 102 Ω.cm).44 Despite this, because of its chemical stability, optical and electrical properties, TiO2-based photocatalysts with various nanostructures, such as nanotube arrays45,46 nanorods47 nanowires48 TiO2 nanocrystals49 and hierarchically mesoporous TiO2 materials50–52 have been extensively studied and been shown to catalytically photogenerate H2 and O2 by water splitting under both photochemical and photoelectrochemical conditions. However, the low-symmetry TiO2 mesostructures (lsm-TiO2), such as worm-like mesopores, are not often reported and have been disregarded because of the short-range order of the pores; however, these materials exhibit very large surface areas compared to those of highly ordered hexagonal and cubic mesostructures and their catalytic properties never been explored.38,53,54
This work reveals the unique and unprecedentedly the electrocatalytic activity of low-symmetry mesoporous TiO2 as an electrocatalyst for OER in alkaline water. A set of low-symmetry mesoporous TiO2 structures (lsm-TiO2) with worm-like mesopores, semi-crystalline anatase walls, and large surface areas were prepared through evaporation self-assembly using Pluronic P123 surfactant and titanium n-butoxide (TBO) precursor, followed by two-step annealing in nitrogen followed by air atmosphere. The short-range porosity, surface area, and low crystallinity of lsm-TiO2 were achieved by controlling the TBO/P123 ratio (surfactant concentration kept at < 0.1 mmol) and the annealing conditions. The electrocatalytic activity of the prepared lsm-TiO2 electrodes was investigated for the OER in alkaline water electrolysis. The results show that the TBO/P123 ratio and post-annealing in nitrogen atmosphere have a crucial effect on the porosity order, surface area, and OER electrocatalytic activity during alkaline water electrolysis. The OER activity of the obtained lsm-TiO2 electrodes was validated by comparing the results with those of highly ordered hexagonal mesoporous TiO2 (hm-TiO2) counterpart and data documented in the literature for the state-of-the-art transition metal oxide OER electrocatalysts.
Experimental
Materials and synthesis
Non-ionic surfactant (Pluronic P123, (Mw = 5800, EO20PO70EO20, Sigma Aldrich) was used to form the mixed solution (gel) and Titanium n-butoxide (TBO, Ti(OBu)4, 97%, Aldrich) was used as Ti precursor. Hydrochloric acid HCl (37 wt%, AnalaR) and absolute ethanol (C2H6O), AnalaR) were all supplied by Shanghai Chemical Corp. Sodium hydroxide pellets, was purchased from Sigma-Aldrich and all chemicals were used as received without further purification. All the solutions were prepared using distilled water (Milli-Q, Millipore, Inc.) with a resistivity of 18.2 MΩ cm.
The low-symmetry mesoporous titanium dioxide (lsm-TiO2) catalysts were synthesized by using the ligand-assisted evaporation-induced self-assembly (EISA) method using different wt% ratios of Titanium n-butoxide (Ti(OBu)4) as Ti precursor and Pluronic P123 surfactant and in presence of acetyl acetone (AcAc) as a coordination agent in an ethanolic solution and followed by two-step calcination processes. For a typical synthesis procedure, the P123 surfactant (0.50 g, 0.0862 mmol) was completely dissolved in 10.0 g (217 mmol) of absolute ethanol, followed by adding different amount 1.0, 1.5 and 2.0 g of TBO dissolved in AcAc solution with TBO:AcAc ratio equals 2:3 wt% and mixed with stirring for 30 min at room temperature and sequentially, 1.5 g of concentrated HCl (36 wt%) was added drop wise under vigorous stirring, followed by further stirring for 1.0 h. The obtained yellow-color homogeneous solution was decanted into Petri dishes to evaporate the solvents at room temperature for 10 min and then followed by heating at 40°C for 48 h. The light-yellow transparent membrane was scraped from the petri dish and exposed to pyrolysis in a tubular furnace at 350°C for 3.0 h under N2 with a heating rate of 1.0 C min−1. After pyrolysis process was completed, the color of the composite was turned to gray due the incorporated carbon left after burning the surfactant. Finally, white mesoporous TiO2 products were obtained by further calcination of the gray powder in an open air at 400°C for 4.0 h. The obtained mesoporous TiO2 were labelled as, lsm-TiO2@1.0, lsm-TiO2@1.5, and lsm-TiO2@2.0 which correspond to the Ti(OBu)4 precursor weight of 1.0, 1.5 and 2.0 g respectively added during the synthesis process. The hexagonal mesoporous TiO2 (hm-TiO2) catalyst was prepared by the same procedure of self-assembly and heat-treatment using 2.0 g of Pluronic P123 (0.344 mmol) surfactant with added 2.4 g of concentrated HCl (36%). For non-porous TiO2 catalyst (bare-TiO2) was synthesized through a similar route using 1.0 g of TBO but in the absence of the triblock copolymer surfactant and used as a control catalyst.
Characterization methods
Characterization of high-resolution scanning electron microscope (HRSEM) images were obtained on a Hitachi S4800 (Japan) operated at 1.0 kV and 10 mA and transmission electron microscopy (HRTEM) measurements were conducted on a JEOL 2100F microscope (Japan) at 200 kV, equipped with an energy dispersive X-ray (EDX) detector. The samples for TEM measurements were dispersed in ethanol solution and supported onto carbon film on a Cu grid. Small-angle X-ray (SAXS) measurements were recorded on a Nanostar U small-angle scattering system (Bruker, Germany) using Cu Kα radiation (40 kV, 35 mA) and XRD patterns were recorded using a Rigaku Mini Flex 600 using Cu Kα irradiation at voltage of 40 KV and 15 mA current. The XPS analysis of the produced mesoporous TiO2 catalyst was investigated by X-ray photoelectron spectroscopy (Escalab 250 spectrometer, Thermo Fisher Scientific) with a monochromated MgKα X-ray source. Nitrogen adsorption isotherms were measured at 77°K using NOVA 2200e surface area analyzer. Before the measurement was taken, the samples were degassed in a vacuum at 180°C for at least 6 h. The specific surface area was calculated by Brunauer–Emmett–Teller (BET) method using the adsorption data at P/P0 = 0.05–0.25 and the pore size distribution and the pore volume were derived from the adsorption branch by using the Barrett–Joyner–Halenda (BJH) model. The total pore volume (Vtotal) was estimated from the adsorbed amount at a relative pressure P/P0 of 0.992.
Electrochemical measurements were executed using a potentiostat (BioLogic SAS, model) in a three-electrode system, using the TiO2 mesoporous deposited on FTO substrate as a working electrode, a coiled Pt wire and saturated calomel electrode as a counter and reference electrode respectively. The electrolyte was an aqueous solution of 1.0 M KOH with a measured pH of 14.4 and the potential scale was calibrated to the reference hydrogen electrode (RHE) using the equation, ERHE = ESCE + 0.244 V + 0.059 pH at 25°C. The current was uncorrected and thus include the effects of resistance drop within the electrolyte. For the preparation of working electrodes, the mesoporous TiO2 was deposited onto FTO substrate using electrophoretic deposition method. In a typical procedure, 15 mg of mesoporous TiO2 was dispersed in 1.0 ml solution of 40 mg iodine (Alfa-Aesar) dissolved in 15 ml acetone mixture by the ultrasonic probe for 10 min to get a uniform dispersion of the catalyst. The electrocatalyst particles were coated on the negative electrode by immersing FTO substrate (1.0 × 0.5 cm2) in parallel with the FTO anode, in the deposition solution with ca. 1.0 cm of distance, and then +10 V of bias was applied between them for 6 min using a potentiostat (BioLogic SAS, model). After this process, the electrodes were then rinsed with deionized water, dried in air and then calcined at 350°C K for 30 min under a flow of N2 gas to improve the conductivity of the electrodes. The average weight of the lsm-TiO2 catalyst deposited on FTO was about 0.7 mg and an average thickness was 3.5 μm as measured by Profilo-meter and shown in Figure S3c (SI).
The electrochemical impedance spectroscopy (EIS) was performed in the frequency range of 10−2 to 200 kHz with AC voltage amplitude of 20 mV at a dc bias of 0.5 V vs. the saturated calomel electrode (SCE) in a 1.0 M KOH electrolyte.
Oxygen concentration measurement was carried out using H-shape two-compartment cell fitted with oxydot sensor placed on the anode side and during the water electrolysis process; the apparent oxygen evolution concentration was monitored using the Oxysense system (Oxysense, USA 300/5000 series). The cell was sealed using a rubber cork and argon was purged for 1.0 h through the electrolyte (0.1 M KOH, pH = 12.4) prior to measurement. Before electrolysis initiating, the setup was left for 45 min with argon atmosphere above electrolyte to ensure that equilibrium was reached and that no oxygen was leaking from outside atmosphere.
Results and Discussion
Characterizations of the low-symmetry mesoporous titanium dioxide catalysts
The lsm-TiO2 structures were investigated by X-ray diffraction (XRD), and Figure 1a illustrates the low-angle X-ray signals for the as-made and the annealed lsm-TiO2 catalysts. The low-angle X-ray patterns (Figure 1a) for the as-made lsm-TiO2 contain a well-resolved peak with a q value of 0.44 nm−1 in addition of a small and broad peak at 0.8 nm−1, which suggest the formation of a mesoporous structure. After calcination in N2 at 350°C and followed by air at 400°C, the first diffraction peak shifts from 0.44 nm−1 to 0.64, 0.67, and 0.70 nm−1 for lsm-TiO2@1, lsm-TiO2@1.5, and lsm-TiO2@2, respectively. This presumably because the shrinkage of the TiO2 framework and its crystallization during the removal of the template. For hm-TiO2, after annealing, the diffraction pattern contains a main peak at q = 0.66 nm−1 and second diffraction shoulder around q = 1.2 nm−1, presumably arising from the order improvement of the mesoporous structure compared to the lsm-TiO2 counterparts.
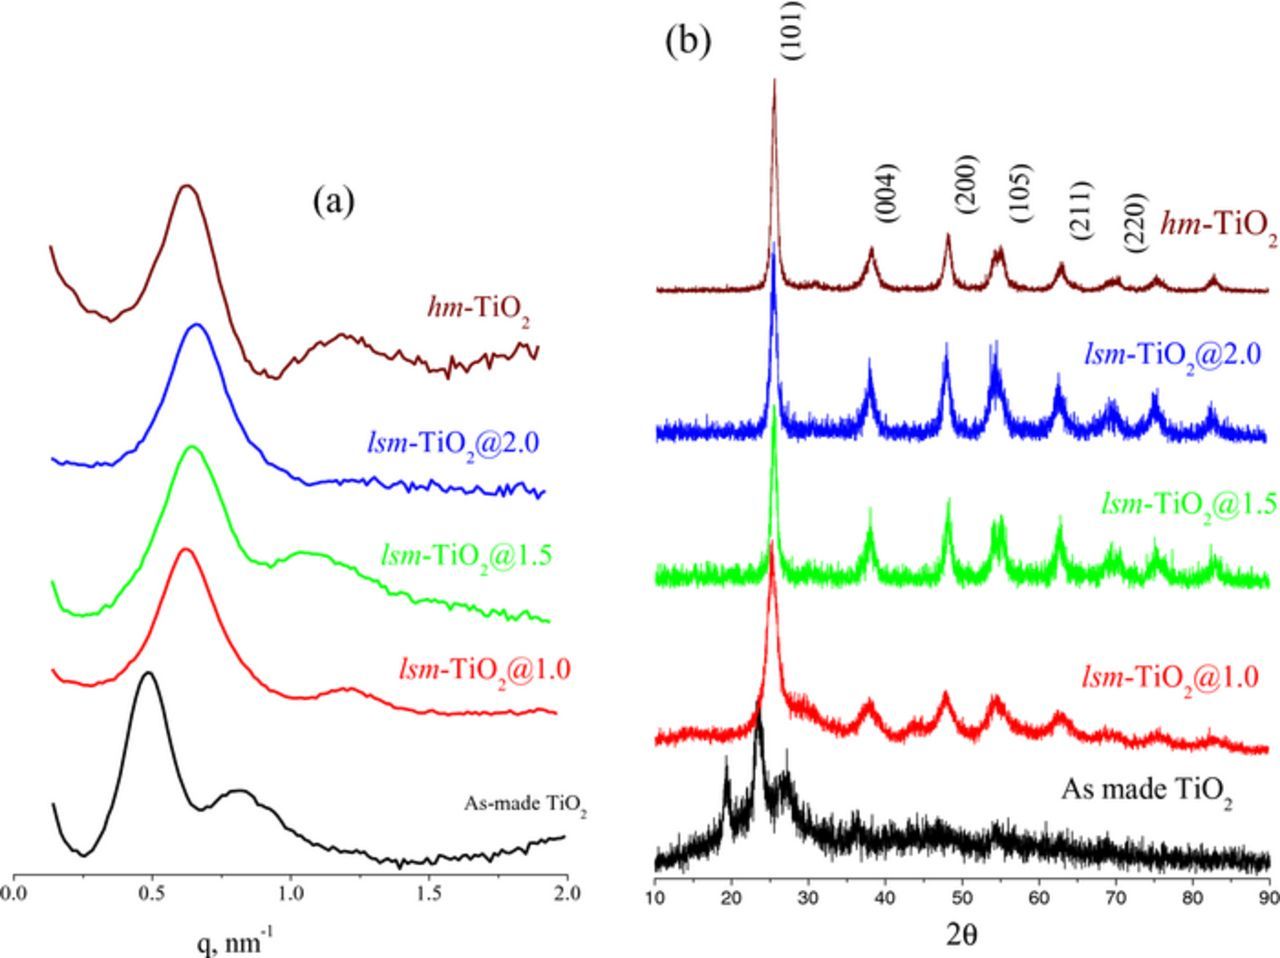
Figure 1. (a) Small angle (b) wide angle X-ray diffraction patterns of as-made, low-symmetry and hexagonal mesoporousTiO2 materials; mesoporousTiO2 materials were synthesized with various TBO/P123 wt% ratios and after two steps calcination at 350°C for 3.0 h in N2 then 400 for 4.0 h in air.
For the wide angle X-ray characterization (Figure 1b), including those of the as-made TiO2 deposit (before annealing), there are very weak and broad diffraction peaks, which are due to the highly amorphous nature of the mesoporous TiO2 deposit. On the other hand, after annealing, the materials a distinctive diffraction signals corresponding to the anatase phase of TiO2 (JCPDS, 21–1272) at 2θ of 25.5, 37.8, 48.2, 54.2, 55.24, 62.9, 69.4, 70.6, 75.2 and 82.7, which can be assigned to the (101), (004), (200), (105), (211), (204), (116), (220), (211) and (224) diffraction planes respectively.
Figure 1a Small angle 1b wide angle X-ray diffraction patterns of as-made, low-symmetry and hexagonal mesoporousTiO2 materials; mesoporousTiO2 materials were synthesized with various TBO/P123 wt% ratios and after two steps calcination at 350°C for 3.0 h in N2 then 400 for 4.0 h in air.
Clearly, only the TiO2 characteristic peaks were observed and no interference from other crystalline impurities are detected in the XRD patterns, suggesting pure crystalline anatase TiO2. However, the diffraction peaks are broad because of the amorphous nature of the TiO2 wall and the random arrangement of the crystallites. The crystallite size of the TiO2 catalysts calculated by Scherrer's equation is reported in Table I and it is gradually increase as 9.45, 14.18 and 17.02 nm for lsm-TiO2@1.0, lsm-TiO2@1.5 and lsm-TiO2@2, respectively, indicating that more crystalline TiO2 walls are formed as the TBO/P123 ratio increases.
Table I. Crystallite size of the mesoporous TiO2 samples calculated using Scherrer's equation and textural properties of specific surface area, total pore volume, and the pore size of the mesoporous TiO2 catalysts derived from nitrogen adsorption and desorption data.
| Catalyst | d-spacing, nm | Crystal size (nm) | BET surface area (m2 g−1)a | Pore size (nm)b | Pore volume (cm3 g−1)c |
|---|---|---|---|---|---|
| lsm-TiO2@1.0 | 9.8 | 9.45 | 152 | 2.68 | 0.255 |
| lsm-TiO2@1.5 | 9.3 | 14.18 | 200 | 2.7 | 0.290 |
| lsm-TiO2@2.0 | 8.95 | 17.02 | 141 | 2.67 | 0.185 |
| hm-TiO2 | 9.5 | 12.15 | 218 | 2.65 | 0.33 |
aSBET is calculated by the BET equation; bpore size (P) is calculated by BJH method; cpore volume is calculated at p/p0 = 0.950–0.995.
The composition and purity of the low symmetry mesoporous TiO2 catalysts were confirmed by X-ray photoelectron spectroscopy (XPS). The XPS survey spectra and the narrow scans of Ti 2p and O1s of lsm-TiO2@1.5 catalyst are shown are presented in Figure 2. The wide XPS survey in Figure 2a shows only the characteristic peaks of TiO2 in addition of carbon that presumably is impurity originated from some residual after burning the surfactant or background contamination. Table S1 reports the carbon content of the studied catalysts which slightly changes from one catalyst to other and no trend can be drawn. The narrow-scan in Figure 2b shows the Ti 2p3/2 and 2p1/2 photoelectron peaks of mesoporous TiO2 are symmetric in nature and their binding energy (BE) positions are at 459.55 and 465.29 eV respectively, implying the Ti4+ state.55 The value of spin-orbit splitting energy of those two peaks is 5.74 eV which is consistent with the literature value.56
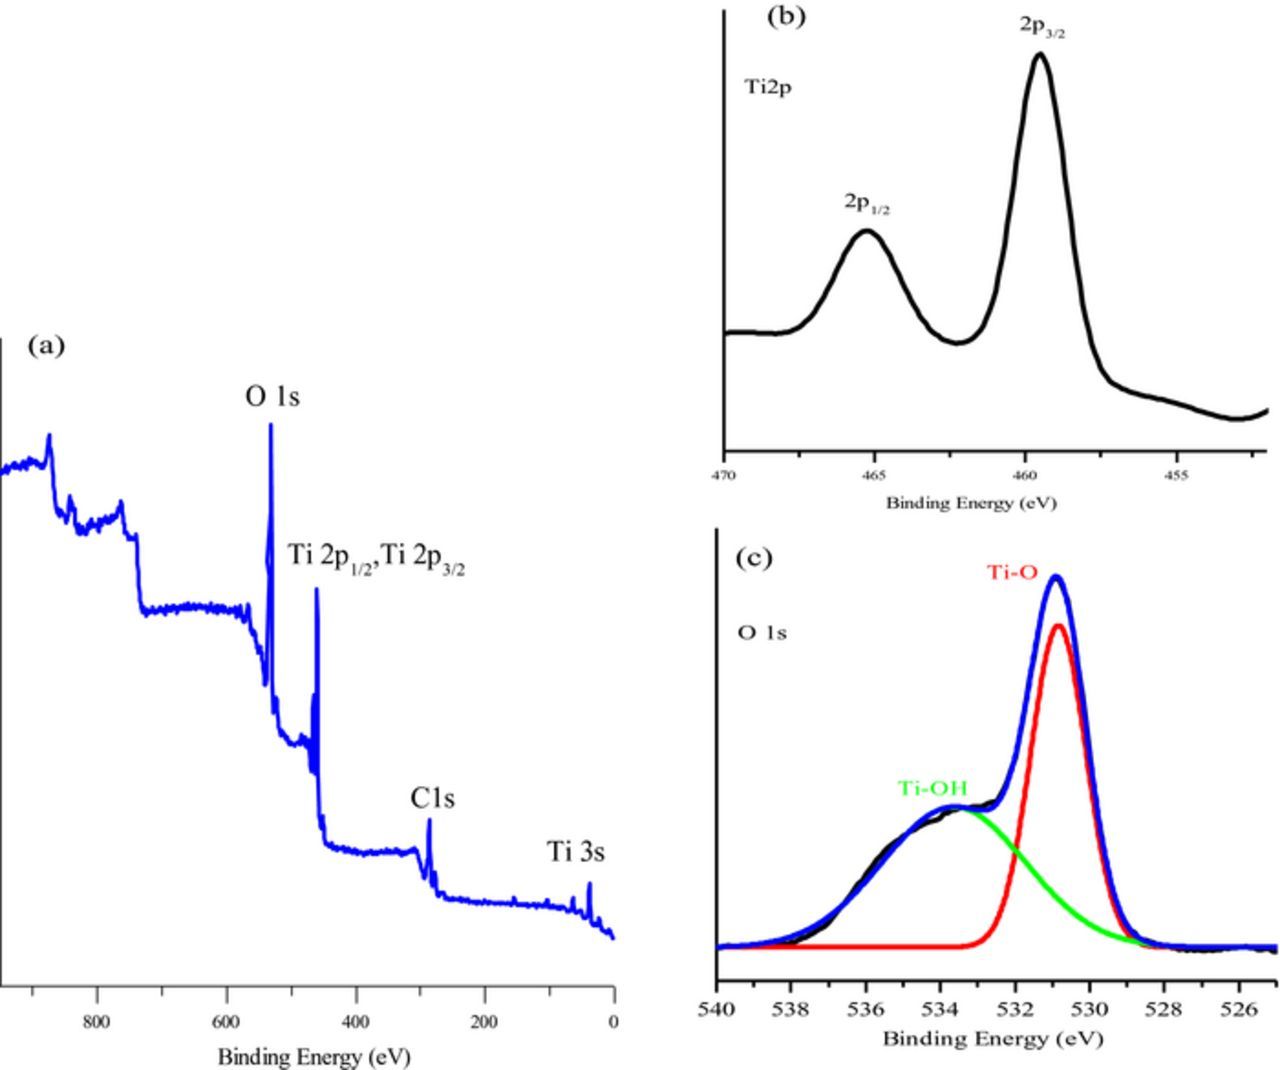
Figure 2. The XPS spectra of lsm-TiO2@1.5 catalyst (a) wide survey scan; (b) Ti 2p, and (c) O 1s narrow scans.
Figure 2c displays the high-resolution XPS spectra of O 1s region of mesoporous TiO2 catalyst with Gaussians peak fitting which demonstrates the presence of two different forms of oxygen. The first peak centered at the lower binding energy of 530.7 eV, is assigned to lattice oxygen of the TiO2 while the second peak located at 532.30 eV, is related to the oxygen of OH group that adsorbed at the surface of the mesoporous TiO2. This confirms the low symmetry mesoporous TiO2 catalyst is highly pure and apart from carbon there are no contaminations.
The mesoporosity of the obtained lsm-TiO2 materials was determined through N2-physisorption measurements. Figure 3a shows the N2 adsorption-desorption isotherms and the corresponding pore size distributions of the lsm-TiO2 samples (Figure 3b) after calcination in N2 at 350°C and in air at 400°C.
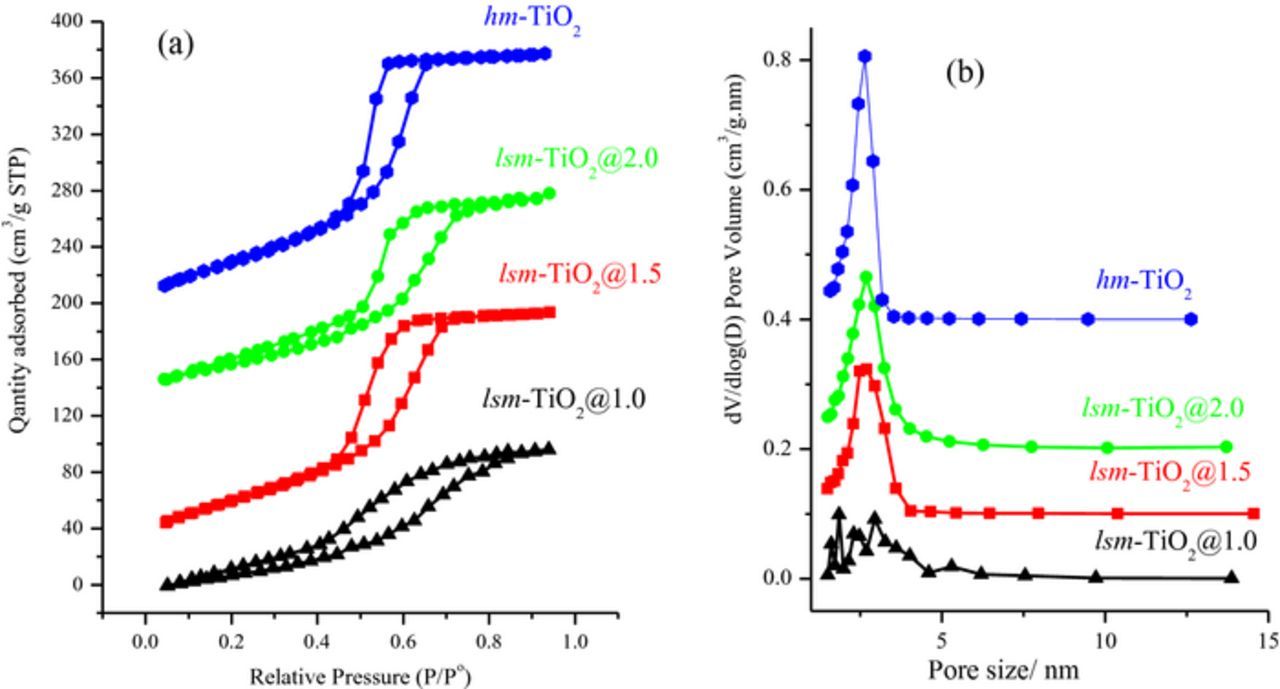
Figure 3. (a) Nitrogen-sorption isotherms (b) Pore size distribution calculated by the BJH using the BET N2 adsorption branch for mesoporousTiO2 materials prepared with various Plournic TBO/P123 wt% ratios and after two steps calcination at 350°C for 3.0 h in N2 then 400°C for 4.0 h in air.
All adsorption and desorption isotherms showed typical IV isotherm with H1-type hysteresis loops, which are representative of mesoporous materials according to the IUPAC classification.57,58
In addition, the lsm-TiO2@1.5, lsm-TiO2@2.0, and hm-TiO2 samples exhibit more-defined H1 hysteresis loops and a distinct capillary condensation step at a relative pressure P/Po of 0.4–0.7, which indicates the existence of a uniform and a narrow mesopore size distribution. The corresponding pore size distribution curves were calculated using the Barrett–Joyner–Halenda (BJH) method using the adsorption branch and the results are shown in Figure 3b, revealing the narrow pore size distribution around 3.0 nm, which is consistent with the reported literature for this type of Pluronic surfactant52 and the scanning electron microscopy characterization discussed below.
The textural properties, such as the specific surface area, total pore volume, and the pore size, are listed in Table I. The lms-TiO2@1.5 catalyst has a large surface area and pore volume, which declined with increasing TBO/P123 ratio in the case of the lsm-TiO2@2.0 catalyst; this is probably due to the amorphous walls and smaller grain sizes in the case of lsm-TiO2@1.0. The specific surface area of lsm-TiO2@1.5 is as high as 200 m2 g−1, and this is comparable to the surface area of hm-TiO2 (218 m2 g−1), which is associated with ultrathin amorphous walls, extended mesostructure, and rough surfaces.
Figure 4 shows the high resolution SEM images of the lsm-TiO2 and hm-TiO2 catalysts after the two calcination steps. Clearly, the surface morphology of the mesopores strongly depends on the TBO content. For lsm-TiO2@1.0 (Figure 4a), the mesopores are spherical and are distributed over a very large domain; however, the pores are randomly distributed and are not well packed. On increasing the TBO content in the lsm-TiO2@1.5 catalyst, and as shown in SEM image in Figure 4b, the pores became well packed at short range and have a higher pore density than in the case of lsm-TiO2@1.0. The image also shows the presence of pores with a cylindrical (worm-like) 2D channels. Further increase in the TBO concentration, in the case of lsm-TiO2@2.0 (Figure 4c), produced highly elongated 2D channel (worm-like) pores with a short-range order and an inhomogeneous, granular (bulk) texture with a nanometer scale (shown by red circles).
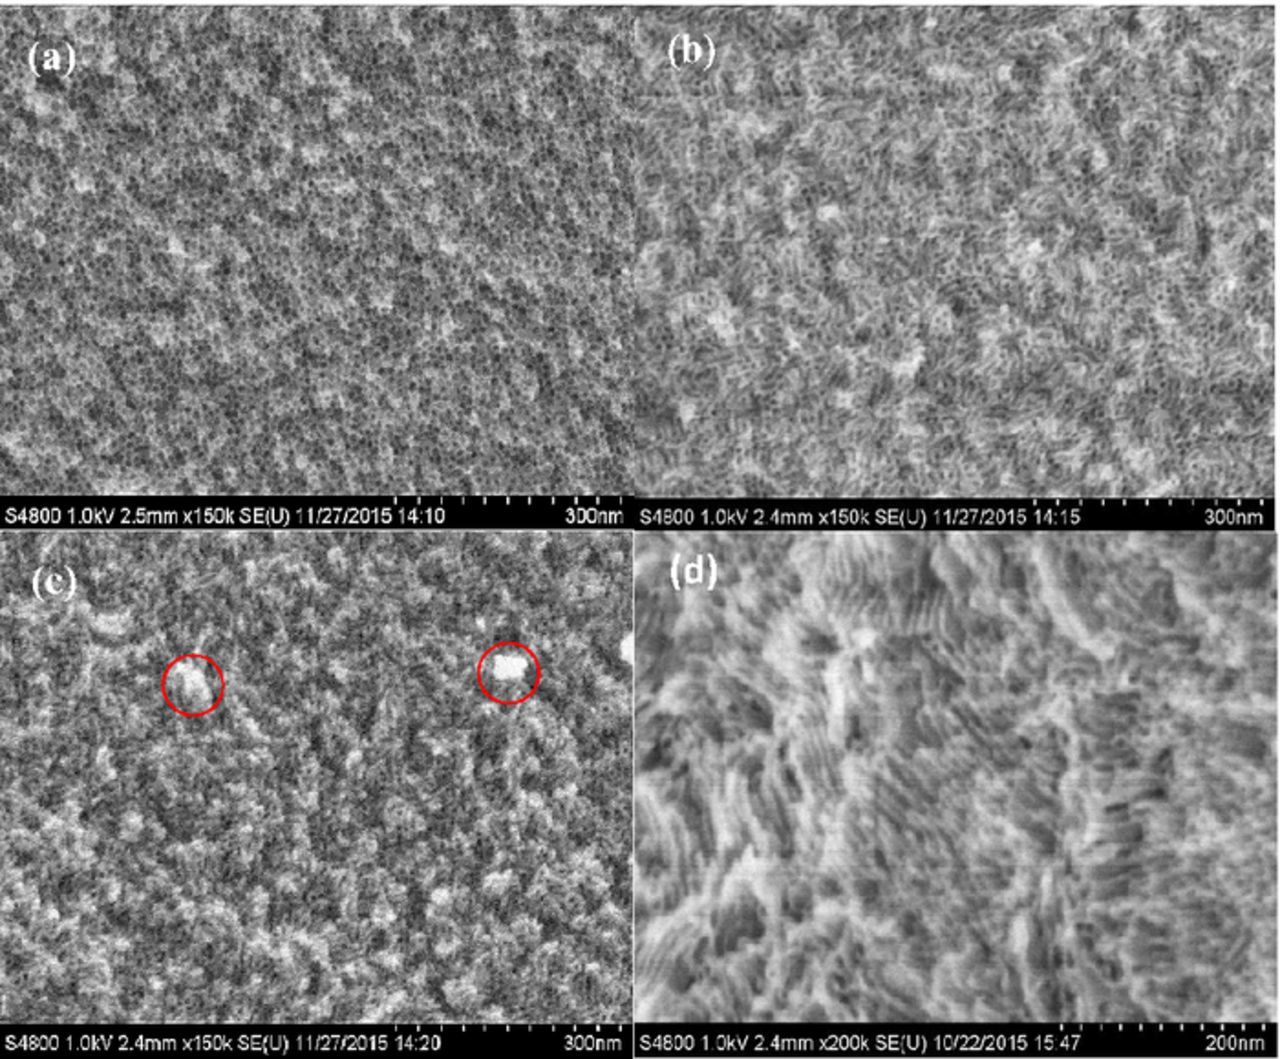
Figure 4. Top-view high resolution SEM images of lsm-TiO2 samples synthesized with various TBO/P123 mass ratios and after two steps calcination at 350°C for 3.0 h in N2 then 400°C for 4.0 h in air. (a) lsm-TiO2@1.0 (b) lsm-TiO2@1.5 (c) lsm-TiO2@2.0 and (d) hm-TiO2 catalysts.
This can attributed to an increase in TBO content leads to the formation of a more crystalline framework, which is consistent with the results of the wide-angle XRD data (Figure 1b and Table I). The hm-TiO2 as shown in Figure 4d exhibits the typical morphology of highly ordered 2D hexagonal channels of mesoporous TiO2. The low-symmetry mesoporous structures are less ordered than the hexagonal and cubic morphologies but exhibit interconnected pores, and these are always formed when there is a high concentration of inorganic precursor and low copolymer content (P123 < 0.1 mmol).59 It can be conclude that, as the TBO concentration increases, the pore morphology changes from spherical to worm-like and the TiO2 framework becomes more crystalline because of the preferential evaporation of ethanol, which drives the self-assembly of TBO/P123 into different morphologies, including micelles and transverse cylindrical micelle liquid-crystalline mesophases, which leads to hierarchically bimodal mesoporous TiO2 after heat-treatment.38,60 The two-step calcination in N2 and in air atmosphere shows the benefit of maintaining the porous structure, as shown in Figure S1 (SI). The direct annealing in air produces narrow pores with thick TiO2 walls and a low surface area structure arising from the crystallization and expansion of the TiO2 walls, as shown in Figure S1a. On the other hand, calcination in N2 atmosphere results in the retention of the carbon inside the pores, which sustains the pores by preventing the wall expansion. The second step of annealing in air removes the residual carbon and reduces the wall expansion; consequently, a very porous structure with a higher surface area is formed, as shown in Figure S1b.
The transmission electron microscopy (TEM) images of the lsm-TiO2 and hm-TiO2 catalysts are presented in Figure 5. The low-symmetry mesoporous structures of the catalysts can be clearly seen in the TEM images because the pores show the worm-like morphology and extended over micrometers length (Figure S2a, SI).
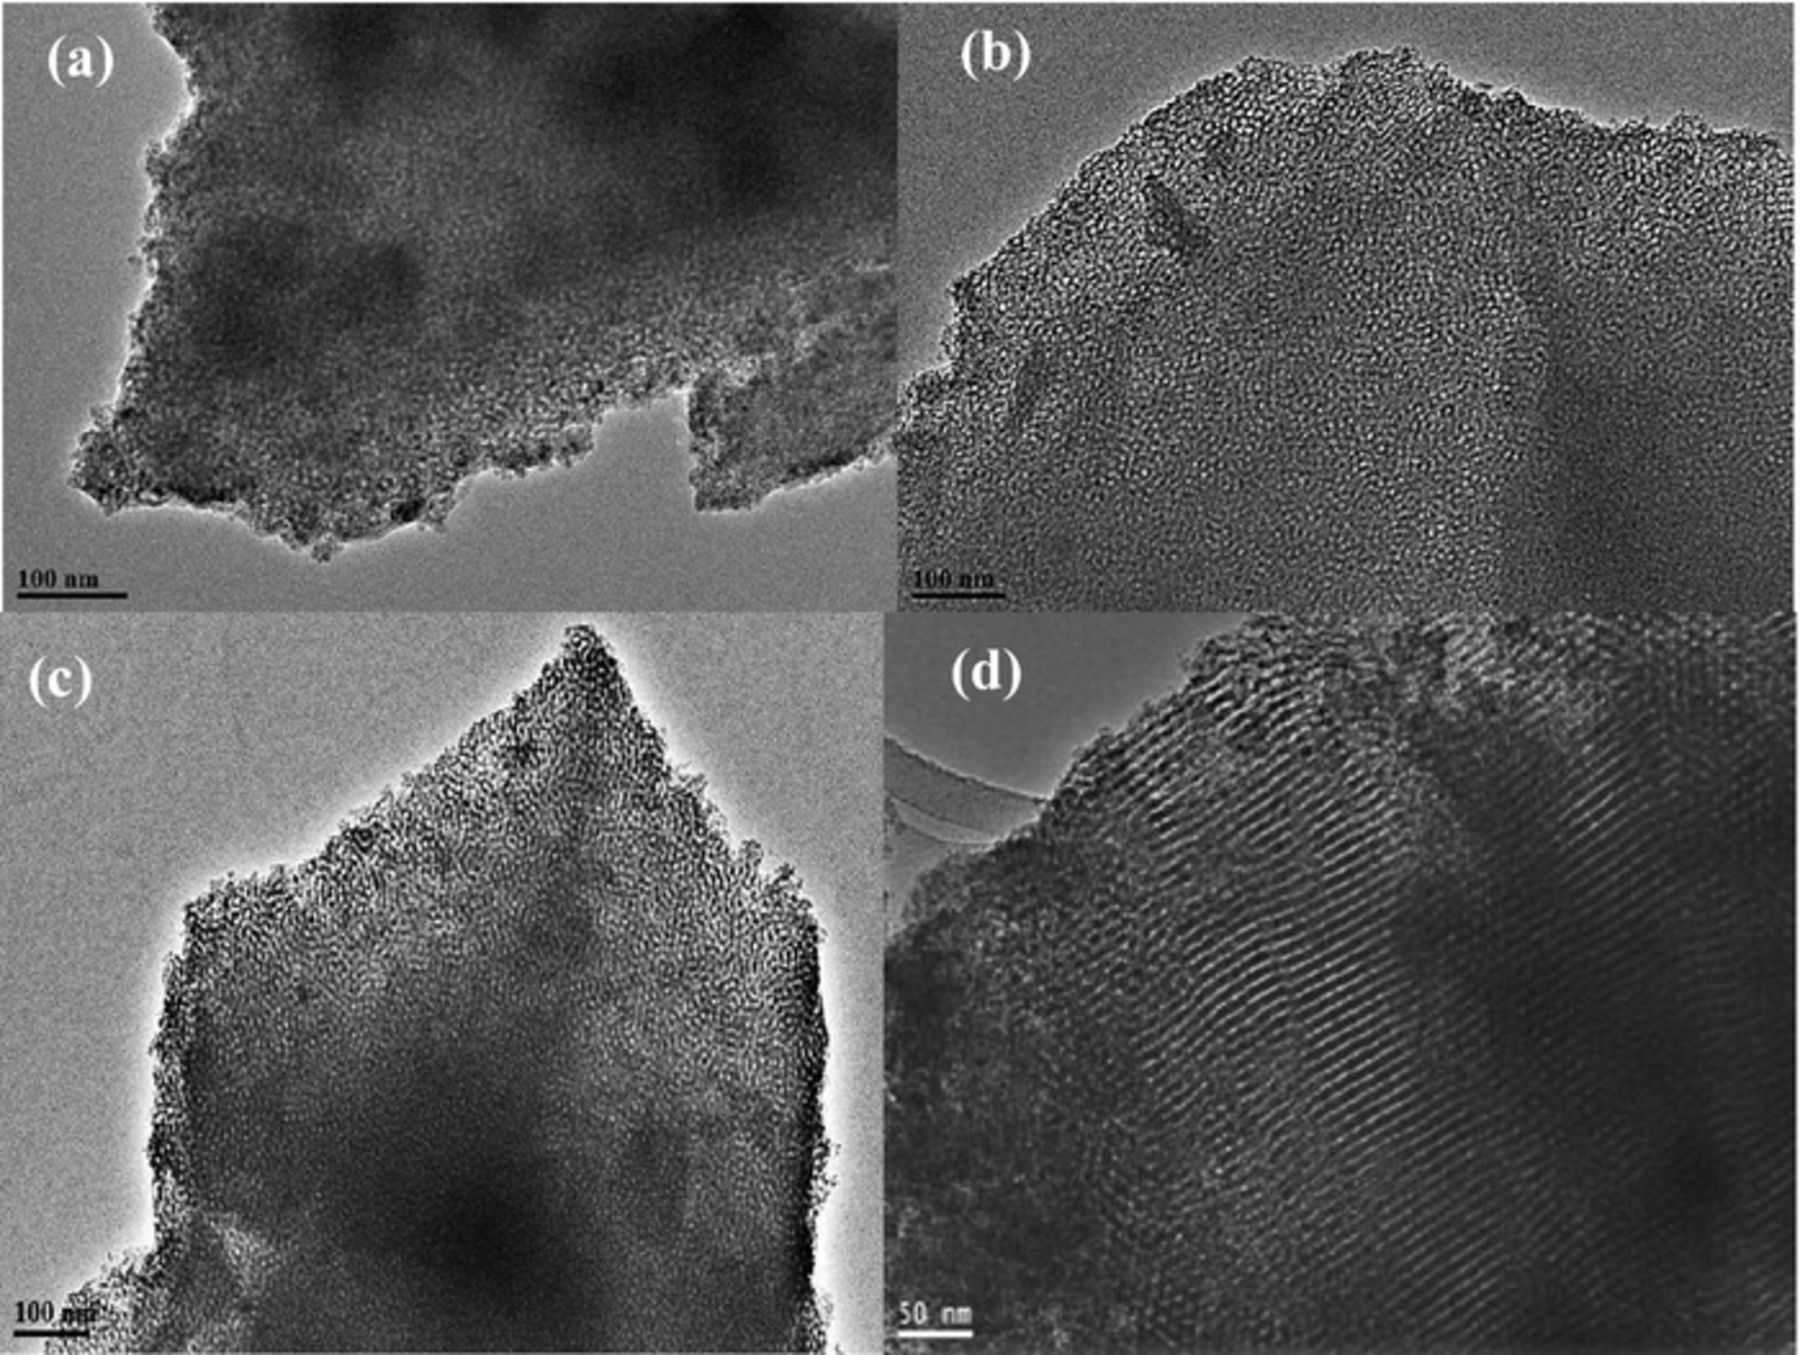
Figure 5. TEM images of lsm-TiO2 samples synthesized with various TBO/P123 mass ratios and after two steps calcination at 350°C for 3.0 h in N2 then 400°C for 4.0 h in air. (a) lsm-TiO2@1.0 (b) lsm-TiO2@1.5 (c) lsm-TiO2@2.0 and (d) hm-TiO2 catalysts.
In the case of the lsm-TiO2@1.0 catalyst (Figure 5a), the pores are not well defined, and the pore packing density is less than that of the lsm-TiO2@1.5 (Figure 5b) and lsm-TiO2@2.0 (Figure 5c) catalysts. In addition, the lsm-TiO2@2.0 (Figure 5c) catalyst exhibits more elongated pores than in the case of lsm-TiO2@1.5, which agrees with the surface morphology results in Figure 4 above.
Figure 5d shows the TEM image of the hexagonal mesoporous TiO2 (hm-TiO2), which has typical highly ordered 2D hexagonal mesochannels of TiO2 that are extended over a large domain; this is consistent with the corresponding XRD, N2 adsorption and SEM results. A high-resolution TEM image of the lsm-TiO2@2.0 catalyst is shown in Figure S2, which clearly shows the existence of micropores (less than 1 nm in size) and nanocrystalline domains (marked by red circles) with a size of 15 to 20 nm are embedded within the microporous TiO2 matrix. The inset in Figure S2b shows the electron diffraction pattern of the lsm-TiO2@2.0 catalyst that exhibits several weak diffraction rings, indicative of semi-crystallized wall structures in good agreement with the X-ray data.
Electrochemical oxygen evolution activity of the low-symmetry mesoporous TiO2 catalysts
The electrocatalytic oxygen evolution performance of the prepared low-symmetry mesoporous TiO2 (lsm-TiO2) and hm-TiO2 catalysts was investigated in alkaline solution. The mesoporous TiO2 catalyst was deposited onto FTO substrate using electrophoretic deposition method and the average loading was about 0.7 mg cm−2 for each electrode unless otherwise stated. Moreover, after the catalyst electrophoretic deposition on FTO substrate the surface morphology and composition of the thin films were checked by scanning electron microscope and EDX analysis as shown in Figure S3 (SI). Clearly the surface morphology of the lsm-TiO2@1.5 after deposition onto FTO substrate is very uniform and the composition of pure TiO2 was evidence by EDX analysis in Figure S3b. Figure 6a shows the linear sweep voltammetry (LSV) measurements for the lsm-TiO2 /FTO electrodes (catalyst loading) at a scan rate of 10 mV s−1 in 1.0 M KOH solution. As seen from the LSV plots, the bare-TiO2 electrode did not show an oxygen evolution current, while the lsm-TiO2 catalysts show currents characteristic of the oxygen evolution reaction and the lsm-TiO2@1.5 is the most active catalyst. Interestingly, lsm-TiO2@1.5 shows a significantly lower onset potential of 1.55 V vs. RHE and higher current density of 75 mA cm−2 at 2.0 V in comparison against the hm-TiO2 catalyst (1.83 V and 5.0 mA cm−2). The negative shift in OER onset potential is more visible in the expanded LSV shown in Figure S4a. The OER onset potential and the current density of lsm-TiO2@1.5 further enhanced as the concentration of KOH increased, as illustrated in Figure 6b and Figure S4b. The OER onset potential is negatively shifted by up to 135 mV as the hydroxide concentration increased from 0.1 to 5.0 M, presumably because of the pH and Nernst effects. In addition, the current density reached a value of 110 mA cm−2 at 2.0 V vs. RHE in a 5.0 M KOH solution (Figure 6b). This is because a higher KOH concentration increases the electrolyte conductivity and accessibility to the active sites deep within the micro- and mesoporous structures of TiO2 framework. Interestingly, the cyclic voltammograms (CV) shown in Figure S4b (SI) exhibit higher current passes during the reverse scans, which indicates that the catalyst is activated by the cycling in the hydroxide solution.
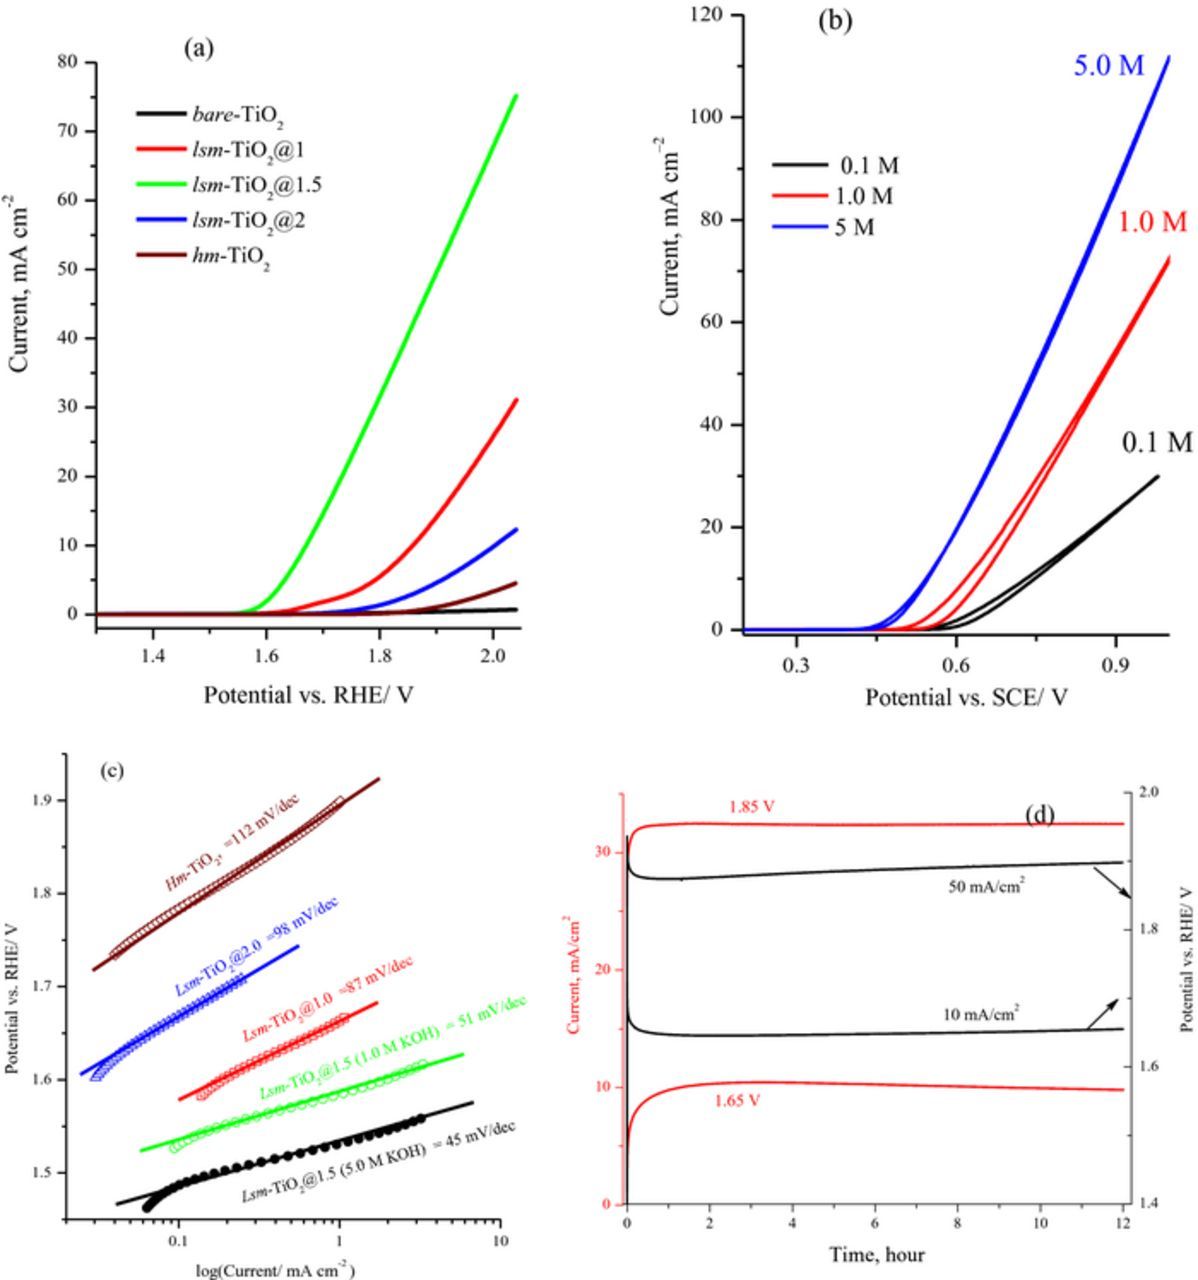
Figure 6. (a) Linear sweep voltammograms at 10 mV s−1 for bare-TiO2, the lsm-TiO2 and hm-TiO2 electrodes in 1.0 M KOH. Catalyst loading ∼0.7 mg/cm2 for all the electrodes and assembled by electrophoresis on fluoride-doped tin oxide (FTO) substrate. b) Cyclic voltammograms of the lsm-TiO2@1.5 catalyst at 10 mV s−1 in different concentrations of KOH solution. (c) Tafel plot at lower polarization of oxygen evolution reaction obtained from data in Figure 4a. d) Chronoamperometric and Chronopotentiometric curves obtained for 12 hours electrolysis for the lsm-TiO2@1.5 catalyst in 1.0 M KOH at different applied electrolysis potential and current density.
The other catalytic activity metric is the Tafel slope, and, as shown in Figure 6c, the Tafel plots of the lsm-TiO2 catalysts show a linear dependence with the logarithm of the current density. The corresponding Tafel slope for lsm-TiO2@1.5 is very small and equals 51 and 45 mV dec−1 in 1.0 and 5.0 M hydroxide solutions, respectively. These values are considerably smaller than those for the lsm-TiO2@1.0 (87 mV dec−1), lsm-TiO2@2.0 (98 mV dec−1), and hm-TiO2 (112 mV dec−1) catalysts. The lower values of the onset potential and the Tafel slope of the lsm-TiO2@1.5 catalyst indicate the higher OER rate than the other studied catalysts, and a current of about 40 mA cm−2 was achieved at 1.85 V vs. RHE; consequently, the current density would be greatly enhanced at a higher overpotential. The effect of lsm-TiO2@1.5 catalyst loading on oxygen evolution electrochemical activity in 1.0 M KOH is shown in Figure S4c (SI). Evidently, no change was observed for oxygen evolution onset potential as the catalyst loading increases while the current is slightly increases at more positive potential.
The OE activity of the lsm-TiO2 catalysts can be attributed to the open porous structure of short-range order of the bimodal spherical pores and transverse worm-like channels in the amorphous TiO2 thin film (loading < 1.0 mg cm−2, average thickness 3.5 μm), which provide short pathways for fast ion diffusion, mass transport and excellent electron transport throughout the entire electrode structure. In contrast, the 2D highly ordered hexagonal channels of hm-TiO2 catalyst, which have a comparable surface area and higher pore volume to that of the lsm-TiO2@1.5 catalyst, provide long ion diffusion pathways and less mass transport rate to the active sites.
The long-term OE performance stability of the catalyst is an essential metric for catalyst evaluation and Figure 6d shows the long-term stability of lsm-TiO2@1.5 catalyst for OER, as measured by chronoamperometry at constant potentials of 1.65 and 1.85 V vs. RHE and chronopotentiometry at 10 and 50 mA cm−2 in 1.0 M KOH. At the start of measurement, the current–time transient exhibited a sharp increase in the current density for several minutes; then, the current remained constant for the 12 h electrolysis period at about 10 and 32 mA cm−2 for applied potentials of 1.65 and 1.85 V vs. RHE, respectively. Further evidence of the stability of the lsm-TiO2@1.5 electrode can be seen during the electrolysis at constant current densities of 10 and 50 mA cm−2 in 1.0 M KOH solution, as shown in Figure 6d. The potentials required to achieve current densities of 10 and 50 mA cm−2 were 1.65 and 1.85 V vs. RHE respectively, which then stabilized around these values without drifting during the 12 hours electrolysis session. In addition, this result indicates that the lsm-TiO2@1.5 catalyst does not suffer from corrosion, surface passivation, or degradation during electrolysis in an alkaline solution, such as has been observed for some transition metal oxide catalysts, which are easily dissolved at higher oxidation potentials.61,62
To evaluate the OER electrocatalytic activity of lsm-TiO2@1.5, we compared our catalyst activity with previously reported OER electrocatalysts (Co, Ni, and Fe oxides). This evaluation is shown in Figure 7, and Table S2, where the OE onset potential, Tafel slope, and overpotentials required to achieve a current density of 10 mA cm−2 are shown.
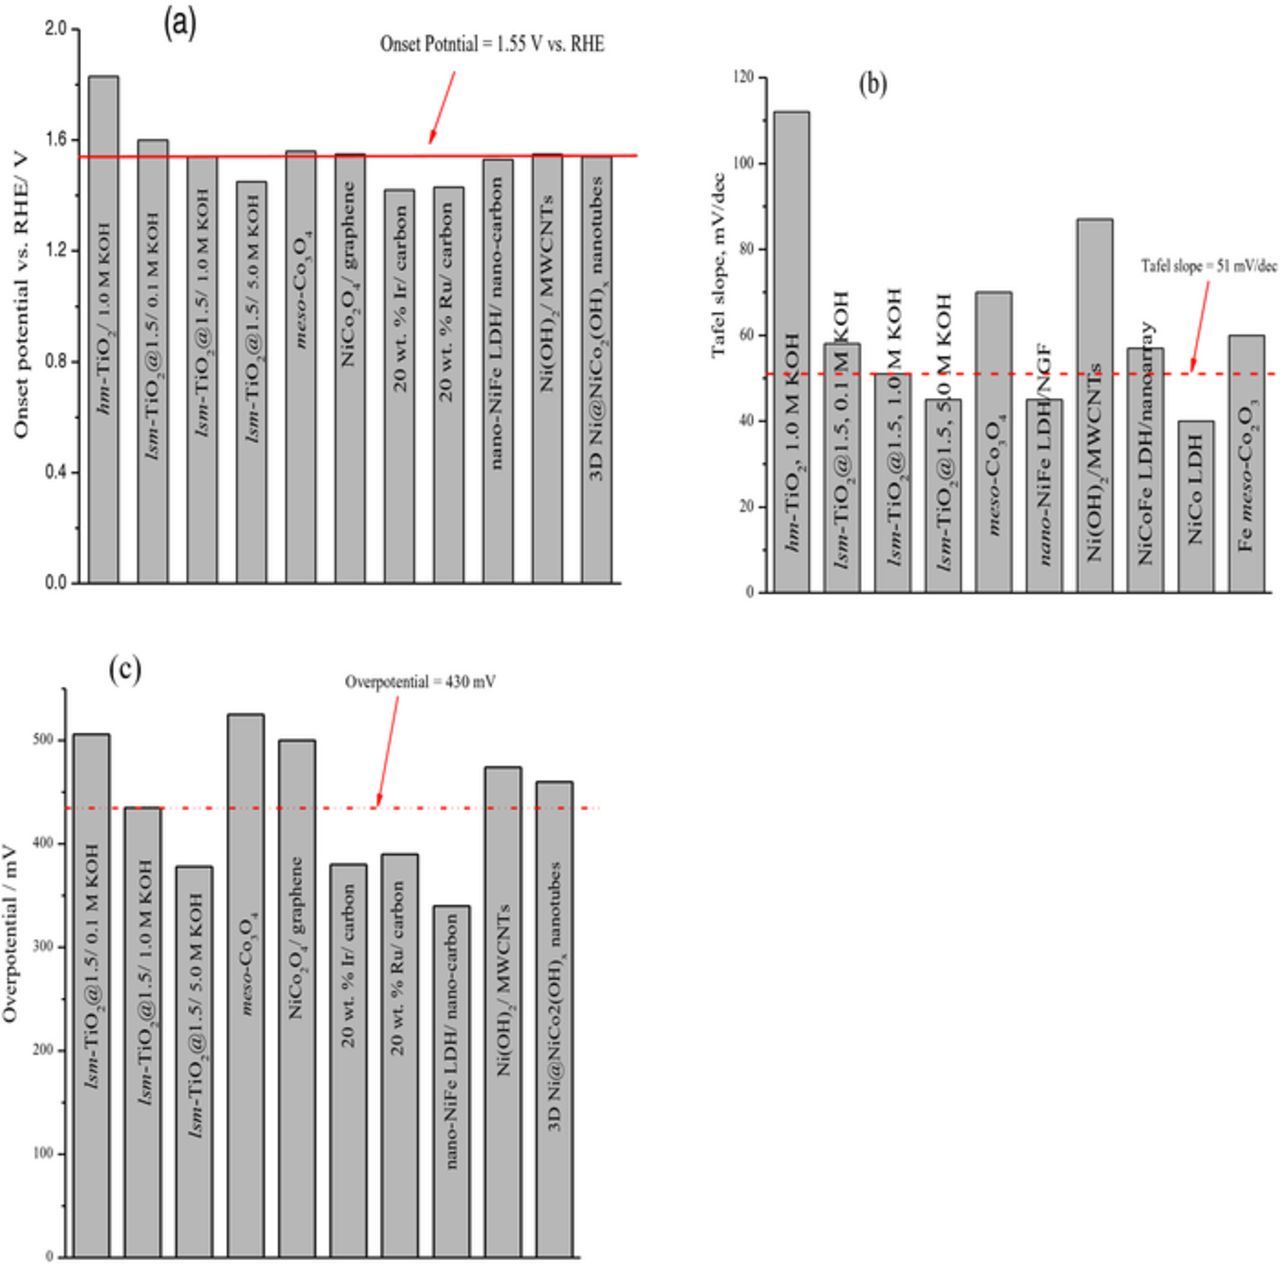
Figure 7. Comparison of the lsm-TiO2@1.5 catalyst OE activity with the (Co, Ni, and Fe oxides) based catalysts previously reported in the literatures. a) OE onset potential, b) Tafel slope, and c) overpotential required to achieve a current density of 10 mA cm−2. All values were reported for OER in 1.0 M KOH unless otherwise stated; the red line shows the level of lsm-TiO2-1.5 OE activity.
The lsm-TiO2@1.5 catalyst in different hydroxide concentration exhibited OER activities that are comparable to the values of well-known precious metal electrocatalysts, such as those of Ru and Ir oxides.61 In addition, as illustrated in Figure 7, the values of OE onset potential, Tafel slope, and overpotentials required to achieve a current density of 10 mA cm−2 for lsm-TiO2@1.5 catalyst are significantly better than those of mesoporous Co2O362 and Ni(OH)2/multi-walled carbons nanotubes (MWCNTs).63
Electrochemical impedance spectroscopy (EIS) and O2 evolution rate
EIS measurements were performed to investigate the OER kinetics and charge transfer process and to obtain more quantitative information about the OER at the lsm-TiO2 electrodes. Figure 8a displays typical Nyquist plots of the lsm-TiO2 and hm-TiO2 electrodes, which were measured in 0.1 M KOH (pH = 13.4) at 1.55 V vs. RHE in the frequency range of 10−2 to 200 kHz.
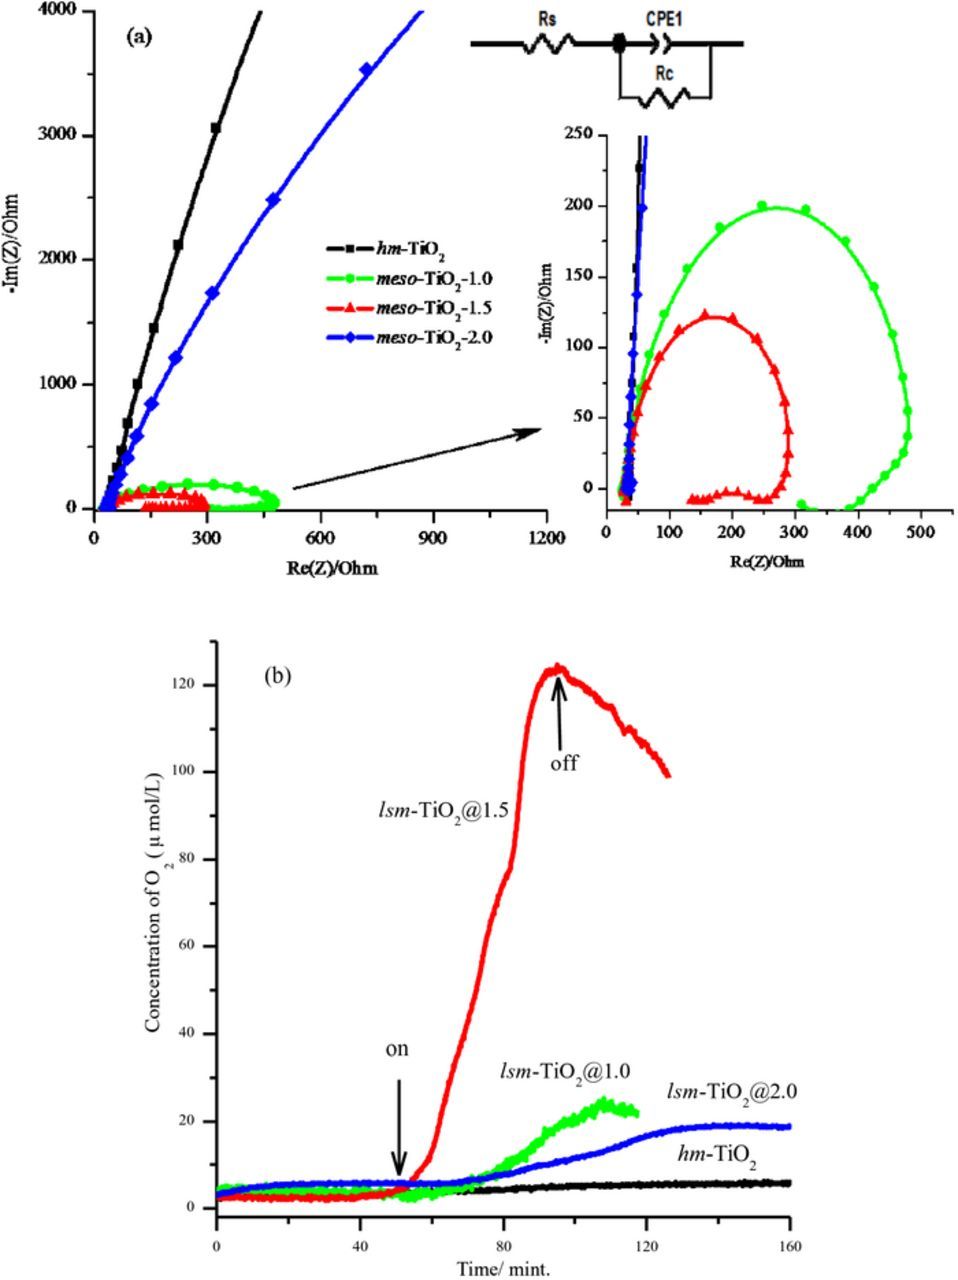
Figure 8. (a) Nyquist plots for lsm-TiO2 and hm-TiO2 electrodes at 1.55 V vs. RHE in 0.1 M KOH solution, pH = 13.4, in the frequency range of 10−2 to 200 kHz. Inset is the equivalent circuit used to fit the experimental data. (b) Time dependence of the O2 evolution as measured by the O2-oxysense sensor for lsm-TiO2 and hm-TiO2 electrodes (catalyst loading ∼ 0.7 mg), the arrows indicate the initiation and termination of electrolysis at 1.55 V vs. RHE.
The equivalent resistor–capacitor (RC) circuit model was obtained from the fitting of the impedance spectra, as shown in the inset. The equivalent circuit elements include a resistor (Rs), representing the resistivity of the electrolyte between the working and reference electrode; the charge transfer resistance (Rc), representing the charge transfer resistivity of the electrochemical reaction; and the capacitance (C) in parallel to (R), which is analogous to the double layer charging capacity at the solid-liquid interface. The fitted values of Rs, Rc, and C were calculated, and these are summarized in Table II. As shown in the EIS spectra, the hm-TiO2 and lsm-TiO2@2.0 show the maximum arc radius in comparison with other electrodes, indicating a large resistance for the electron transfer process.
Table II. AC impedance parameters of low-symmetry mesoporous TiO2 (lsm-TiO2) catalysts obtained by fitting the experimental data in Figure 6a.
| Impedance | lsm-TiO2@1.0 | lsm-TiO2@1.5 | lsm-TiO2@2.0 | hm-TiO2 |
|---|---|---|---|---|
| Rs (Ω) | 27 | 25 | 18 | 33 |
| Rc (Ω) | 465 | 269 | 10489 | 171030 |
| C (μF) | 76 | 60 | 18 | 17 |
In contrast, the lsm-TiO2@1.0 and lsm-TiO2@1.5 electrodes exhibited smaller arc radii at higher frequency, and charge transfer resistances (Rc) of 465 and 269 Ω were achieved, respectively (see the inset in Figure 8a). This indicates that lsm-TiO2@1.5 has better electronic conductivity, and oxygen evolution at this electrode is more kinetically favorable than at the lsm-TiO2@1.0 and lsm-TiO2@2.0 electrodes; these results agree well with those of cyclic voltammetry.
The apparent O2 evolution rate of the lsm-TiO2 and hm-TiO2 catalysts was monitored during electrolysis using the chemical oxygen sensor in 0.1 M KOH at an applied potential of 1.55 V vs. RHE. The results are shown in Figure 8b. As can be seen in Figure 7b, after starting the electrolysis at 1.55 V vs. RHE, the oxygen concentration increased significantly and linearly with time for lsm-TiO2@1.5, and the apparent oxygen evolution rate reached 210 μmol h−1, while a trivial quantity of oxygen was evolved at the other studied electrodes.
Conclusions
In summary, thin film of low-symmetry mesoporous titanium dioxide (lsm-TiO2) electrocatalysts were prepared by a adapted evaporation-induced self-assembly approach, followed by calcination in N2 and then in air. The resulting lsm-TiO2 catalysts exhibited large surface areas (100–200 m2 g−1) and extraordinary electrocatalytic activities for the OER in alkaline media. The lsm-TiO2@1.5 catalyst with a TBO/P123 ratio of 1.5 wt% showed the most efficient catalytic performance for the OER in alkaline water, evidenced by the negative shift in the onset potential at 1.55 V vs. RHE, small Tafel slope and the high current density of 11 mA cm−2 at 1.65 V vs. RHE. In contrast, with the highly ordered mesoporous hexagonal TiO2 (hm-TiO2) catalyst, the lsm-TiO2 electrodes exhibits unprecedented oxygen evolution activity and excellent long-term stability, which are very similar to the benchmark transition metal oxide electrocatalysts. This is attributed to the combination of low-symmetry hierarchical mesopores with a semi-crystalline TiO2 framework, large surface area and abundant active sites, which is favorable for electron transfer, creating short reactant and product diffusion pathways and a large solid-electrolyte interface for the OER. Thus, this work opens a new route to engineer more open mesostructures of low-symmetry (short-range-order) mesoporous catalysts with enhanced activity for energy production and conversion applications.
Acknowledgments
The authors would like to extend their sincere appreciation to the Deanship of Scientific Research at King Saud University for funding this Research group No: RG-1437-015. The authors appreciate Dr. Yuhui Li and Prof. Dongyuan Zhao from Fudan University for their cooperation in the SEM and TEM analysis.
ORCID
Mohamed A. Ghanem 0000-0003-2866-9016