Abstract
Shape controlled octahedral Pt-Ni alloy nanoparticles are promising oxygen reduction reaction (ORR) electrocatalysts for cathodes of low temperature Polymer Electrolyte Membrane fuel cells. Organic surfactants are used in order to control and tune particle composition, size, shape, and the distribution on the support material. Such methods request intense post-synthesis cleaning, or annealing procedures in order to remove the ligands, demanding for simpler cleaning and activation procedures. Here, we explore the effect of an acetic acid treatment of as-prepared Pt-Ni particles, applied prior to annealing. The resulting nanoparticles underwent an electrochemical surface characterization and were investigated in terms of their ORR activities and electrochemical long-term stability. After acid treatment the particles exhibit a Pt-rich surface, which changed slightly during annealing at 300°C but drastically to a more homogeneous alloy after annealing at 500°C due to Ni surface segregation. Besides changes in the (sub-)surface Pt and Ni composition, the octahedral shape did not survive the 500°C treatment. An improved ORR activity was obtained after annealing at 300°C. Our insights into effects and benefits of the described post-synthesis treatments aid our general understanding, but also may help improve the practical design of suitable treatment protocols of this class of ORR catalyst.
Export citation and abstract BibTeX RIS

This is an open access article distributed under the terms of the Creative Commons Attribution 4.0 License (CC BY, http://creativecommons.org/licenses/by/4.0/), which permits unrestricted reuse of the work in any medium, provided the original work is properly cited.
Pt-Ni based alloy nanoparticles are promising candidates as electrocatalysts for the oxygen reduction reaction (ORR) in cathode layers of fuel cells.1–4 More specifically, octahedral shaped Pt-Ni nanoparticles have attracted much attention because they exhibit catalytically highly active {111}-oriented facets.5–8 A number of different synthesis methods were reported, often including long-chain organic ligands and capping agents, which, on one hand, allow a careful tuning of particle size, shape, distribution, and composition, but on the other hand require elaborate and often tricky post-synthesis treatments.9–12 To generate clean and reactive particle surfaces washing with organic solvents, acid/base treatments and thermal annealing have been described.7,13–18 In addition, to a particle surface cleaning, these treatments tune and change the particles' surface and sub-surface compositions and therefore strongly influence the interfacial catalysis.
In a previous study, a series of thermally annealed Pt-Ni octahedral particles were prepared and characterized in terms of their shape evolution and changes in degree of alloying during heating.18 In the present study, we systematically investigate the impact of combined acid leaching/annealing treatments on the catalytic ORR activity and corresponding electrochemical stabilities of the alloy ORR catalysts. More specifically, the impact of acetic acid treatment coupled to an annealing protocol will be investigated in terms of ORR activity after activation and 4k cycles stability measurement. Electrochemical CO oxidation voltammetry is used as a probe in order to analyze the nanoparticle surface characteristics. We derive valuable information in terms of their catalytic behavior, surface and sub-surface condition and Pt versus Ni enrichment in the surface from that.
Experimental
Synthesis of Pt-Ni/C oct9,18
Pt-Ni/C octahedral nanoparticles were prepared by adding Pt(acac)2 (0.407 mmol, Pt 48% min., Alfa Aesar), Ni(acac)2 (0.934 mmol, 95.0%, Alfa Aesar), OAm (48 mL, 98.0%, Sigma Aldrich) and OAc (32 mL, 90%, Alfa Aesar) into a 100 ml three-neck-flask under reflux. After stirring for 5 minutes under nitrogen (N2) atmosphere at 60°C the temperature was raised to 130°C. At this temperature W(CO)6 (1.591 mmol, 97.0%, Alfa Aesar) was added rapidly, N2 purging was stopped and the reaction mixture was heated to 230°C and then stirred for 50 minutes. After the reaction mixture was cooled down to room temperature toluene (20 mL, 99.8%, Roth) and ethanol (60 ml, 100%, VWR Chemicals) were added. The supernatant was removed by centrifugation (7800 rpm for 15 min) and dispersed in toluene (20 mL). The dispersion was added to a dispersion of Vulcan XC 72R (160 mg) in toluene (20 mL) and sonicated with an ultrasonic horn for 30 min. Ethanol (10 mL) was added and the catalyst was centrifuged (7800 rpm for 15 min), washed with ethanol (30 mL) three times, and freeze dried for 12 h.
Acetic acid leaching and annealing of Pt-Ni/C oct
The synthesized powder was boiled in acetic acid (50 mL, ≥ 99.0%, Sigma Aldrich) at 60°C for 30 minutes and subsequently washed with ethanol (30 mL) three times. After freeze drying for 12 h the powders were heated to 180°C at a rate of 10 K min−1 in a tube furnace in synthetic air atmosphere and left for 30 min. After purging with N2 for 30 min, the atmosphere was changed to hydrogen (4%/Ar) and the temperature was raised at a rate of 10 K min−1 to 300°C (HAc_300) or to 500°C (HAc_500) and left for 1 h. Afterwards it was allowed to cool to room temperature in N2.
Physico-chemical characterization
X-ray diffraction (XRD) patterns were collected on a Bruker D8 Advance (Siemens KFL Cu 2 K X-ray tube and Lynx Eye detector) diffractometer in Bragg Brentano geometry using a Cu Kα1. The patterns were recorded between 20–80° with a step size of 0.05° and a 10 s measurement time at each step. Inductively coupled plasma analysis (ICP OES) (Varian) was used to determine the elemental composition of the synthesized particles. The selected wavelengths for the concentration determination were reported previously.18,19 Transmission electron microscopy (TEM) was performed using a FEI Tecnai G2 20 S-TWIN with LaB6–cathode, 200 kV accelerating voltage and a resolution limit of 0.24 nm. Powder samples were dispersed on a 200 mesh Cu grid.
For electrochemical characterization a three electrode setup was used. The preparation of the ink and the electrode and the electrochemical setup were described before.18,19 The electrochemical activation was performed in 0.1 HClO4 via potential cycling (0.05–1.0 VRHE with 100 mV s−1 for 20 cycles) under N2 protected atmosphere. The Hupd based electrochemical active surface area (ECSA) was evaluated using the last cycle before the activity measurements. The charge values (QH) were calculated by integrating the respective cyclic voltammogram (CV) between 0.05 and 0.4 V and were normalized with respect to the theoretical value of QHtheo = 210 μC cm−2. For CO oxidation, the electrolyte was saturated with N2 for 15 min. Afterwards the working electrode was lowered into the electrolyte at 0.05 VRHE with 400 rpm rotation speed. Then, the gas was switched to CO for 10 minutes followed by a gas change to N2 again. Three CVs were recorded (0.05–1.0 VRHE with 50 mV s−1, 0 rpm). To determine the CO-based electrochemical active surface area, the voltammogram after the CO strip was subtracted from the CO-stripping voltammogram. The positive area of the resulting peak was integrated to obtain the CO charge value (QCO). The measured QCO value was normalized with respect to the theoretical value of QCOtheo = 420 μC cm−2. The catalytic activity was measured by linear sweep voltammetry in oxygen saturated electrolyte (0.05-1.0 VRHE with 5 mV s−1, 1600 rpm). The kinetic currents were calculated using Equation 1.
![Equation ([1])](https://content.cld.iop.org/journals/1945-7111/165/15/J3026/revision1/d0001.gif)
(j: measured current density at 0.9 V, jd: diffusion limited current area, jk: calculated kinetic current density)
All presented current densities are iR corrected, where the uncompensated ohmic resistance (R) was determined by potential electrochemical impedance spectroscopy (PEIS) at 0.4 VRHE.
Stability measurements were performed via potential cycling (0.05–1.0 VRHE with 50 mV s−1,0 rpm) in N2 sat. 0.1 M HClO4. Before, and after stability protocol three cyclic voltammograms (0.05–1.0 VRHE with 100 mV s−1, 0 rpm) were recorded. Reported error bars are presenting the standard deviation between at least three different and independent measurements of freshly prepared catalyst films.
Results and Discussion
The Pt-Ni/C catalysts were prepared using a wet chemical synthesis approach including OAm and OAc as surfactants and W(CO)6 as reducing agent. The as-prepared Pt-Ni/C particles underwent different post-synthesis treatments: first, treatment in acetic acid (HAc) in order to i) remove organic surfactants and ii) leach and deplete the surface in Ni. After the acetic acid leaching, the particles were exposed to an annealing procedure reported previously.18 The particles were first annealed in synthetic air for 30 minutes, followed by a reduction step for 1 h in a hydrogen atmosphere at two different temperatures, namely 300°C (HAc_300) and 500°C (HAc_500) (Figure 1A). The molar metal composition of the as-prepared Pt-Ni/C sample was Pt33Ni67, that of the HAc-treated catalyst Pt70Ni30 and Pt72Ni28 for HAc_300 and HAc_500, respectively.
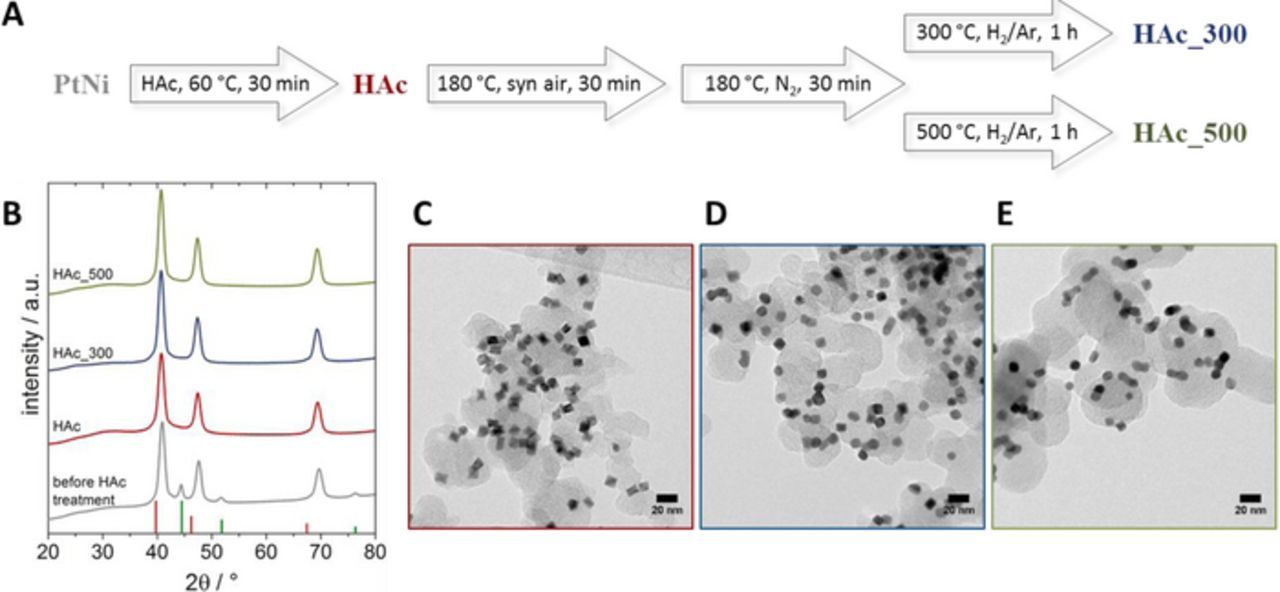
Figure 1. Introduction of samples; A Scheme of post-synthesis samples treatment; B X-Ray diffraction patterns of the Pt-Ni/C samples after post-synthesis treatment in comparison to the untreated sample, red columns indicate the reflection position of pure fcc Pt (#00-004-0802), green columns indicate the reflection position of pure fcc Ni (#00-004-0850); C-D TEM images of the Pt-Ni/C samples after post-synthesis treatments, HAc (C), HAc_300 (D), HAc_500 (E).
Acid leaching had a significant effect on the long-range crystal structure and the corresponding XRD patterns (Figure 1B). Prior to HAc leaching a separate Ni phase is clearly present at Bragg angles of around 44°, 52° and 76°, which disappeared completely after leaching (HAc). A Pt-enrichment of the Pt-Ni alloy phase after leaching is evidenced by the reflections at 2θ values of around 41°, 47° and 69°, which are located between the fcc reflections of pure Pt and pure Ni, and slightly shifted to lower 2θ values in comparison to the as-prepared samples. Detailed Rietveld refinement suggested two distinct Pt-Ni phases for the HAc treated samples, further supporting the removal of the Ni phase. In comparison to the previously reported series of samples,18 where we found a Ni-rich phase besides main Pt-Ni phase, no additional Ni-rich phase was present after the leaching procedure, and the experimental crystalline lattice constants were slightly larger, indicating some Ni leaching from the main Pt-rich Pt-Ni phases18 (Table S1 and 2, Figure S1). Interestingly, once the HAc treatment was applied, the annealing temperature itself had only a minor influence on the resulting crystallite size; it was only the alloy phase composition that changed after the combined HAc leaching/ 500°C annealing (Table S2). TEM images revealed intact octahedral shape for the HAc sample with an average edge length of 8.2 ± 1.2 nm (Figure 1C and Figure S2), which is in the same order of magnitude as before HAc treatment (8.4 ± 1.1 nm)18 (Figure S2). For HAc_300 (Figure 1D and Figure S2), octahedral edges are mostly rounded off, which is in contrast to our previous study without the preceding HAc treatment; there, the octahedral shape was retained and stable after the 300°C treatment.18 After annealing at 500°C, the octahedral particle shape was almost completely lost, and particles in close proximity coalesced (Figure 1E and Figure S2). It is important to note that the acetic acid treatment itself did not change the original octahedral shape (Figure S2), but did induce corrosive defects in the particle surface, which promoted a loss in shape during subsequent heat-treatment.
To investigate the effect of the combined acetic acid/annealing treatment on the surface properties of the catalysts and their catalytic ORR performance, the three materials were investigated in a three-electrode rotating disc electrode setup.
Figures 2A–2C show the cyclic voltammetry in oxygen-free conditions normalized to the amount of Pt on the electrode. This analysis reveals the surface electrochemical faradaic and capacitive behavior of the catalyst surface in absence of catalytic reactants. Hydrogen under potential deposition (Hupd) regions are well-developed for HAc (Figure 2A) and HAc_300 (Figure 2B) in the initial as well as in the activated state; they indicate the presence of Pt atoms and domains at the particle surface. Characteristic redox waves at around 0.2, 0.3 and 0.4 VRHE sharpen with progressing electrochemical cycling up to 4k cycles, suggesting the faceting of the Pt-rich surface.17,20 For HAc_500, the Hupd region is only weakly developed in the initial state and after activation, indicating a rather Ni-rich surface (Figure 2C) due to a more homogeneous alloy surface (Pt and Ni distribution) after annealing at high temperature.18 After 4k cycles, similar Hupd features like for HAc and HAc_300 can be observed, now suggesting a Pt-richer surface due to metal dissolution.

Figure 2. Electrochemical surface characterization of Pt-Ni/C after post-synthesis treatment. A-C Cyclic voltammograms recorded in N2 sat. HClO4 with 100 mV s−1 between 0.05 and 1.0 VRHE of the initial samples, after activation and after 4k cycles stability test; CO oxidation profiles recorded in N2 sat. HClO4 with 50 mV s−1 between 0.05 and 1.0 VRHE after purging with CO. Red lines indicate the sample HAc (A, D), blue line the samples HAc_300 (B, E) and green lines the sample HAc_500 (C, F).
To learn more about the surface characteristics, electrochemical CO oxidation was used (Figures 2D–2F). The CO stripping profiles of all three materials showed a main CO oxidation peak at around 0.7 VRHE, whereas the development of the main peak position was different within the materials with prolonging cycle number. Generally, the position of the main CO stripping is influenced by the adsorption strength of CO to the particle surface. A shift to higher potentials was caused by stronger adsorption energies of CO and can be interpreted as a Pt enrichment of the nanoparticle surface. HAc exhibited a more anodic peak potential after activation, compared to the initial and the after 4k stability state (Figure 2D). HAc_300 showed a more anodic peak potential after activation, which remained constant after 4k potential cycles. Importantly, an additional shoulder at around 0.8 VRHE appeared after 4k cycles, suggesting the emergence of a new surface site or facet with somewhat stronger CO binding. For HAc_500, the position of the main CO oxidation peak shifted to higher potential after 4k cycles, indicating again the formation of a Pt-enriched particle surface, probably due to Ni-leaching from the more homogeneous alloy surface.
From the electrochemical surface voltammetries of hydrogen and CO, the electrochemical active surface areas (ECSAs) were determined. Figure 3A shows the numbers for the ECSA obtained by integrating the charges associated with hydrogen under potential deposition (Hupd) and CO oxidation normalized to the respective charge densities. All three catalysts exhibited a similar Hupd ECSA in their initial state and after activation (Figure 3A, solid bars, dark and medium colored) while after 4k cycles (Figure 3A, solid bars, lighter colored) the one for HAc_300 stays constant in comparison to the ones of HAc and HAc_500 which slightly increase (see also Figure 3B). In contrast, CO stripping revealed larger ECSA values, which was expected for Pt-alloy based systems, but they also showed a quite different trajectory after 4k cycles stability (Figure 3A, hatched bars). HAc and HAc_500 values decreased or stayed constant within the error compared to the activated state. HAc_300, however, which showed constant ECSA values based on Hupd, showed a drastic increase in ECSA value after 4k cycles (see also Figure 3B). This observation suggest the formation of an additional surface side, which do not adsorb hydrogen but CO and OH species.
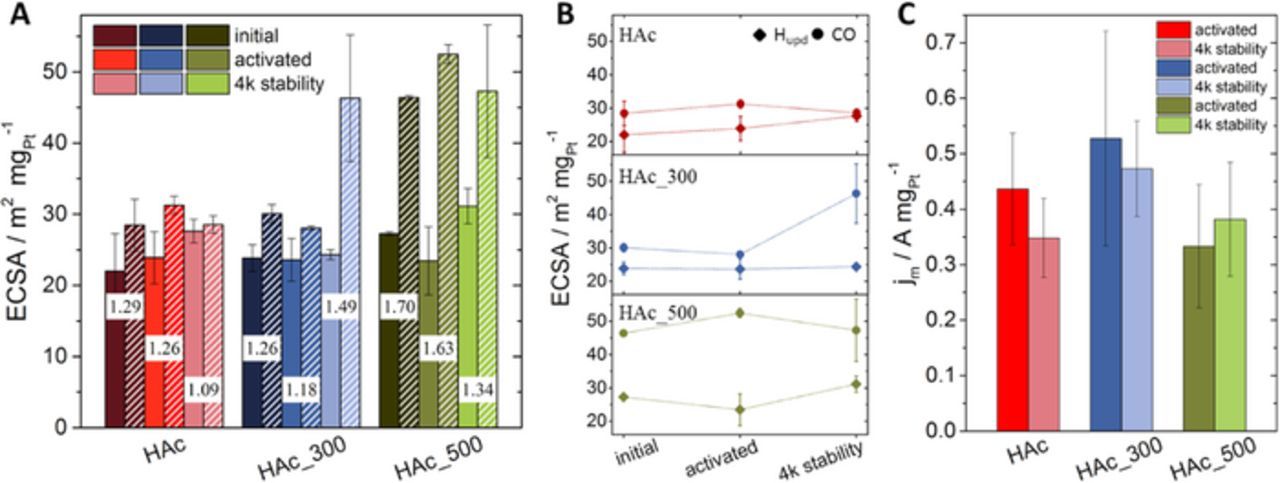
Figure 3. Electrochemical surface areas (ECSAs) and mass based ORR activity; A ECSA based on hydrogen under potential deposition (solid bars) and on CO oxidation (striped bars) of initial materials, after electrochemical activation and 4k cycles stability test. The numbers between the bars indicate the respective QCO/2QHupd values; B Evolution of ECSA values with progressive numbers of electrochemical cycles; round symbols CO ECSA, squared symbols Hupd ECSA, lines between the symbols should guide the eye; C Mass based ORR activity after electrochemical activation and 4k cycles stability test evaluated at 0.9 VRHE from LSVs measured between 0.05 and 1.0 VRHE with 5 mV s−1 in 0.1 M HClO4.
It has been reported, that the charge ratio of Hupd to CO, QCO/2QHupd, may have some qualitative predictive power as to the surface / sub-surface Pt-to-Ni composition.21 QCO/2QHupd values close to 1.0 were reported to suggest a pure Pt or Pt-rich surface, a thick Pt shell or a uniform distribution of Pt and Ni. Values closer to 1.5 suggest a Pt-skin type surface, where a Pt rich top layer is supported by a Ni-richer second atomic layer.
HAc exhibited a charge ratio value of 1.29 and likely represents a situation with a thin Pt surface shell-like structure, probably caused by the acetic acid treatment (Figure 3A, numbers between the bars). After activation and 4k cycles the charge ratio values decreased progressively, consistent with a thickening of the Pt shell or the formation of a more homogeneous surface alloy. The formation of a thicker Pt shell is rather likely, due to the peak developments discussed in the cyclic voltammograms obtained in N2 protected atmosphere.
HAc_300 behaves quite differently, after activation the QCO/2QHupd value decreased from 1.26 to 1.18, but increased again after 4k cycles to 1.49. This is consistent with the notion of an initial thickening of the Pt shell, as it also have been observed for HAc. The subsequent increases, on the other hand, suggesting a more "Pt-skin" type particle surface composition, is likely caused by Ni atomic segregation into the sub-monolayer regions during annealing at 300°C in H2.13,18,22,23 This advanced structure is also suggested by the additional peak occurrence in the CO stripping voltammograms and has been observed in a similar set of samples before.18
HAc_500, finally, showed a large initial charge ratio value of 1.70 indicating a defect Ni-rich surface, in line with the weak Hupd features shown in Figure 2C. With subsequent electrochemical potential cycling, these charge ratio values decreased again due to strong Ni leaching, now creating a thick Pt-enriched surface, which also is supported by the cyclic voltammograms in N2 atmospheres discussed above and the increase in the CO stripping peak potential.
Figure 4 illustrates the experimentally observed surface and sub-surface conditions of the discussed materials based on our combined analyses of cyclic voltammograms, CO stripping voltammograms and QCO/2QHupd values.
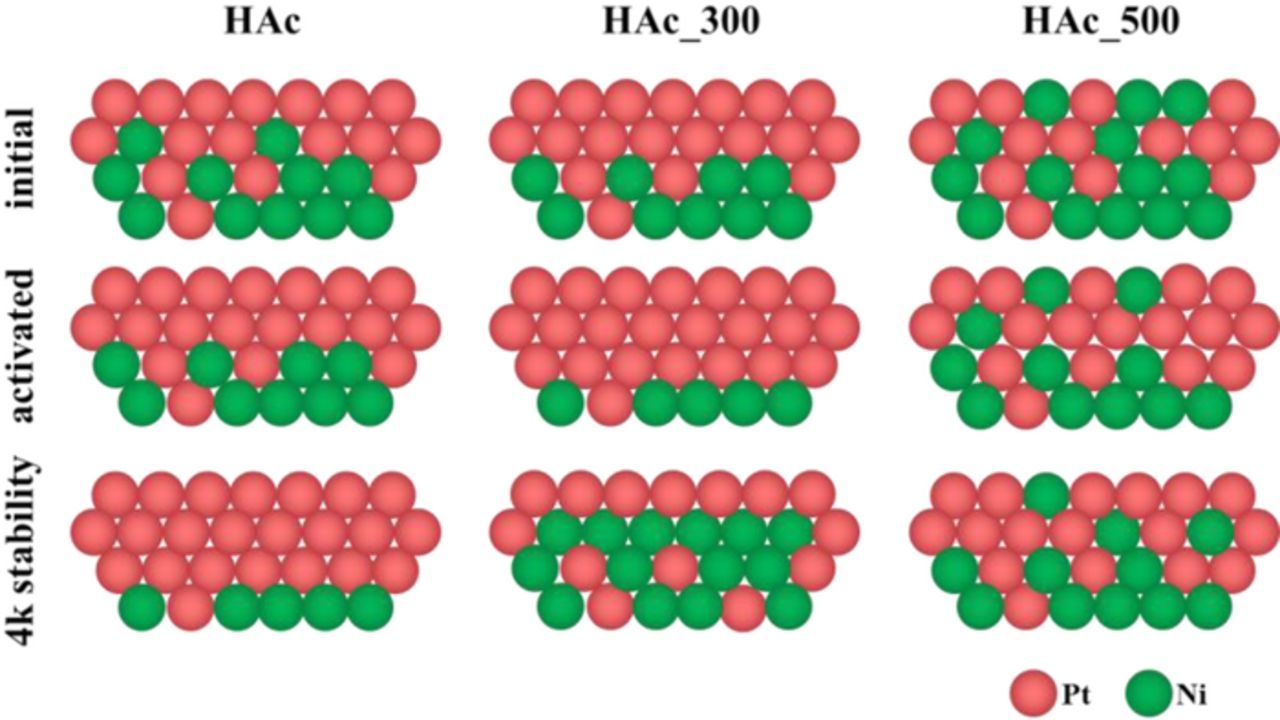
Figure 4. Schematic illustration of possible surface and subsurface condition of HAc, HAc_300 and HAc_500 in their initial and activated state and after 4k stability test.
Comparing the values among the samples in the initial stages, HAc probably exhibited a pronounced Pt shell, while HAc_500 was Ni-rich in its surface. Thus, a temperature treatment significantly changes the surface composition, even of relatively Pt-rich surfaces, by creating more homogeneous surface alloys. This effect starts to emerge at temperature above 300°C, because the HAc_300 sample exhibits a mostly Pt enriched surface. Annealing at 300°C under the chosen conditions seems to have a comparable effect on the particle surface like the activated HAc as both exhibit the same QCO/2QHupd value. The initial conditions of the surfaces have a high influence on the surface changes during electrochemical cycling. HAc sample only showed a thickening of the Pt shell with increasing number of electrochemical cycles, which was also happening to HAc_500 even though the initial state was much more Ni-rich. A thickening of the Pt shell was also happening to HAc_300 after activation, but after 4k cycles the particle surface was changing in a different way according to the additional shoulder in the CO stripping profile (Figure 2E) and the QCO/2QHupd values (Figure 3A). The presence of a Pt-skin like structure, supported by the QCO/2QHupd value of 1.49, also offers a reasonable explanation for the emergence of the additional CO profile shoulder, which was indeed reported for Pt-skin like surface in single crystals.21
To correlate the detailed surface compositional changes with the resulting experimental oxygen reduction reaction (ORR) activities, linear sweep voltammetry in oxygen saturated electrolyte was used, and the Pt-mass based current densities were determined (Figure 3C). HAc_300 showed the highest ORR activity after activation and after 4k cycles stability test, with no activity drop after 4k cycles (drop is within the error). After activation HAc showed a slightly lower activity than HAc_300 and a small drop in activity after 4k stability. HAc_500, which overall showed the smallest ORR activity was stable after 4k cycles, which was likely due to the loss in octahedral shape. In general, all measured ORR activities are in the same order of magnitude. In comparison to ORR activities usually reported for octahedral Pt-Ni nanoparticles, our observed ones are rather low, possibly due to the formation of a more defect particle surface induced by leaching and annealing. Nevertheless, HAc_300 exhibits the highest ORR activity and a good electrochemical stability. Thus, annealing at 300°C after an acetic acid treatment seems to lead to an improved surface and subsurface condition, resulting in slightly higher ORR activities.
Other than in our previous study, annealing had a smaller impact on the resulting ORR activity and stability values when performed on acid leached samples.18 Without a preceding acid treatment particles are much more sensitive in terms of heat treatments, but in principle the same trends were overserved.
Conclusions
To conclude, in this contribution we have investigated how an initial acid treatment preceding a thermal annealing affects the surface electrochemistry and catalytic ORR activity of shaped Pt-Ni nanoparticles. We conclude that the initial post-synthesis acid treatment generates a Pt-enriched surface on octahedral Pt-Ni nanoparticles. With subsequent annealing at 300°C, first a more Pt enriched surface was generated before, at high temperatures of 500°C, we observed a strong migration of Ni to the particles surface, generating a Ni-richer surface. The Pt enriched surface after annealing at 300°C leads to improved ORR activity and quite good stability. Thus, it appears that the combination of acid leaching followed by annealing leads to surface compositional conditions of the shaped Pt-Ni nanoparticles beneficial for efficient and stable electrocatalytic oxygen reduction performance.
Acknowledgments
We thank the Zentraleinrichtung für Elektronenmikroskopie (ZELMI) of the Technical University Berlin for its support with TEM measurements. Financial support was given by Deutsche Forschungsgemeinschaft (DFG) grants HE7192/1-2 ("Nanoskalige Pt Legierungselektrokatalysatoren mit definierter Morphologie") and by the German Federal Ministry of Education and Research (Bundesministerium für Bildung und Forschung, BMBF) under grant 03SF0527A ("LoPlaKats").
ORCID
Peter Strasser 0000-0002-3884-436X