Abstract
The stoichiometry, efficiency, and product distribution for ethanol oxidation in fuel cell hardware has been determined at 80°C for commercial Pt/C, PtRu/C and PtSn/C anode catalysts. The amounts of ethanol consumed and acetic acid and acetaldehyde produced were determined by proton NMR spectroscopy while CO2 was measured with a non-dispersive infrared CO2 monitor. The Pt/C catalyst was most selective for the complete oxidation of ethanol to CO2 at all potentials and therefore produced the highest number of electrons per ethanol molecule (stoichiometry). Consequently, it would provide the highest efficiency for a fuel cell, and for an electrolysis cell at high current densities. However, PtRu/C provided much higher currents at low overpotentials and therefore better electrolysis efficiency than Pt/C at low current densities. The main product at the PtRu/C catalyst was acetic acid, with ≥ 86% conversion at potentials ≥ 0.35 V vs. a dynamic hydrogen electrode. The PtSn/C catalyst also provided high yields of acetic acid (65–75%), with substantial production of CO2 (26–27%) at high potentials.
Export citation and abstract BibTeX RIS

This is an open access article distributed under the terms of the Creative Commons Attribution 4.0 License (CC BY, http://creativecommons.org/licenses/by/4.0/), which permits unrestricted reuse of the work in any medium, provided the original work is properly cited.
The electrochemical oxidation of ethanol in cells with proton exchange membrane (PEM) electrolytes is of central importance to the development of energy technologies based on bio-ethanol. PEM-based direct ethanol fuel cell (DEFC)1,2 power systems are potentially one of the best alternatives to internal combustion engines,3 although their efficiencies will need to be increased significantly. Alternatively, ethanol electrolysis cells (EEC) can be used to produce hydrogen.4–6 In an EEC, ethanol is oxidized at the anode and protons are reduced to hydrogen at the cathode. In a DEFC, ethanol is oxidized at the anode and oxygen is reduced to water at the cathode. The attraction of these technologies arises from their high theoretical efficiencies and the perception that emissions will be low. However, the incomplete oxidation of ethanol at all known catalysts currently results in low efficiency cells and large amounts of byproducts.2
To achieve high energy efficiencies in EECs and DEFCs the faradaic efficiency (ɛF) for the electrochemical oxidation of ethanol to carbon dioxide (Eq. 1) must be high.2,7 However, in practice low yields of CO2 have generally been reported, with the major products being acetaldehyde (Eq. 2) and acetic acid (Eq. 3).
![Equation ([1])](https://content.cld.iop.org/journals/1945-7111/164/7/F861/revision1/d0001.gif)
![Equation ([2])](https://content.cld.iop.org/journals/1945-7111/164/7/F861/revision1/d0002.gif)
![Equation ([3])](https://content.cld.iop.org/journals/1945-7111/164/7/F861/revision1/d0003.gif)
The faradaic efficiency is the ratio of the average number of electrons transferred per molecule of ethanol (nav) to the maximum of 12 for the complete oxidation to CO2 (ɛF = nav/12). It is determined by the product distribution according to Eq. 4,8
![Equation ([4])](https://content.cld.iop.org/journals/1945-7111/164/7/F861/revision1/d0004.gif)
where ni is the number of electrons transferred to form product i and fi is the fraction of ethanol converted to product i. The importance of nav in determining the efficiency of ethanol oxidation technologies makes product analysis of central importance in the development of better anode catalysts.9
Although there have been many advances in the electrochemical performances (voltage efficiency) of ethanol oxidation catalysts,9–12 high faradaic efficiencies remain elusive. Pt alloys with metals such as Ru and Sn can increase the voltage efficiency greatly, but there is generally a decrease in faradaic efficiency.7,9,13,14 In contrast, alloying Pt with Rh increases the faradaic efficiency, but decreases the voltage efficiency.15,16 Currently, one of the best approaches appears to be to combine PtRh alloy nanoparticle catalysts with Sn oxide based support materials.17,18
There have been many mechanistic studies of the oxidation of ethanol in liquid electrolyte cells at ambient temperature,9,11,19 with intermediates and products identified in many cases by infrared spectroscopy and/or differential electrochemical mass spectrometry (DEMS).9,11 In combination with computational studies,20,21 these have provided a good understanding of factors that influence the product distribution at ambient temperature. However, there have been relatively few studies of product distributions for ethanol oxidation at elevated temperatures, in either liquid electrolytes or PEM cells. Sun et al.22 conducted a comprehensive DEMS study of CO2 production at a carbon supported Pt (Pt/C) electrode in aqueous sulfuric acid over a temperature range of 23–100°C. CO2 formation was found to increase with increasing temperature, decreasing ethanol concentration, and decreasing potential between 0.48 and 0.68 V vs. RHE. Measurements of products from PEM-DEFCs have mainly been made by analyzing the anode exhaust solution only,7,13,23–30 which provides inaccurate results due to crossover of products to the cathode, and chemical oxidation of ethanol by the oxygen supplied to the cathode.26,31 The latter problem can be avoided by using nitrogen and/or hydrogen at the cathode,31 while the loss of products by crossover can be addressed by analysis of the cathode exhaust.30,31 However, these methods have only been applied simultaneously in one study.32 In that work, the effects of crossover were quantified and various methods for determining nav at a Pt black anode were assessed.
The purpose of the work described here was to investigate and compare the potential dependences of product distributions and nav for ethanol oxidation at commercial carbon supported Pt, PtRu and PtSn catalysts at 80°C in a PEM electrolysis cell. Proton nuclear magnetic resonance (1H-NMR) spectroscopy was used to measure the concentrations of acetaldehyde, acetic acid and residual ethanol exiting the cell, while CO2 was analyzed with a commercial non-dispersive infra-red (NDIR) detector.32 The accuracy of the nav values obtained by product analysis has been verified by comparison with the amount of ethanol consumed.
This is only the second study in which errors due to both crossover and the chemical oxidation of ethanol have been avoided.32 It provides the first accurate determination of product yields and stoichiometry for ethanol oxidation at carbon supported and alloy catalysts, and the first comparison of efficiencies between different catalysts.
Experimental
The cell
A commercial fuel cell (5 cm2 active area; Fuel Cell Technology Inc.) was operated as an electrolysis cell by supplying 0.1 M ethanol (Commercial Alcohols Inc.) solution to the anode at 0.2 or 0.5 mL min−1 with a syringe pump and N2 to the cathode at 35 mL min−1. The cathode acts a dynamic hydrogen electrode (DHE) and provides a relatively stable reference potential. The anode inlet and both outlets of the cell were modified with stainless steel tubing that connected directly to the graphite flow field plates. The flow field channels were sealed with ethyl-2-cyanoacrylate33 in order to minimize absorption of ethanol and reaction products into the graphite plates.31 The cell was operated at 80°C in all experiments.
Anodes were prepared using the following commercial catalysts. The carbon supported Pt catalyst (Pt/C) was HiSPEC 13100, 70% Pt on a high surface area advanced carbon support (Alfa Aesar; Lot# M22A026). The carbon supported PtRu alloy catalyst (PtRu/C) was HiSPEC™ 12100, 50% Pt and 25% Ru on a high surface area advanced carbon support (Alfa Aesar; Lot# P17B047). The carbon supported PtSn alloy catalyst (PtSn/C) was 40% HP PtSn alloy (3:1 atom%) on Vulcan XC-72 (BASF Fuel Cell Inc.; Lot# F0060910). Catalyst suspensions were prepared by sonication of the catalyst (21–39 mg) in ca. 0.2–0.4 mL of a 1:1 mixture of 1-propanol and Nafion solution (Dupont; 5% Nafion) for 3 h at ambient temperature. An appropriate amount of the suspension was spread onto Toray carbon fiber paper (CFP; TGP-H-090) with a spatula to give a metal loading of 3.2 mg cm−2. Cathodes consisted of 4 mg cm−2 Pt black on TGP-H-090.
Membrane and electrode assemblies were prepared by pressing (room temperature; ca. 1.5 MPa) an anode and cathode onto a Nafion 115 membrane in the cell.34 Electrochemical measurements were made under steady state conditions at constant cell potentials using a Hokuto Denko HA-301 potentiostat.
Ethanol and product analysis
The product collection apparatus is shown schematically in Fig. 1. Ethanol and reaction products from the anode and cathode were combined before analysis. Liquids were collected in a trap cooled with a mixture of ice and dry ice, while CO2 remaining in the N2 stream was measured in real time with a commercial non-dispersive infrared CO2 monitor (Telaire 7001).35 The current and CO2 reading were allowed to stabilize, and then averaged over a period of at least 100 s.
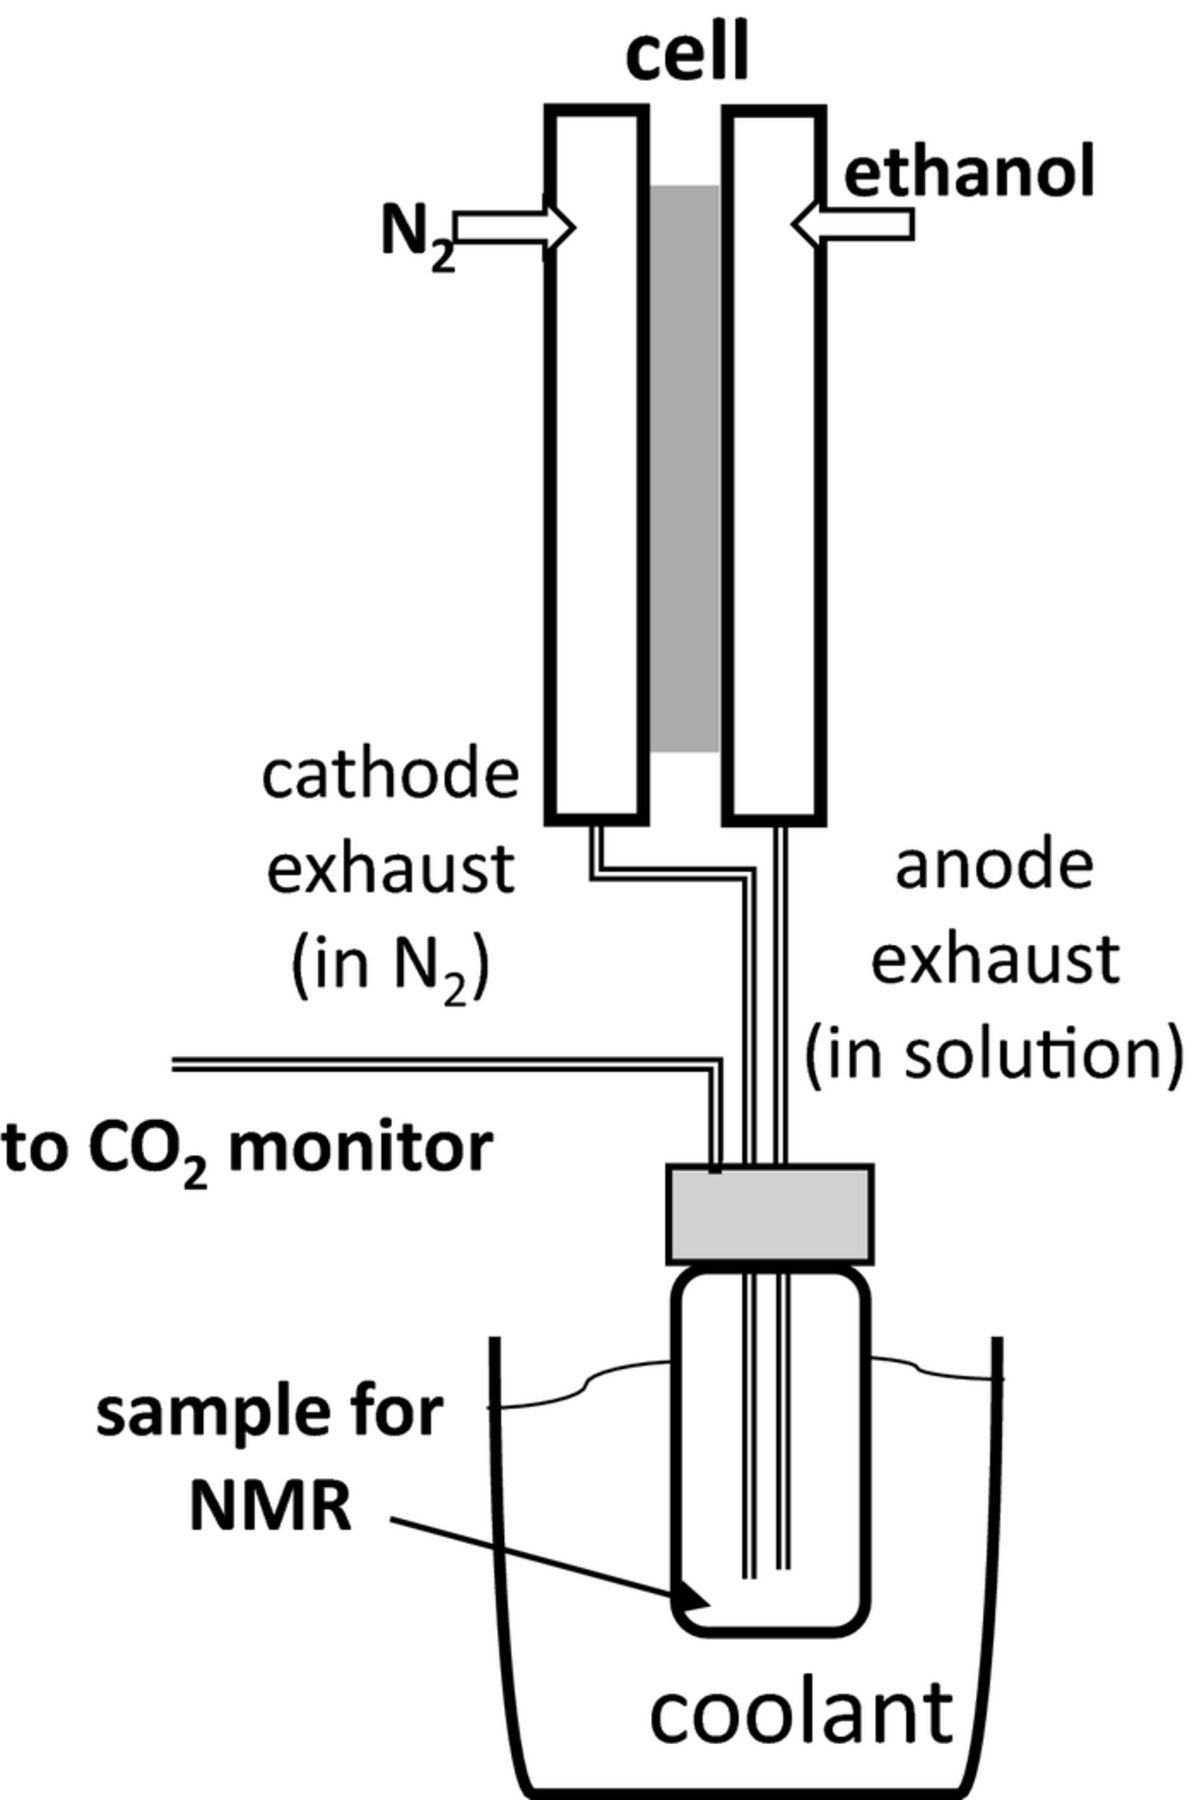
Figure 1. Schematic diagram of the product collection system.
For analysis by 1H-NMR, 400 μL samples collected from the trap were mixed with 100 μL of D2O containing 32 mM fumaric acid as an internal standard, which gives a singlet peak in the spectra at 6.72 ppm.32 Spectra were recorded on a Bruker AVANCE III 300 spectrometer. The D2O in the sample provided the field frequency lock and spectra were referenced to sodium 3-(trimethylsilyl)-2,2,3,3-tetradeuteropropionic propionate at 0 ppm. The residual ethanol concentration was determined from the triplet at 1.10 ppm. The only products detected in the exhaust solution were acetic acid (singlet at 2.01 ppm) and acetaldehyde (doublet at 2.15 ppm). Acetaldehyde forms a dimer under the conditions of these experiments,36 as indicated by a doublet at 1.24 ppm, and so the integral of the 1.24 ppm peak was added to give a single acetaldehyde concentration.
Results and Discussion
Polarization curves
Fig. 2 compares polarization curves for the oxidation of 0.1 M ethanol at the Pt/C, PtRu/C, and PtSn/C anodes. As expected from many previous studies,10,12 the current for ethanol oxidation at low potentials was much higher at the PtRu/C anode than the Pt/C anode. However, the current at the PtRu/C anode levelled off at potentials above 0.5 V, while the current at the Pt/C anode increased sharply to a peak at ca. 0.6 V that was approximately double the current at the PtRu/C anode. The plateau in the current at the PtRu/C anode suggests that it became limited by ethanol diffusion through the CFP backing layer, in which case this mass transport limited current (ilim) can be described by Eq. 5.37
![Equation ([5])](https://content.cld.iop.org/journals/1945-7111/164/7/F861/revision1/d0005.gif)
Where A is the area of the electrode, D is the diffusion coefficient, C is the concentration of ethanol, and l is the thickness of the CFP. Since changing the catalyst can only change nav in Eq. 5, the higher currents at the Pt/C anode at potentials ≥ 0.45 V in Fig. 2 suggest that nav was much higher than at the PtRu/C anode over this potential range.

Figure 2. Polarization curves for the oxidation of 0.100 M ethanol (0.5 mL min−1) at Pt/C, PtRu/C, and PtSn/C anodes at 80°C.
The currents at the PtSn/C anode in Fig. 2 were similar to those at the Pt/C anode at potentials below 0.35 V, but lower than those for both the Pt/C and PtRu/C anodes at higher potentials. The relatively poor performance of this electrode may be due to the lower loading of metal on the carbon support (40% vs. 70% and 75% for Pt/C and PtRu/C, respectively). The lower limiting current relative to the PtRu/C anode may indicate a lower nav or may be due to an additional diffusion limitation in the catalyst layer, which was thicker because of the larger amount of carbon support. The PtSn/C catalyst employed here is same type as the PtSn3/C catalysts from E-TEK employed and characterized by several other groups.38 The 20% PtSn3/C catalyst has been shown to be superior to 20% Pt/C from E-TEK for ethanol oxidation in a DEFC.39 However, it is clearly inferior to the more advanced Johnson Matthey Pt/C and Pt/Ru/C catalysts from Alfa Aesar. The lower masses of Pt in the PtSn/C and PtRu/C anodes relative to the Pt/C anode was not a significant factor here, since the loading of the Pt/C catalyst could be decreased to match their Pt masses without a significant decrease in performance.
Stoichiometry (nav) from the consumption of ethanol and product yields
If it is assumed that there were no losses of ethanol from the cell or during collection of the liquids from the combined anode (liquid + CO2) and cathode (N2 + CO2 + condensed liquids) exhausts, nav can be obtained directly from the concentration of ethanol in the exhaust liquid (Cout) by using Eq. 6:
![Equation ([6])](https://content.cld.iop.org/journals/1945-7111/164/7/F861/revision1/d0006.gif)
where i is the average current, and u and Cin are the flow rate and concentration, respectively, of the ethanol solution entering the cell. In these experiments 3.2% to 65.8% of the ethanol entering the cell was consumed electrochemically. Results for ethanol oxidation at the Pt/C, PtRu/C, and PtSn/C anodes are plotted as a function of potential in Fig. 3, together with values calculated from the product yields by using Eq. 4. The two methods gave similar values, with small differences that can be attributed to experimental uncertainty.
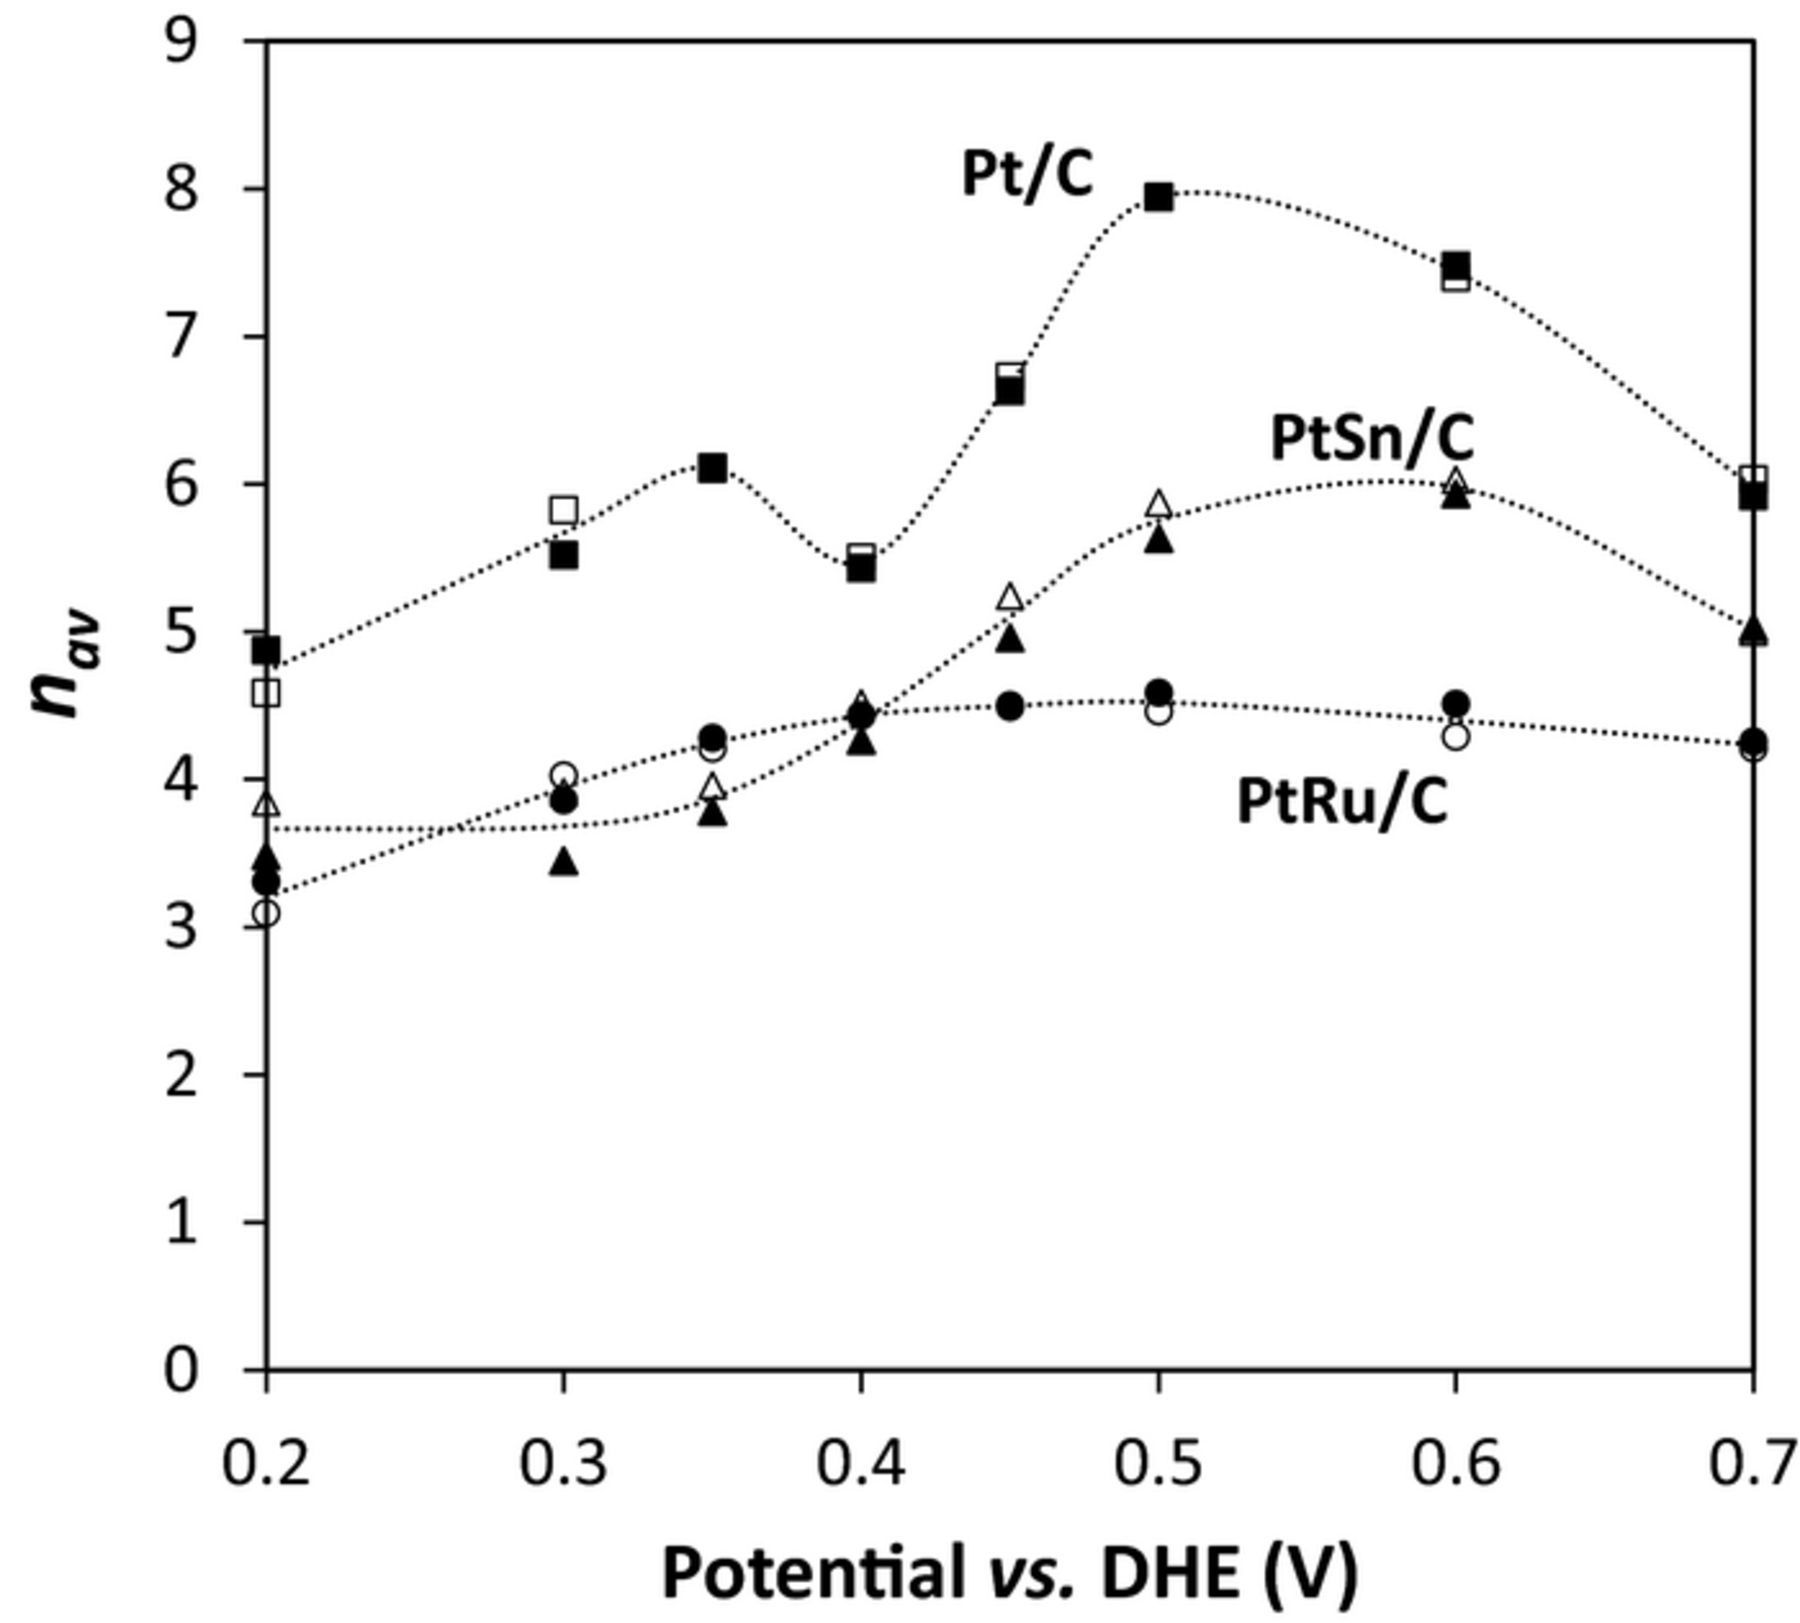
Figure 3. nav vs. potential for the oxidation of 0.100 M ethanol (0.2 mL min−1) at Pt/C, PtRu/C, and PtSn/C anodes at 80°C. Solid points were calculated from the CO2, acetic acid, and acetaldehyde yields by using Eq. 4. Open points were calculated from the ethanol consumed by using Eq. 6. Lines are drawn though the averages of the values from Eqs. 4 and 6.
It can be seen from the data in Fig. 3 that nav was much higher at the Pt/C anode than at the PtRu/C and PtSn/C anodes. The maximum nav was 7.9 at 0.5 V, while values of 5.8 and 4.5 were obtained for PtSn/C and PtRu/C at this potential. These differences are consistent with the higher yields of CO2 that have generally been reported for ethanol oxidation at Pt relative to PtRu and PtSn.7,13,35
Interestingly, the potential dependences were significantly different for the three catalysts. Whereas nav varied over only a narrow range at PtRu/C, from 3.2 to 4.5, PtSn/C gave a significant peak at ca. 0.55 V, while there were two peaks for Pt/C. The peak at 0.5 V for Pt/C can be attributed to CO2 production via the oxidation of adsorbed CO (COads),40–42 while the peak of nav = 6.1 at 0.35 V suggests that there may be a pathway to CO2 that does not involve COads as an intermediate.
Product distributions
Although nav is the key parameter that determines the fuel efficiency of a DEFC or EEC, accurate determination of the product distribution is also very important. In addition to verifying the accuracy of nav values obtained from Eq. 6, it provides crucial information for analysis of the reaction kinetics, and the quantities of byproducts produced by the cell. Since acetaldehyde is an intermediate that can be recycled through the cell, whereas acetic acid is a terminal product, knowledge of their ratio is necessary to determine the overall system efficiency, and the final amount of acetic acid produced.
Fig. 4 shows faradaic yields of CO2 vs. potential for the three different anodes. These results parallel the nav data in Fig. 3 because changes in nav are dominated by changes in the production of CO2, due to the higher number of electrons transferred. However, the faradaic yields exaggerates the amount of CO2 produced for the same reason. They are shown here to allow comparisons with literature reports, where faradaic yields have normally been presented.
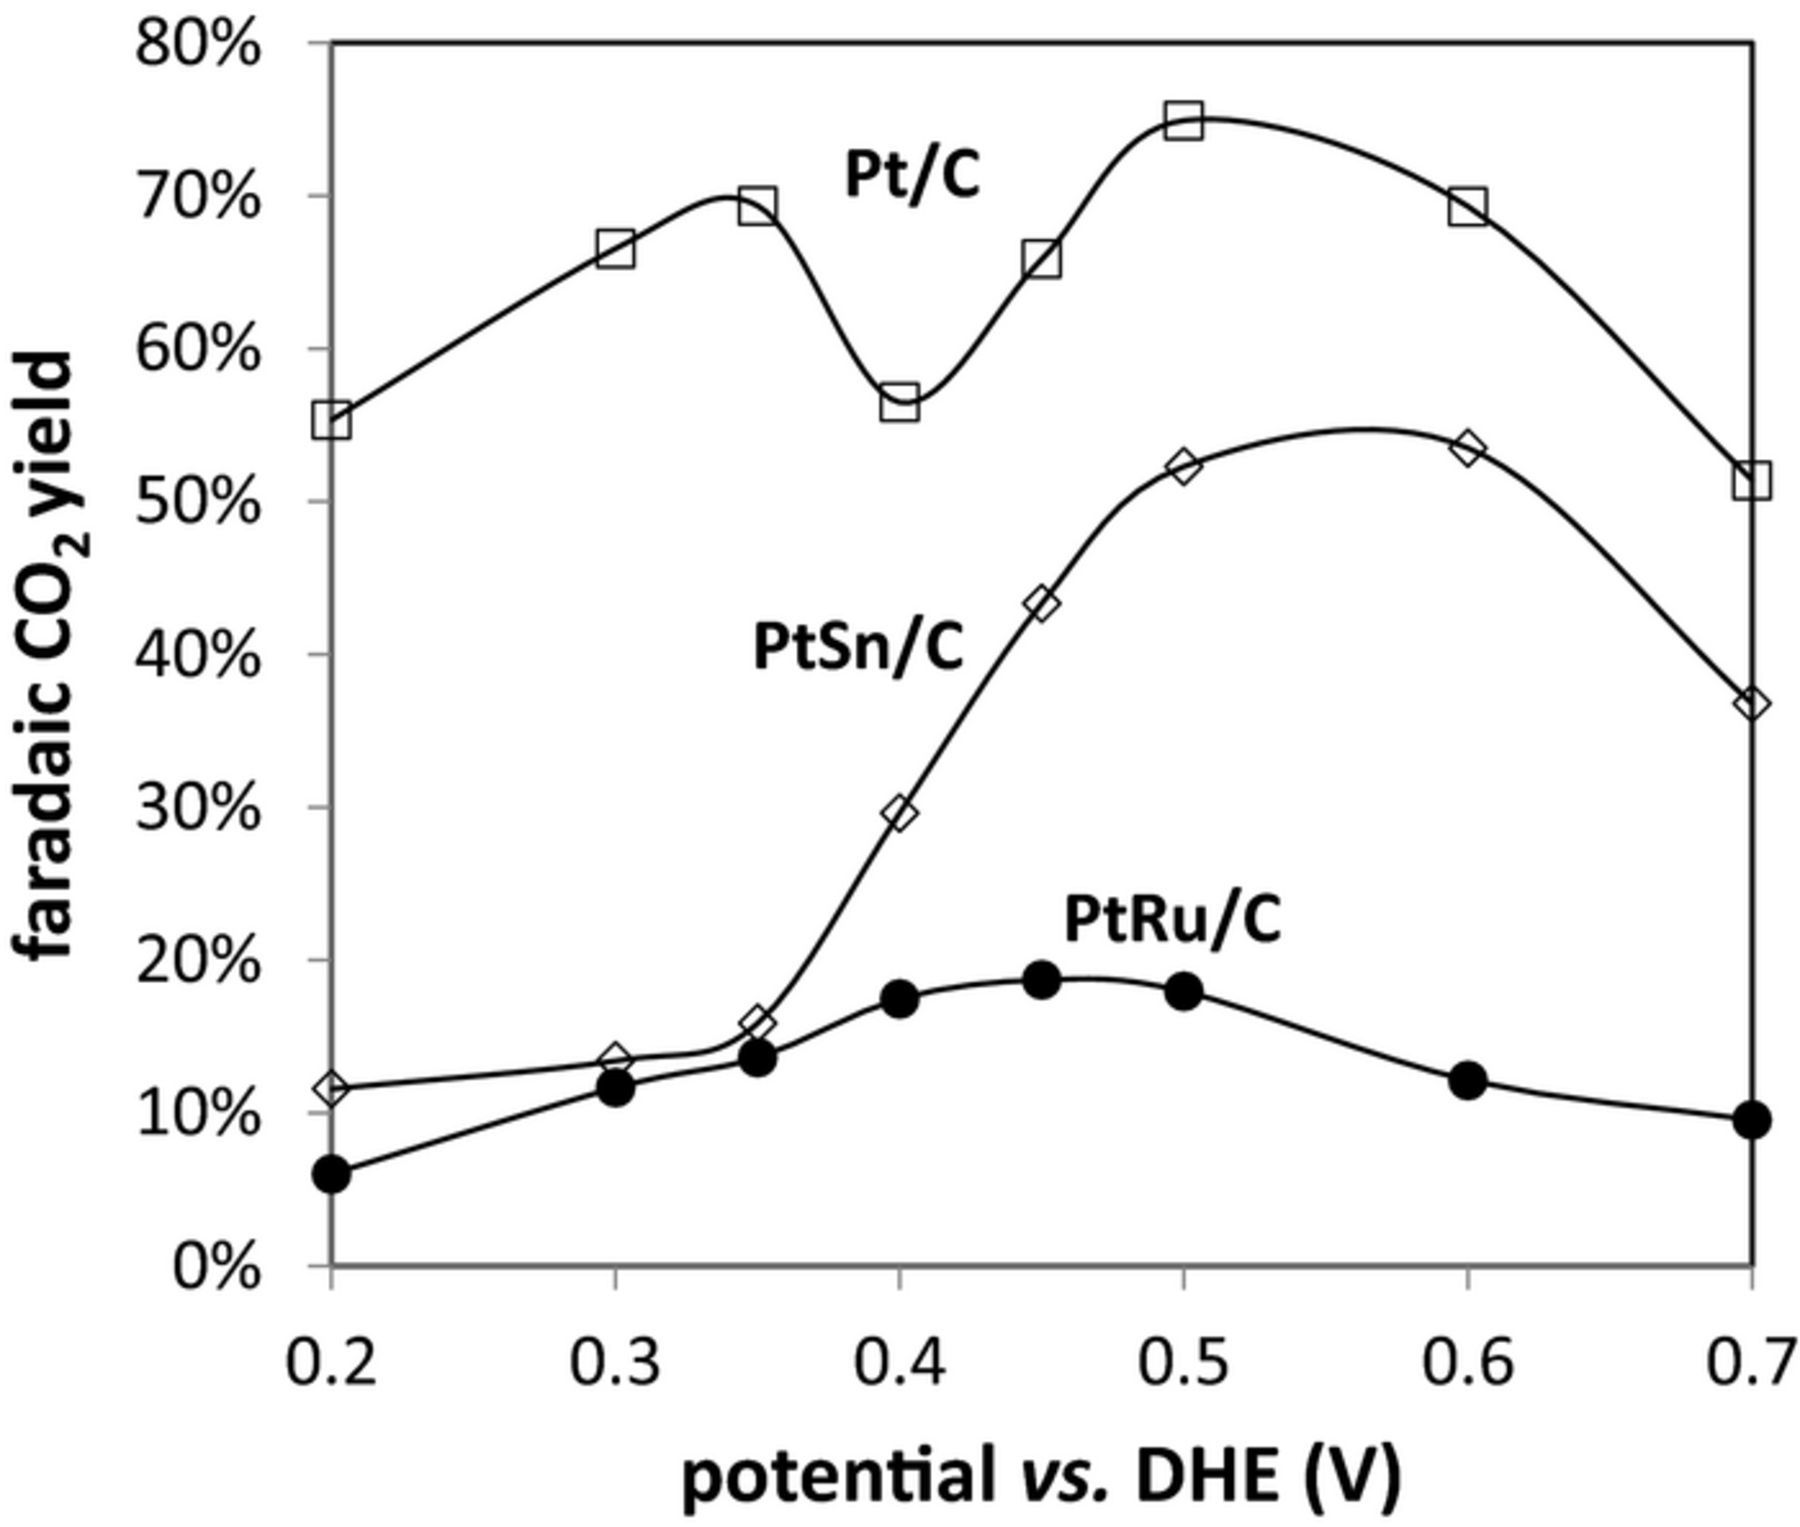
Figure 4. Faradiac yields of CO2 vs. potential for oxidation of 0.100 M ethanol at Pt/C (□), PtRu/C (●), and PtSn/C (◊) anodes at 80°C.
Fig. 5 shows chemical yields of CO2, acetic acid, and acetaldehyde as a function of potential. These are based only on the measured quantities of these three products, and have been calculated by using Eq. 7:
![Equation ([7])](https://content.cld.iop.org/journals/1945-7111/164/7/F861/revision1/d0007.gif)
where Ni is the number of moles of ethanol required to produce the amount of product i measured in the exhaust from the cell. The measured amount of ethanol consumed by the cell was not used here in order to minimize the uncertainty, and to obtain yields that would produce independent values of nav when used in Eq. 4. However, it should be noted that the amount of ethanol required to form the measured products agreed very well with the measured decrease in ethanol concentration. The sum of ethanol plus products exiting the cell was 99.3 ± 1.1% of the ethanol entering the cell averaged over the three data sets. This indicates that there was not a significant loss of ethanol or products, and that no other products were formed in significant (>1%) quantities. This is an important result because it means that NMR analysis alone can provide the product distribution, with the yield of CO2 calculated from the mass balance. Other minor products that have been reported include ethyl acetate,23,28 ethane,40 methane,40 ethane-1,1-diol,28 and ethoxyhydroxyethane.28 None of these products were detected in this work.
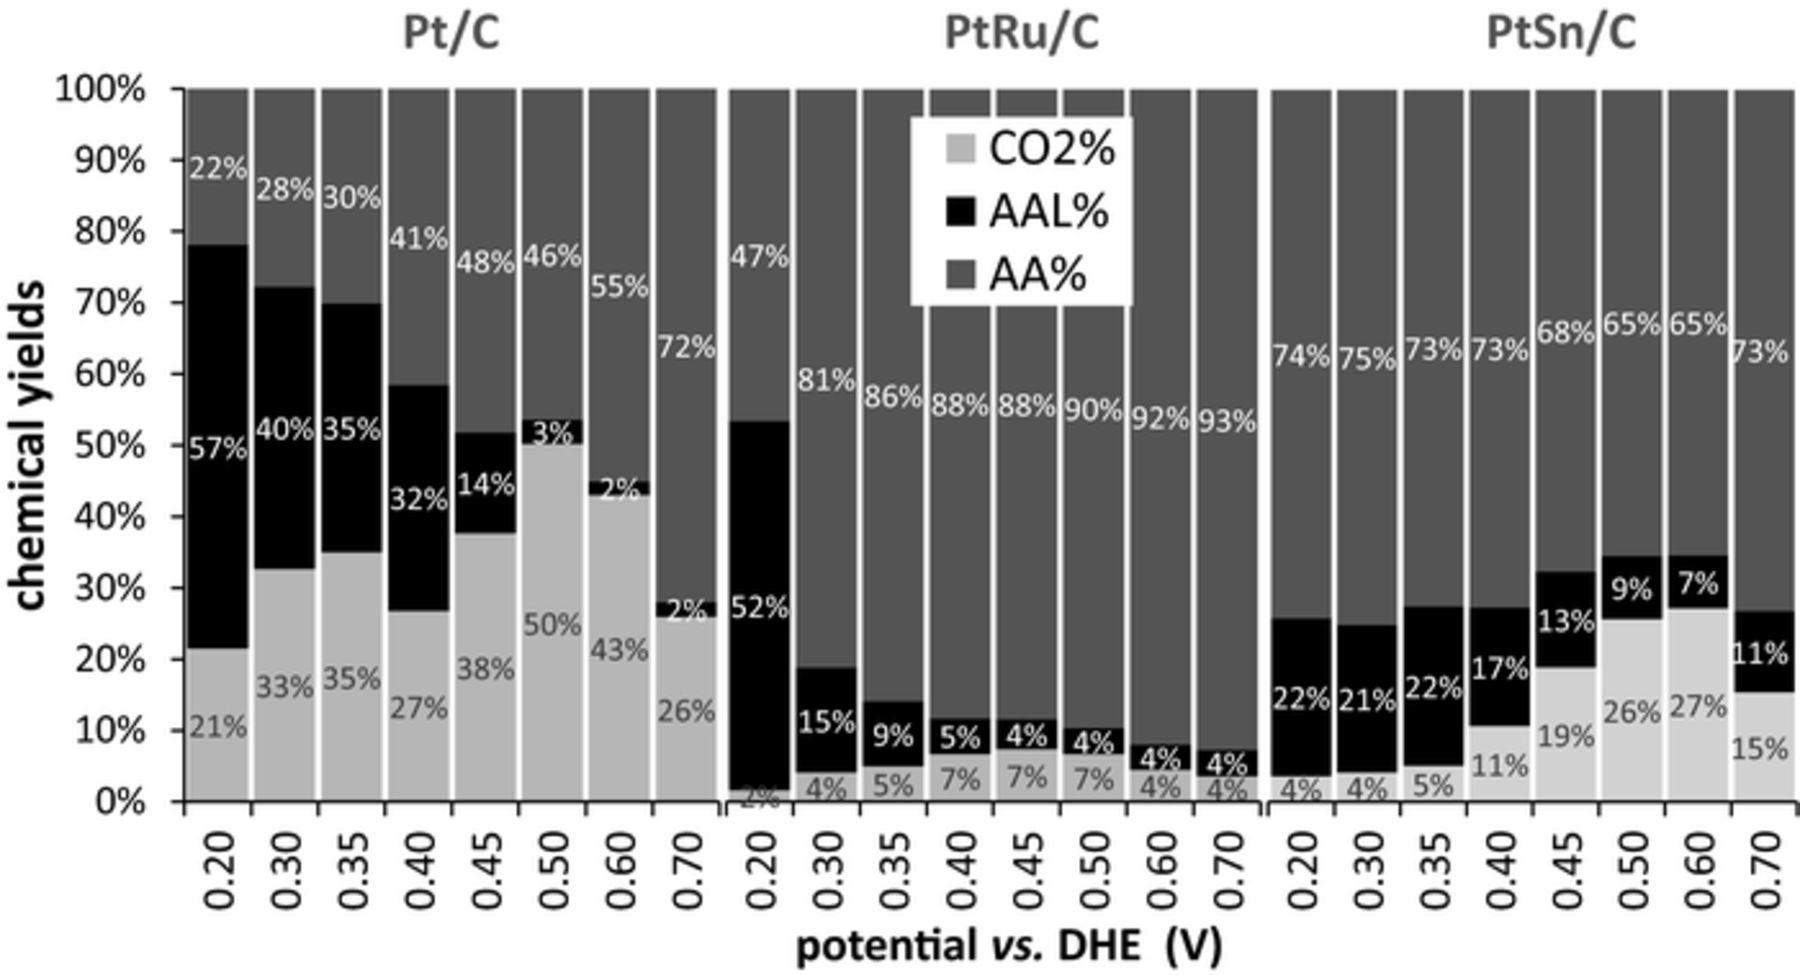
Figure 5. Chemical yields of CO2, acetic acid, and acetaldehyde as a function of potential for oxidation of 0.100 M ethanol at Pt/C, PtRu/C, and PtSn/C anodes at 80°C.
It can be seen from the data in Fig. 5 that the highest chemical yields of CO2 were 50% for Pt/C at 0.5 V, 7% for PtRu/C at 0.45 V, and 27% for PtSn/C at 0.6 V. At lower potentials, which are necessary for the voltage efficiency to be reasonable, the CO2 yield remained substantial for Pt/C but dropped to very low values (≤5% for potentials of ≤0.35 V) for PtRu/C and PtSn/C. At low potentials, Pt/C also gave high yields of acetaldehyde, which can be further oxidized to CO2 and acetic acid if recycled and thereby increase the overall faradaic efficiency.
PtRu/C provided high selectivity for the oxidation of ethanol to acetic acid, which can be attractive for production of H2 from ethanol electrolysis because acetic acid is an important commodity.2 At low potentials, large amounts of acetaldehyde were also produced. PtSn/C also produced predominantly acetic acid, but the sample used here did not produce high enough currents at low potentials to be useful. The Pt/C catalyst was superior for faradaic efficiency, while the PtRu/C provided better voltage efficiency and better efficiency for acetic acid production.
Comparative product distributions from the literature have previously been tabulated and reviewed.9,32 Many new catalysts that show improved activities and/or selectivity for the complete oxidation of ethanol at ambient temperature in liquid electrolytes have been developed.9,11 However, we are not aware of any reports of product distributions for ethanol oxidation at elevated temperature or in polymer electrolyte cells for these advanced catalysts.
Efficiencies
Ethanol electrolysis cell
The energy efficiency for production of hydrogen from the electrolysis of ethanol involves a number of factors, including the electrical energy required for the electrolysis and the various losses from incomplete oxidation of the ethanol and crossover to the cathode.5 However, in theory all of the residual ethanol and products can be collected without a significant loss of energy. Consequently, only the electrical energy input and the energy density of the ethanol (8.0 kWh kg−1) will be considered here.
The electrical energy consumed (We) is given by Eq. 8,5
![Equation ([8])](https://content.cld.iop.org/journals/1945-7111/164/7/F861/revision1/d0008.gif)
where Ecell is the applied cell potential, the energy density of the hydrogen produced is 33 kWh kg−1 and the thermodynamic potential for electrolysis of water is 1.23 V. Consequently the energy consumed is proportional to the cell potentials vs. DHE in Fig. 2. The PtRu/C anode therefore produced the highest electrical efficiency at currents up to ca. 100 mA while the Pt/C anode was more efficient at higher currents and could produce hydrogen at higher rates. Pt/C provides the added advantages of lower ethanol consumption and lower amounts of byproducts that would need to be utilized to maintain the overall efficiency of the system. At 0.5 V and 35 mA cm−2 the cell with the Pt/C anode consumed ca. 13 kWh kg−1 of electrical energy to provide hydrogen with an energy density of 33 kWh kg−1. Based on the measured nav of 7.94, this would require ca. 5.8 kg of ethanol per kg of hydrogen, corresponding to 46 kWh kg−1 of chemical energy. The total energy input was therefore ca. 59 kWh kg−1 with concurrent production of ca. 3.5 kg of acetic acid. Electrolysis of water typically requires 50 kWh kg−1, making this a potentially attractive technology for co-production of hydrogen and acetic acid, if the current density can be increased to be competitive with the ca. 1 A cm−2 level currently used for water electrolysis.5
Direct ethanol fuel cell
Since nav cannot be accurately determined in a DEFC because of the chemical reaction of ethanol with oxygen, values from ethanol electrolysis (Fig. 3) are used here to estimate the efficiencies of DEFCs. This, for the first time, allows catalysts to be compared based on the overall efficiency that they will provide. If the loss of ethanol due to crossover is neglected for simplicity, the overall efficiency of a DEFC (ɛDEFC) can be calculated by using Eq. 9:
![Equation ([9])](https://content.cld.iop.org/journals/1945-7111/164/7/F861/revision1/d0009.gif)
where ɛrev is the theoretical efficiency of 96% at 80°C, ɛE is the potential efficiency (ɛE = Ecell/Erev, where Erev is the reversible cell potential of ca. 1.15 V), and ɛF = nav/12. The potential efficiency includes losses due to the anode (ηanode) and cathode (ηcathode) overpotentials as well as the ohmic resistance of the cell (R) (Eq. 10).
![Equation ([10])](https://content.cld.iop.org/journals/1945-7111/164/7/F861/revision1/d0010.gif)
If it is assumed that the overpotential of the DHE cathode was negligible, (ηanode + iR) is given approximately by the difference between the cell potential in Fig. 2 and the standard potential of +0.084 V for Reaction 1. In order to assess the effects that the different anodes would have on the efficiency of a DEFC through Equations 9 and 10, values of ηcathode were modelled by fitting a representative43 iR corrected cathode polarization curve to a Tafel relationship (Eq. 11), with b = 47 mV (the low value can be attributed to ethanol crossover44) and a current of 1 mA at 0.81 V vs. DHE.
![Equation ([11])](https://content.cld.iop.org/journals/1945-7111/164/7/F861/revision1/d0011.gif)
The average nav at each potential in Fig. 3 was used to calculate ɛF. Fig. 6 shows the calculated DEFC efficiencies as a function of the current density.
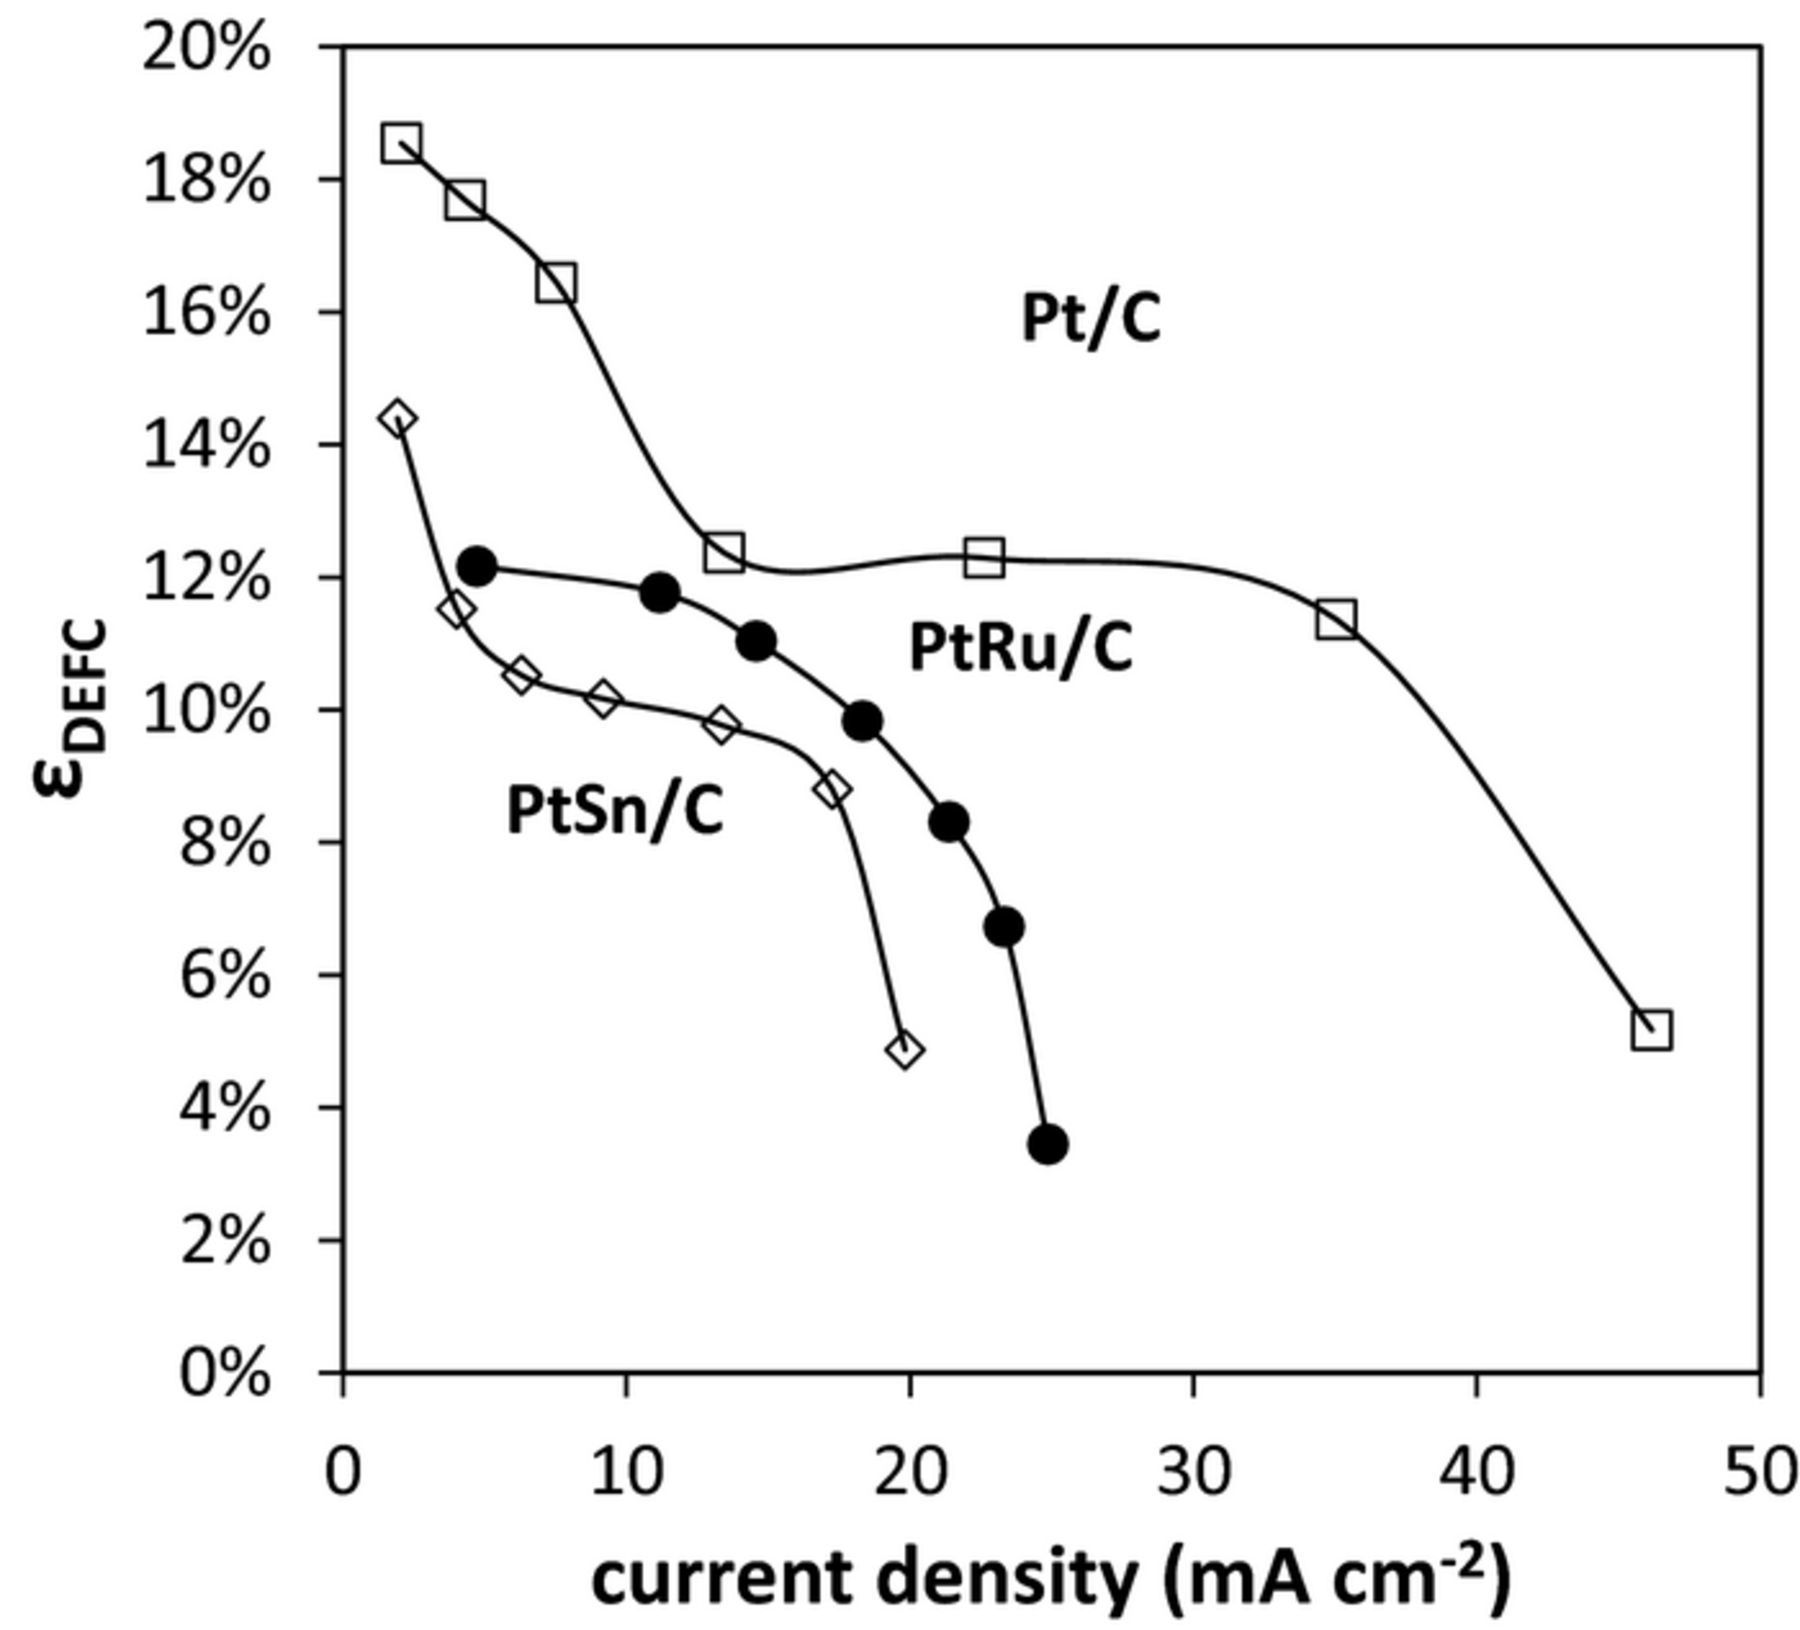
Figure 6. Predicted efficiency vs. current density for DEFCs operating at 80°C with 0.1 M ethanol at 0.5 mL min−1 with Pt/C (□), PtRu/C (●) and PtSn/C (◊) anodes.
It can be seen from the data in Fig. 6 that the highest efficiency for a DEFC would have been obtained with the Pt/C anode over the whole current range. The PtSn/C anode would give the lowest efficiency at all currents, while PtRu/C would give slightly higher efficiencies and somewhat higher current densities. These results highlight the importance of developing catalysts with high selectivity for the oxidation of ethanol to CO2, since this is the dominant factor influencing DEFC efficiency.
It should be noted that the comparison of efficiencies calculated using Eq. 10 depends on the cathode overpotentials employed. If the cathode overpotentials are higher, the PtRu/C anode can provide the highest overall efficiency in the intermediate current region, but the efficiencies with all anodes would be lower than shown in Fig. 6. It should also be noted that the PtSn/C catalyst employed here had a significantly lower Pt loading than the Pt/C and PtRu/catalysts, which were also newer and more advanced. Consequently, the comparison of its efficiency with these state of the art catalysts does not accurately reflect the potential for advanced PtSn/C catalysts to contribute to DEFC and EEC technologies.
Conclusions
Proton NMR spectroscopy provides a simple, reliable, and accurate method for determining the stoichiometry, efficiency, and product distribution for ethanol electrolysis in fuel cell hardware. It is essential that the exhausts from both the anode and cathode are collected and analyzed because of the crossover of ethanol and all products through the membrane. However, the two exhausts can be combined for analysis unless knowledge of the extent of crossover is required. The combination of ethanol consumed and the quantities of acetic acid and acetaldehyde produced provide the necessary information without the need for analysis of the CO2 produced, since the yield of CO2 can be obtained from the mass balance.
The results for the commercial Pt/C, PtRu/C, and PtSn/C catalysts investigated here show that Pt/C would provide the highest efficiency for a fuel cell and for an electrolysis cell at high current densities, due to the higher stoichiometry of the ethanol oxidation reaction. However, PtRu/C provides better electrolysis efficiency than Pt/C at low current densities due to the lower overpotentials required. Also, PtRu/C will be the preferred catalyst if the acetic acid produced can be valorized.
Acknowledgments
This work was supported by the Natural Sciences and Engineering Research Council of Canada and Memorial University.