
Abstract
The performance of hydrogen fuel cells based on the crystalline solid proton conductor CsH2PO4 is circumscribed by the mass activity of platinum oxygen reduction catalysts in the cathode. Here we report on the first application of an alloy catalyst in a solid acid fuel cell, and demonstrate a mass activity 4.5 times greater than Pt at 0.8 V. This activity enhancement was obtained with platinum-palladium alloys that were vapor-deposited directly on CsH2PO4 at 210 °C. Catalyst mass activity peaks at a composition of 84 at% Pd, though smaller activity enhancements are observed for catalyst compositions exceeding 50 at% Pd. Prior to fuel cell testing, Pd-rich catalysts display lattice parameter expansions of up to 2% due to the presence of interstitial carbon. After fuel cell testing, a Pt-Pd solid solution absent of lattice dilatation and depleted in carbon is recovered. The structural evolution of the catalysts is correlated with catalyst de-activation.
Export citation and abstract BibTeX RIS
The oxygen reduction reaction (ORR) has proven to be an enduring obstacle to the development of highly efficient, low cost fuel cell systems. Fuel cells must sacrifice hundreds of millivolts of electric potential to reach operational current densities due to the kinetic barriers imposed by oxygen activation. The effects of ORR overpotentials are acutely felt by solid acid fuel cells (SAFCs) based on the superprotonic electrolyte CsH2PO4 (CDP).1 Though SAFCs are a promising anhydrous, intermediate temperature2 (235 °C – 265 °C) system with a high tolerance to fuel impurities,3 the adoption of SAFCs has been hampered by the limited mass activity of the platinum catalyst in the membrane electrode assembly (MEA).
While both the hydrogen oxidation reaction (HOR) on the anode and the ORR on the cathode currently rely on platinum catalysts, the HOR is considerably more facile. Recent work has shown promise for reducing anode loadings below 0.3 mg cm − 2, either via electrosprayed nanostructures4 or a thin-film approach,5 while the cathode has proven to be more intransigent.
A method for increasing ORR activity while simultaneously reducing Pt content that has been successfully implemented in other fuel cell systems is based on the use of Pt alloy catalysts. Supported catalysts first demonstrated in the phosphoric acid system6 alloyed Cr, Co, and V with Pt and displayed mass activities nearly 2.5 times that of pure Pt at 0.9 V. Since then, investigations of Pt alloys have proliferated, especially in the field of polymer electrolyte membrane fuel cells (PEMFCs).7,8 In addition to binary and ternary solid solutions, investigators have also recently reported intentionally surface-segregated core-shell catalysts9 and dealloyed catalysts10,11 that are even more active. A fundamental understanding of the enhanced ORR activity of alloy catalysts in acidic media is emerging, and it is apparent that lattice strains and ligand effects induced by alloying influence d-band center shifts and modify reactant binding affinity.12
Palladium is an attractive candidate for application of the alloy catalyst concept to SAFCs. Pt-Pd catalysts13 have shown enhanced ORR activity as alloyed nanoparticles14 and as core-shell nanoparticles.15,16 Other Pt-Pd nanostructures have also displayed activity enhancements, including nanotubes,17 nanowires,18 and nanodendrites.19 Palladium is amenable to deposition from metallorganic precursors and has a similar coordination chemistry to platinum, suggesting a compatibility with the vapor-phase deposition methods we reported previously.20 Mixed Pt and Pd acetylacetonate precursors have been used for catalyst synthesis via impregnation and calcination21 and have also been used to grow alloy thin films via metallorganic chemical vapor deposition.22
In this contribution, we address the synthesis and characterization of Pt-Pd nanoparticles supported on micron-scale CsH2PO4 particles for use as both the ORR catalyst and the electronic phase in SAFC cathodes. A range of Pt-Pd compositions were synthesized and tested in SAFCs operated on H2/air at 250 °C. The chemistry and structure of the catalysts and their evolution under fuel cell operation is analyzed, and the implications of the results for the design of SAFC alloy catalysts are discussed.
Experimental
Powders of fine-grained CsH2PO4 (CDP) with a BET surface area of 2.1 m2/g were synthesized according to published methods.20 A set of ten 3.7 mL glass shell vials were each filled with 300 mg of CDP. To these vials were added dry mixtures of solid Pt(acac)2 (Alfa Aesar, Pt 48% min) and Pd(acac)2 (Acros Organics, Pd 35%) in amounts appropriate to obtain a total metal content of 75 mg (20 wt% metal on CDP) and with a Pt:Pd ratio varying from 100% Pt to 100% Pd in steps of roughly 10 at%. Gentle shaking was used to mix the CDP and Pt and Pd precursors in each vial. Metal deposition on CDP proceeded at 210 °C in a N2/water vapor atmosphere via a protocol identical to the procedure reported previously.20 At the conclusion of the deposition procedure the powders were weighed and then passed through a stainless steel screen with 53 μm wire separation to homogenize the particulates.
Samples of each resultant powder were reserved for analysis. The morphology of the as-synthesized powders were characterized by high resolution scanning electron microscopy (SEM). The resultant Pt-Pd nanoparticles were isolated by dissolution of CDP in deionized water and copious washing of the recovered solids. The chemical composition of the obtained nanoparticles was analyzed by energy dispersive spectrometry (EDS) and combustion analysis. Structural parameters were obtained by X-ray diffraction (XRD). Selected samples were analyzed by X-ray photoelectron spectroscopy (XPS).
High-resolution SEM imaging was performed with a LEO 1525 FESEM at an accelerating voltage of 3 kV using the in-lens electron detector. Imaging of electrodes and chemical analysis was conducted with a Hitachi TM3000 SEM equipped with a Bruker Quantax EDS system operating at 15 kV.
X-ray diffraction patterns were recorded with a Bruker Phaser D2 diffractometer using Ni-filtered Cu Kα radiation (λ = 0.154184 nm, 30 kV, 10 mA, 0.014° step, 0.5 s/step) in the Bragg-Brentano geometry fitted with a 0.6 mm antiscatter slit in the incident beam and a 2.5° Soller slit in the diffracted beam. The position and width of diffraction peaks were obtained by fitting to Voight functions using IGOR Pro (Wavemetrics, Inc.).
X-ray photoelectron spectroscopy data were collected using a PHI 3056 spectrometer with an Al anode source operated at 15 kV and an applied power of 350 W. Samples were drop-cast from a water solution onto diced Si wafers (Ted Pella). The Pt 4f7/2 peak was used to calibrate the binding energy shifts of the sample (Pt 4f7/2 = 71.2 eV). High resolution data was collected at a pass energy of 5.85 eV with 0.05 eV step sizes and a minimum of 200 scans to improve the signal to noise ratio; lower resolution survey scans were collected at a pass energy of 93.5 eV with 0.5 eV step sizes and a minimum of 25 scans.
Electrodes were fabricated by spreading the Pt/Pd:CDP powders over an anode supported half-cell with a total area of 2.85 cm2, a CDP membrane thickness of approximately 80 μm, and a composite anode electrocatalyst layer based on Pt black (HiSpec 1000) similar to those described elsewhere.2 The cathode was formed by compression of the powder at 8 MPa for 3 seconds. The mass of CDP electrolyte in each electrode was kept constant at 50 mg. Carbon paper current collectors (SGL Carbon GmbH) were sealed against each electrode with PTFE tape (McMaster-Carr, part # 4591K11) to complete the fabrication of the SAFC MEA.
Samples were tested in stainless steel test rigs at 250 °C and supplied with an anode reactant flow of 35 sccm of ultrahigh purity H2 and a cathode flow of 70 sccm of either ultrahigh purity air or oxygen. Both reactant streams were hydrated to a dew point of 75 °C. Polarization curves were recorded at 30 minute intervals with a Bio-Logic SP200 or VSP potentiostat by scanning at 2 mV s − 1 from the open circuit potential to 0.4 V. Immediately before and after the polarization measurement, potentiostatic electrochemical impedance spectroscopy (PEIS) spectra were recorded at 0.8 V in a frequency range from 200 kHz to 200 mHz with a single sine perturbation amplitude of 10 mV. Polarization curves free of the ohmic losses due to membrane resistance were derived by the addition of iRΩ, where i is the current and RΩ is the dc resistance of the cell as measured at 0.8 V by PEIS. Cells were held at 0.6 V for each 30 minute interval between electrochemical measurements. After seven hours of cyclical application of this protocol, each cell was held at a constant voltage of 0.6 V for at least 5 more hours, for a minimum of 12 hours of testing. PEIS data were analyzed with the EC-Lab software.
After fuel cell tests, the cathode of each MEA was carefully scraped away from the supporting CDP membrane and washed repeatedly to extract the cathode catalyst for additional chemical and structural analysis by the methods described above. Selected intact MEAs were fractured and examined via SEM for investigation of morphological changes in the electrode and catalyst structure during fuel cell operation.
Results and Discussion
Fuel cell testing and electrochemical characterization
Fuel cell polarization curves (corrected for ohmic losses) for electrodes with selected sample compositions are shown in Figure 1. Electrodes containing Pd-rich catalysts sustain a high cell potential with increasing current density, operating with much greater efficiency than Pt-rich electrodes.
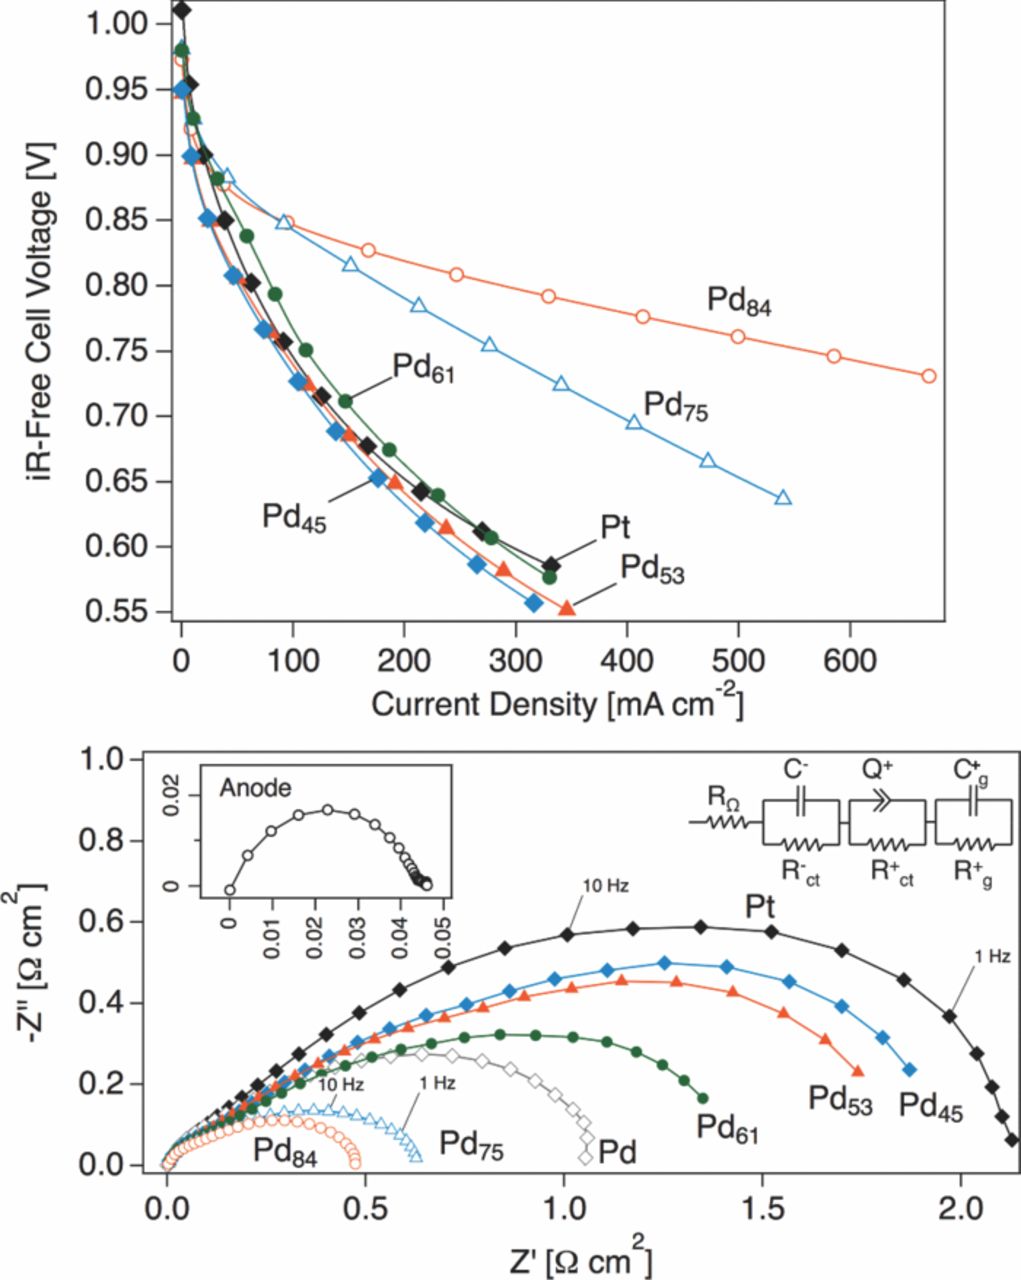
Figure 1. SAFC iR-free polarization curves (upper figure) and EIS spectra (lower figure, markers) acquired at 0.8 V (H2/air, 250 °C, 75 °C dew point) and fits (lower figure, lines) to an equivalent circuit model (lower figure, inset) for selected cathode compositions. The EIS spectra have been corrected for membrane resistance and electrode area. The inset shows the anode response derived from symmetric cell measurements at OCV at 250 °C in H2/H2.
Two metrics were adopted as a quantitative basis for comparing the performance of the experimental cathodes. The first, the mass activity (im), is simply defined by the cell current per mg of catalyst at an iRΩ-corrected cell voltage of 0.8 V. The second, the charge transfer resistance (Rct) is the width of the PEIS arc at a cell voltage of 0.8 V, shown in the lower portion of Figure 1. Empirically, the charge-transfer resistance is the instantaneous slope of the iRΩ-corrected polarization curve, in analogy with Ohm's Law, but instead comprising the non-ohmic loss channels within the electrode. Figure 2 summarizes these metrics for the tested compositions (here, we plot the inverse of Rct, which has the form of a conductance); a full table of results is shown in Table I.
Table I. Parameters from electrochemical testing of SAFC MEAs with Pt/Pd:CDP cathodes, including mass activity at 0.8 V (im(0.8V)), the maximum current density observed at 0.6 V (jmax(0.6V)) and current density at 0.6 V after 12 hours of fuel cell testing (j12h(0.6V)). ASRΩ and ASRct indicate the intitial area specific ohmic and charge transfer resistance, respectively.
| Sample | ASRΩ | ASRct | im(0.8V) | jmax(0.6V) | j12h(0.6V) |
|---|---|---|---|---|---|
| Composition | [Ω cm2] | [Ω cm2] | [mA mg − 1PGM] | [mA cm − 2] | [mA cm − 2] |
| Pd | 0.56 | 1.05 | 29.8 | 255 | - |
| Pd93Pt7 | 0.43 | 0.46 | 60.4 | 422 | 117 |
| Pd84Pt16 | 0.49 | 0.47 | 66.3 | 388 | 194 |
| Pd75Pt25 | 0.44 | 0.63 | 41.7 | 318 | 197 |
| Pd61Pt49 | 0.52 | 1.40 | 18.4 | 168 | 147 |
| Pd53Pt47 | 0.44 | 1.77 | 12.5 | 143 | 133 |
| Pd45Pt55 | 0.50 | 1.91 | 11.8 | 147 | 142 |
| Pd36Pt64 | 0.44 | 2.07 | 10.9 | 145 | 141 |
| Pd23Pt77 | 0.44 | 2.18 | 10.7 | 143 | 135 |
| Pd11Pt89 | 0.43 | 2.06 | 11.9 | 157 | 151 |
| Pt | 0.55 | 2.11 | 14.6 | 153 | 149 |
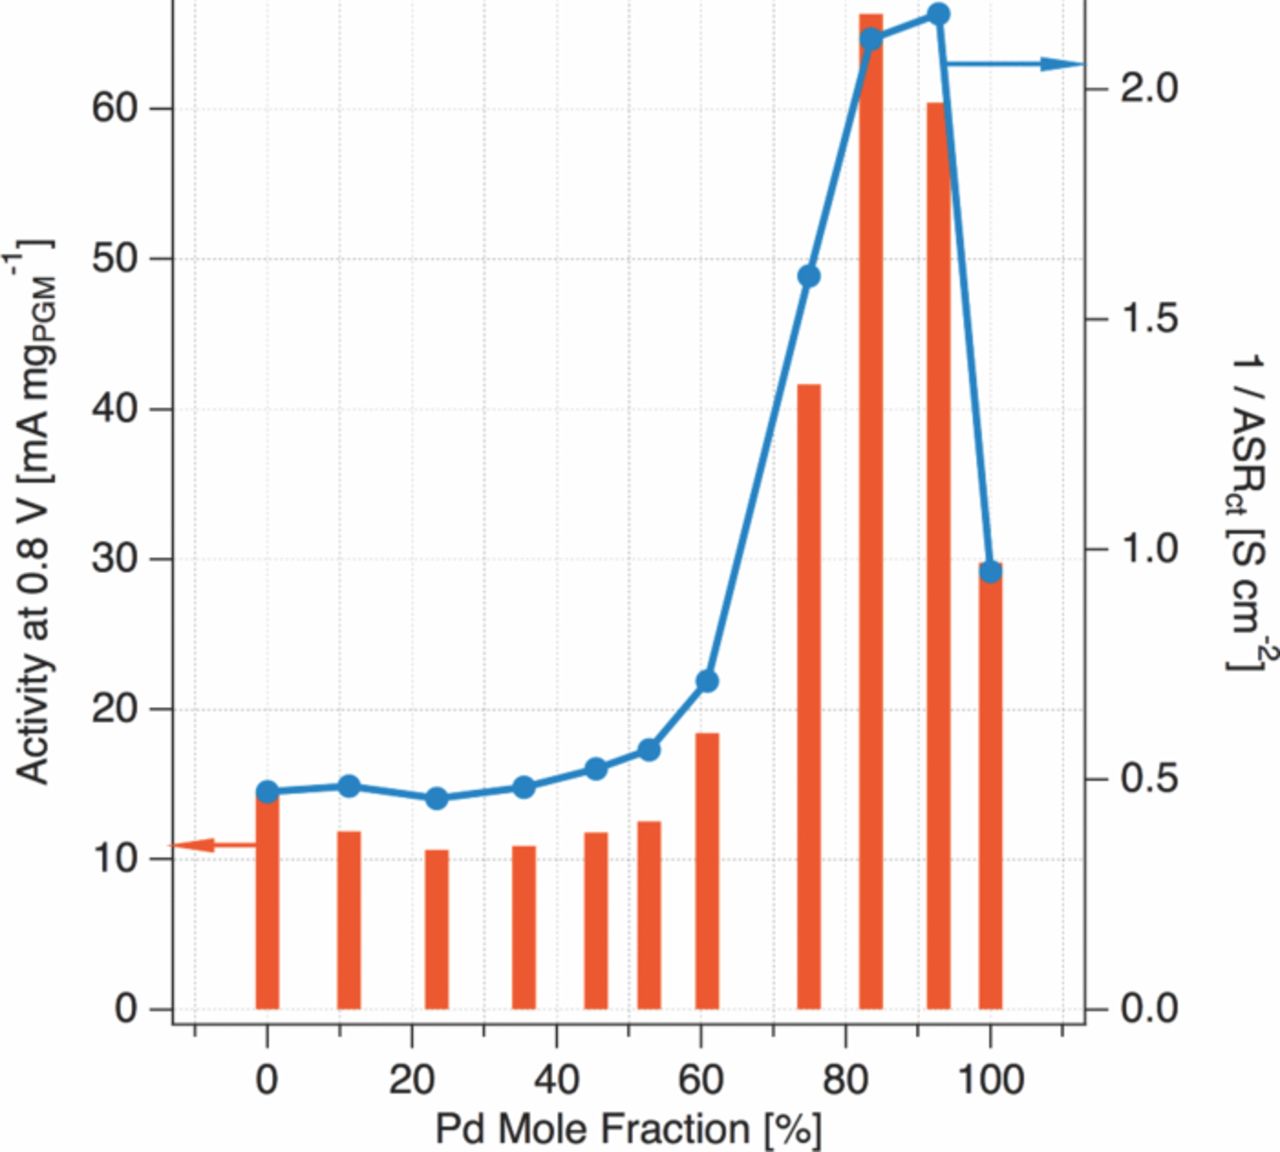
Figure 2. Summary of Pt-Pd SAFC catalyst mass activity at 0.8 V in mA mg − 1PGM from iR-free polarization curves (left axis) and inverse of the electrode area specific charge transfer resistance (right axis).
An equivalent circuit was used to obtain the full charge transfer resistance of the MEA at 0.8 V in cases for which the impedance arc did not intersect the real axis at low freqeuency. The equivalent circuit is shown inset in with the data and fits in Figure 1 below. RΩ was fixed at the intercept of the arc with the real axis, and the parameters R−ct and C−, the charge transfer resistance and capacitance of the anode, respectively, were fixed at the values of obtained for the response of one electrode in an unbiased symmetric cell measurement in H2/H2 at 250 °C (0.03 Ω and 0.002 F, respectively) and 75 °C dew point. In a biased symmetric cell measurement, the total cell impedance at a current density of 175 mA/cm2 was identical to the unbiased impedance, indicating that negligible error is introduced by the subtraction of an unbiased anode response from the full cell impedance. The anode response is shown inset in the lower portion of Figure 1. The charge-transfer process on the cathode is modeled by the resistance R+ct in parallel with a constant phase element Q+. A third circuit element was required to accurately reproduce the low-frequency behavior of the curves; here we used the generalized RC circuit characterized by the variables R+g and C+g. In the low-frequency limit, capacitors approach infinite real impedance and the total charge transfer impedance is the sum of the fitted resistances, less RΩ.
Equivalent circuits are not unique descriptors of electrochemical processes, and there are many possible equivalent circuits that can describe the impedance response observed in SAFCs. For example, a finite-length Warburg diffusion element can be substituted for the RC circuit used with little effect on fit quality. For this reason, we have not assigned a particular process to the third circuit element in the absence of more detailed parametric studies.
We observe that high activity shown by the experimental cathode compositions emerges at a cell potential lower than 0.9 V, and at a relatively high current density. At an iRΩ-corrected cell potential higher than 0.9 V, the Pt control electrode is at least as active as the experimental cathodes. This low-overpotential regime is commonly associated with oxygen activation in low/intermediate temperature fuel cells, and efficiency losses at greater overpotentials are usually attributed to mass-transport losses from reactant diffusion limitations in the porous electrode. Also notable is the depression of the PEIS arcs in Figure 1 below the real axis, a profile characteristic of distributed networks such as within three-dimensional porous electrodes.23
Taken together, these observations prompted an investigation of the gross character of the experimental electrodes with scanning electron microscopy to observe cathode thicknesses and porosity. Representative micrographs of opposite ends of the compositional range are shown in Figure 3. Electrodes with a catalyst composition of Pd11Pt89 are virtually identical to those with a composition of Pd84Pt16, but the latter electrode is nearly 5 times more active at 0.8 V. We observed no structural difference in the MEA-level characteristics of the electrodes tested, and concluded that electrode structure was not a source of the observed activity enhancement.
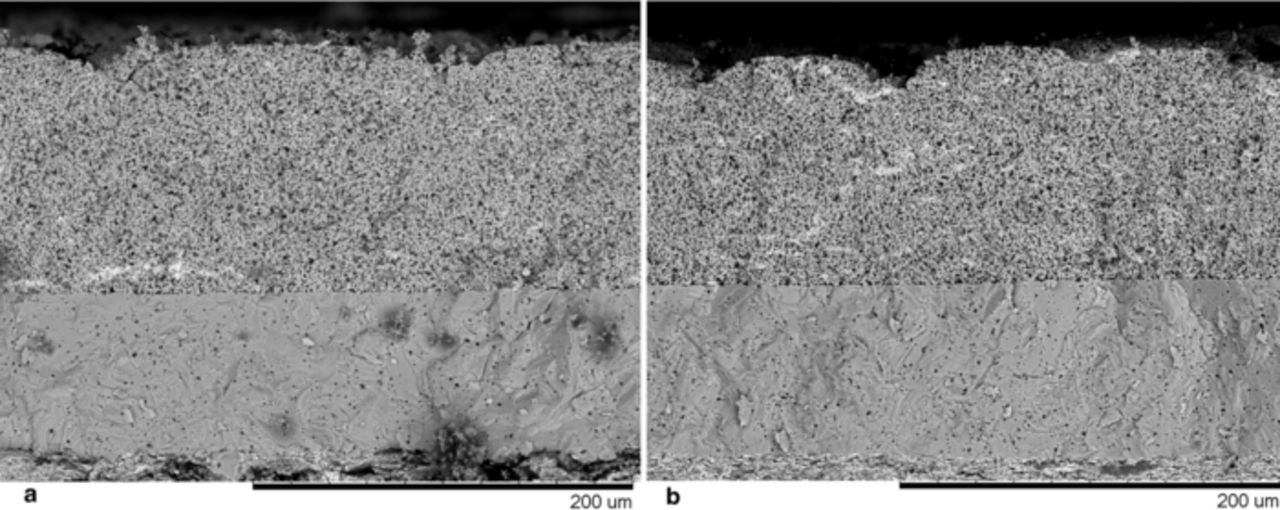
Figure 3. SEM micrograph of SAFC MEAs with cathode compositions of (a) Pd11Pt89 and (b) Pd84Pt16 in cross-section. The cathode is in the upper portion of the figure.
To investigate oxygen concentration effects on the experimental electrodes, the testing protocols summarized in Figure 1 and Table I were repeated on a Pd84Pt16 electrode and a Pt control with cathode feeds of 100% oxygen to a terminal voltage of 0 V. All other parameters were identical to previous tests (250 °C, gases hydrated to 75 °C dew point). Polarization curves are plotted in Tafel form (logarithmic current scale) in Figure 4. Immediately apparent is the lower open circuit voltage of the the Pd-rich cathode, an indicator of a mixed potential due to anodic metal oxidation processes on the electrode, and likely to be enhanced by carbon oxidation. The presence and role of carbon in the electrodes is elaborated upon in later sections. In the case of Pt cathodes, the gain in current density at a given overpotential η is a factor of approximately 2. This gain factor is also reflected in the doubling of the charge-transfer resistance of the Pt electrode after switching from pure oxygen to air. For electrodes with first-order oxygen reduction kinetics, a gain factor of 5 is expected, and lower values have been attributed to ionic transport limitations24 in phosphoric acid and polymer electrolyte membrane fuel cells.25 The existence of these limitations is not surprising for the case of SAFC electrodes, since CDP has a relatively low proton conductivity.26 In comparison with Pt, Pd84Pt16 electrodes show no appreciable oxygen gain until approximately an iR-free voltage of 0.85 V. At a real cell voltage of 0.8 V, air operation results in an increase of charge transfer resistance of less than 20%. The lack of an appreciable oxygen gain in the Pd84Pt16 system is surprising; virtually no change in the rate of oxygen reduction results from a fivefold increase in oxygen concentration.
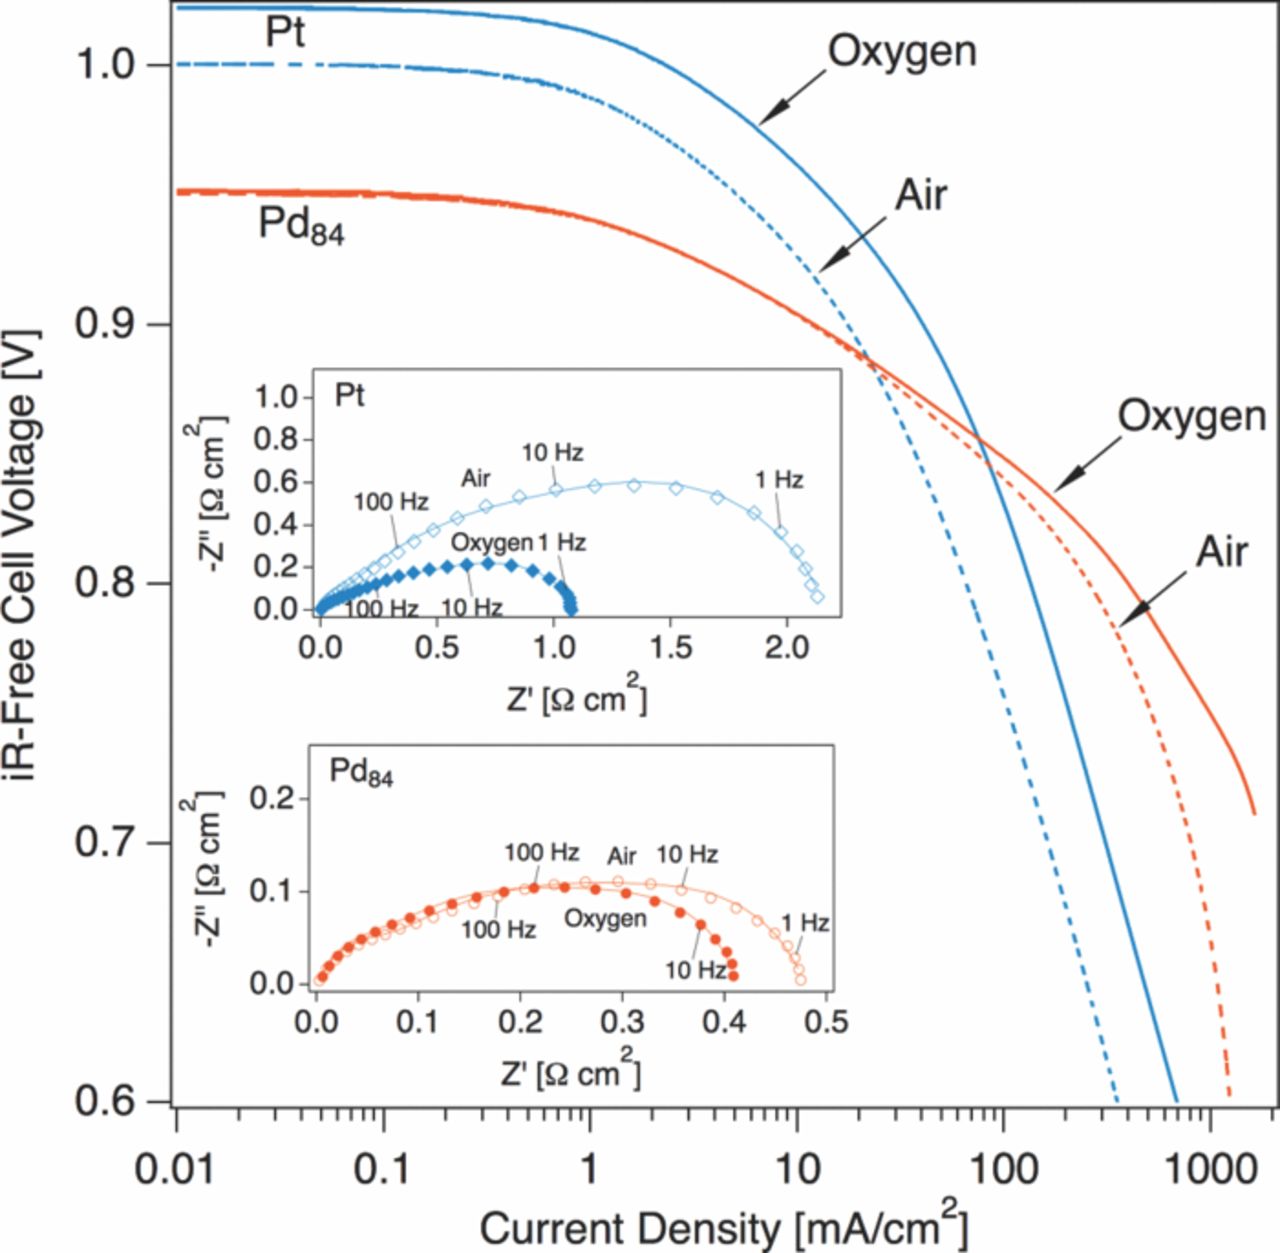
Figure 4. The effect of oxygen concentration on iR-free polarization curves of Pt and Pd84Pt16 electrodes (250 °C, 75 °C dew point). PEIS spectra (inset, markers) were acquired at 0.8 V and fit to an equivalent circuit described in the text (inset, lines). Spectra were corrected for ohmic losses and electrode area.
Reaction rates in electrochemical systems far from equilibrium obey what are known as Tafel kinetics. Both the Pt control and the Pd-rich experimental electrode show Tafel behavior, that is, a linear relationship between cell voltage and the logarithm of the current. From the perspective of classical electrochemistry,27 the appearance of a Tafel slope implies the existence of a rate-limiting electron transfer step at an electrode. While this may be strictly true under ideal conditions, Gottesfeld12 and Adler28 have reviewed scenarios in which the Tafel slope may not be indicative of the intrinsic kinetics of the system. With these admonitions in mind, we can consider the obvious disparity in the Tafelian behavior of the electrodes and the unusual oxygen concentration dependence of Pd84Pt16 shown in Figure 4. Two well-defined linear regions are present in the oxygen-fed curve for Pd84Pt16. Fits to the empirical Tafel equation
![Equation ([1])](https://content.cld.iop.org/journals/1945-7111/160/2/F175/revision1/jes_160_2_F175eqn1.jpg)
with a and the Tafel slope, b, as adjustable parameters and the current density j as the independent variable returned a slope of 54 mV/decade in the low current region (approximately 2 mA cm − 2 to 200 mA cm − 2, 0.93 V to 0.83 V), and 128 mV/decade at high currents (approximately 300 mA cm − 2 to 950 mA cm − 2). The Pt electrode is linear through only one region, with a slope of 285 mV/decade from 100 mA cm − 2 to 1000 mA cm − 2. At lower overpotentials, the Pt curve is smoothly varying and Tafel fits over a decade of current density were unsatisfactory. We stress that these values are "apparent" Tafel slopes rather than true kinetic parameters. In acidic media29 and in the PEMFC system,30 the intrinsic kinetics of the oxygen reduction reaction on Pt were shown to be modified by adsorptive coverage of the metal surface by chemisorbed oxide species, with a net effect of reducing the observed Tafel slope. Here, "oxide" is the common term for chemisorbed hydroxyls resulting from the water discharge reaction
![Equation ([2])](https://content.cld.iop.org/journals/1945-7111/160/2/F175/revision1/jes_160_2_F175eqn2.jpg)
and distinct from the bulk oxide. Surface coverage by water discharge products is potential-dependent, and upon stripping of these adsorbates at cathodic potentials a transition to the intrinsic Tafel slope is observed. The accepted intrinsic value of the Tafel slope for the ORR on an oxide-free Pt metal surface at 25° C is 118 mV/decade of current density.29 In the case of first-order oxygen reduction kinetics and a temperature-independent transfer coefficient, we can scale this value to higher temperatures by simply multiplying by the ratio of the absolute temperatures of interest, for a apparent Tafel slope of 207 mV/decade at 250° C. The value of 285 mV/decade measured for Pt in an SAFC at 250° C is greater than this theoretical value, but in the absence of a proton transport correction, this represents fair agreement. The slopes derived for Pd84Pt16, however, are considerably lower than what might be expected from a Pt-like catalyst at 250° C.
Cyclic voltammetry (CV) was used to probe electrochemical oxide formation and reduction on the catalysts at 250 °C by purging the cathode feed with 75 sccm of ultrahigh-purity Ar (75 °C dew point) while maintaining the anode H2 feed to create a pseudo-reference electrode. For each voltammogram the working electrode voltage was cycled three times at 50 mV s − 1 from the open circuit potential (approximately 0.75 V) to a vertex potential of 1.2 V and then swept in back to 0.2 V. Voltammograms of Pt and Pd84Pt16 before and after a 12h test are shown in Figure 5. Before fuel cell tests, each cathode had received exposure to dry or humidified argon only. We note in passing the absence of hydrogen underpotential deposition (UPD) peaks in either voltammogram, a feature of SAFC electrodes that obviates the determination of electrochemical surface area via this method. The Pd-rich sample begins to form oxide at approximately 0.8 V during the anodic sweep, while the onset of oxidation in the Pt sample occurs closer to 0.9 V. Similarly, the maximum (absolute) current of the broad Pd84Pt16 oxide reduction peak appears at 0.74 V (and may be better described by two peaks), while the Pt reduction peak maximum is found at 0.85 V. The initial reduction peak charges were found to be 391 mC for the Pd84Pt16 sample and 220 mC for Pt.
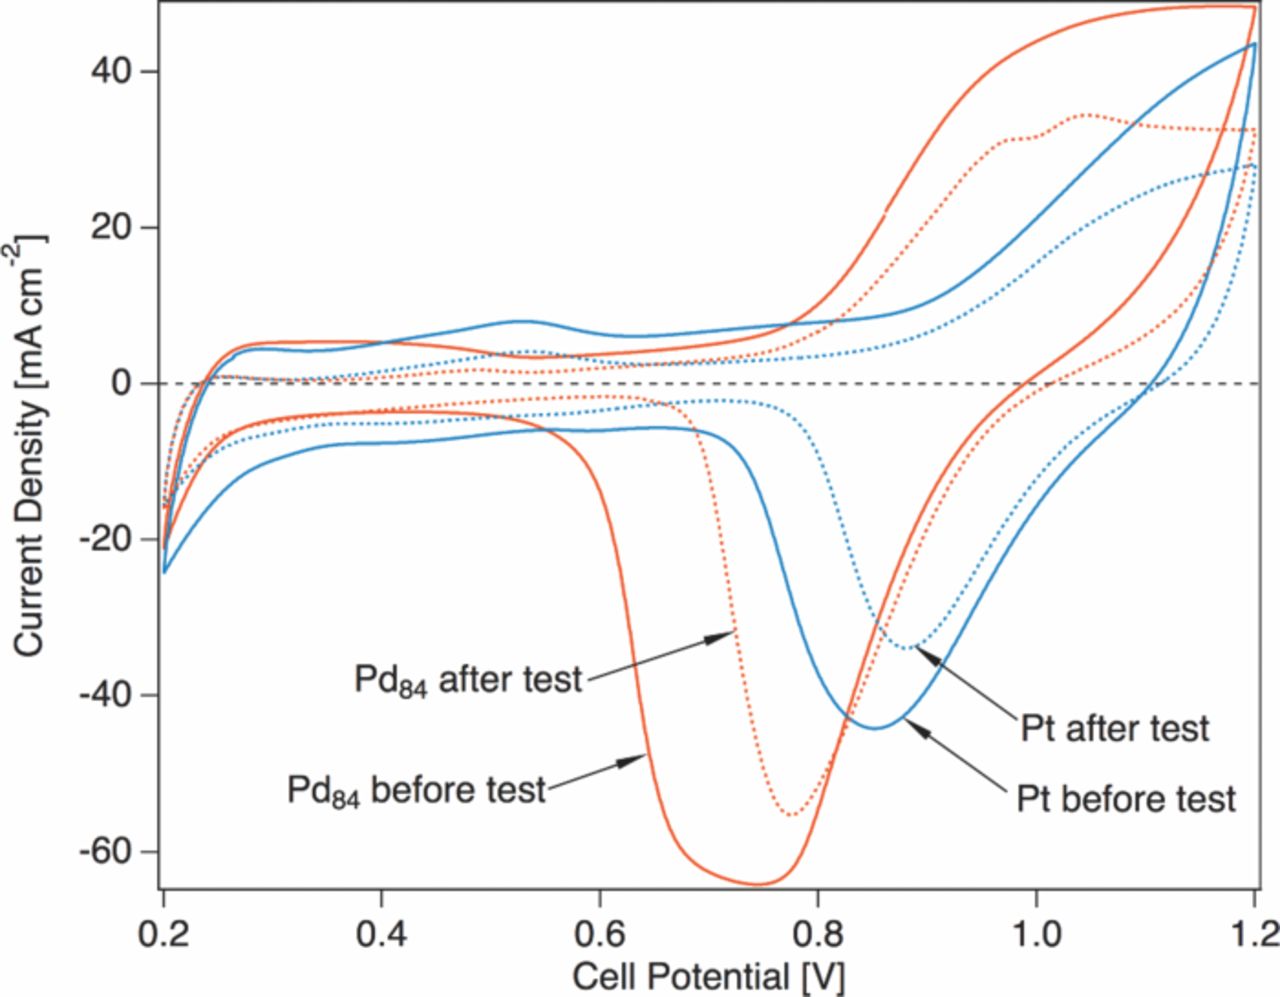
Figure 5. SAFC cyclic voltammograms for Pd84Pt16 and Pt electrodes acquired in Ar at 50 mV s − 1 using the anode under 35 sccm H2 as a pseudo-reference electrode. CVs were recorded at 250 °C with gases hydrated to a 75 °C dew point.
After testing, the relative relationships of the peaks are preserved (reduction peak maxima at 0.77 V for Pd84Pt16 and 0.88 for Pt) but a decrease in peak charge is observed (37% loss for Pd84Pt16, 27% for Pt). The second, more cathodic Pd84Pt16 reduction peak is no longer present after operation. The observed decreases in peak charge, accompanied by similar decreases in double layer capacitance, are consequences of catalyst particle coarsening, an effect confirmed by XRD and SEM as described below. The cathodic offsets of Pd84Pt16 surface redox with respect to Pt are in accordance with those observed for oxygen reduction on Pd catalysts in acidic media, implying an absence of a heavily Pt-enriched surface phase.
Returning to the polarization curves shown in Figure 4 (and, by extension Figure 1) with context from the cyclic voltammograms in Figure 5, it is clear that the Pd-rich catalyst favors a coverage of oxo-type species through a potential range disparate from the Pt control catalyst. This coverage is consistent with a reduced Tafel slope, and can explain a low oxygen gain in the case of active sites that are nearly saturated with adsorbed oxide at mildly anodic potentials, even in air.
Under constant voltage operation at 0.6 V in H2/air at 250 °C, the current density produced by Pd-rich cathodes rapidly declines. Subsequent to the 12 hour testing protocol outlined above, the Pd84Pt16 sample loses 50% of its maximum current density at 0.6 V. Electrodes with less than 60 at% Pd do not exhibit such rapid degradation, but rather have a stability similar to that of Pt. Current density at 0.6 V and area specific ohmic resistance (ASR) for selected samples during the first 12 hours of testing are plotted in Figure 6. The maximum current density at 0.6 V (jmax(0.6V)) and the current density at 0.6 V after 12 hours of testing (j12h(0.6V)) are summarized for each sample in Figure I. Measured changes in the ASR of the Pd-rich samples are 10% or less (as shown in Figure 6) and are insufficient to explain the large change in current density at 0.6 V, implying the existence of another degradation channel.
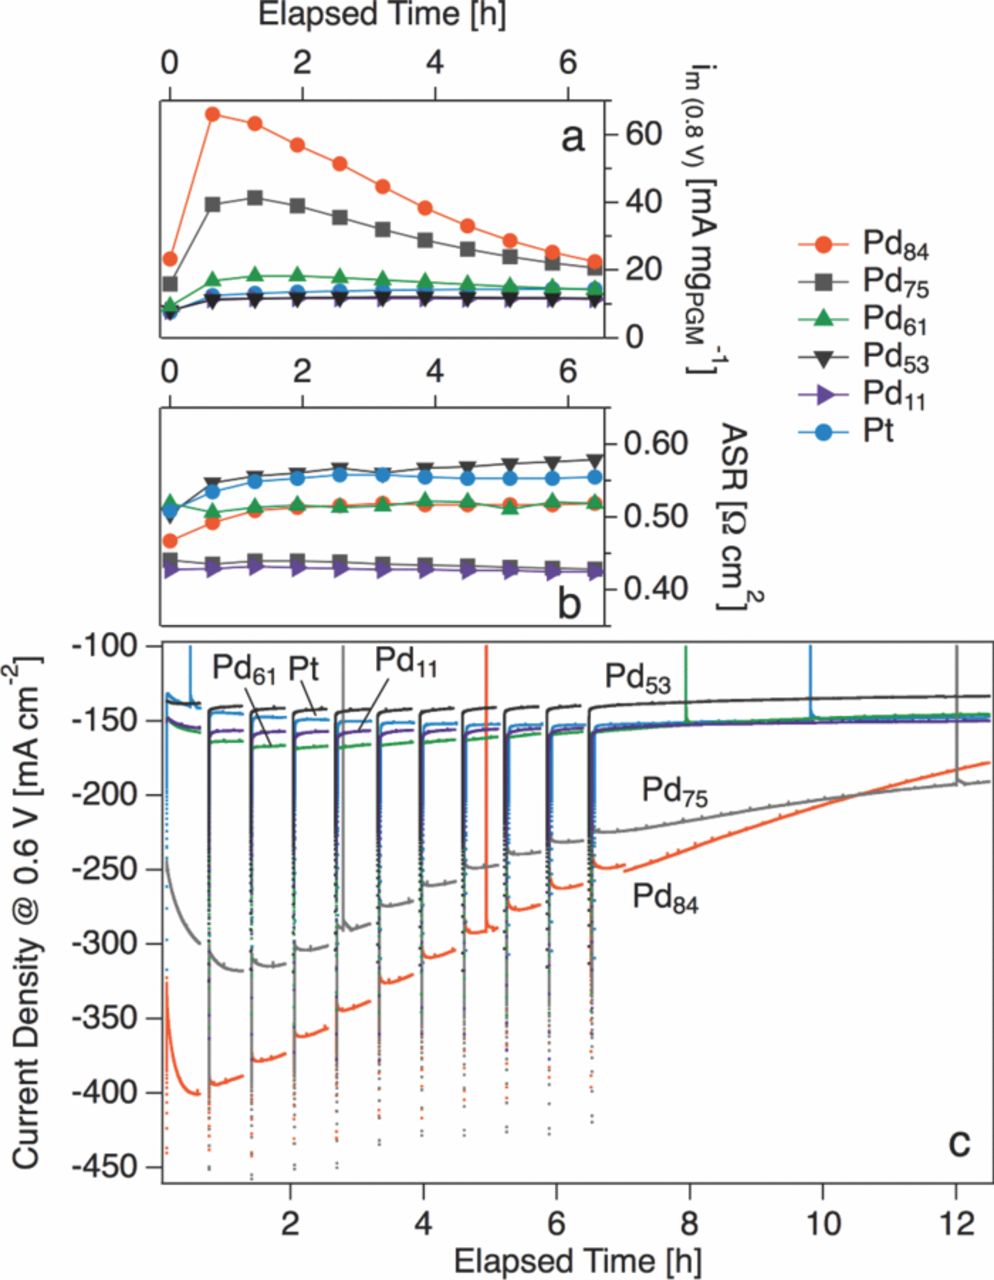
Figure 6. Time evolution of (a) Mass activity at 0.8 V (im(0.8V)) (b) area-specific resistance (ASR) and (c) current density at a cell voltage of 0.6 V at 250 °C in H2/air for Pt and selected Pt-Pd cathodes. Breaks in the traces in panel (c) correspond to recording of polarization curves and EIS spectra.
The initial enhancements in ORR activity, the loss of current density at 0.6 V, and the disappearance of the second oxide reduction peak for Pd84Pt16 (Figure 5) are correlated, prompting us to investigate structural, chemical, and morphological origins of these phenomena. Aside from SEM imaging, the analytical techniques used were applied to catalysts that had been isolated from their supporting CDP by dissolution of the electrolyte in water with the intent of increasing signal ratios.
Structural and chemical characterization
FESEM micrographs of Pt, Pd53Pt47, and Pd84Pt16 catalysts on CDP supports before (pre-FC) and after (post-FC) fuel cell testing are shown in Figure 7. While pre-FC Pd53Pt47 appears very similar to Pt, pre-FC Pd84Pt16 displays a distinct morphology of large ( ∼ 100 nm diameter) spherical particles decorating the conformal nanoparticle film that coats the CDP support. The contrast of both the large particles and smaller particles appears enhanced relative to the rest of the image. These features may be enriched in Pd beyond the average bulk Pd content of Pd84Pt16; Pd has a higher secondary electron yield than Pt, and Pd-rich zones should appear brighter in an electron image. After testing, a coarsening and reorganization of the catalytic films is evident, consistent with an effect identified in Pt films in SAFCs previously.20 The Pd53Pt47 electrode appears to have coarsened less than the Pt sample, but the Pd84Pt16 catalyst shows considerably more agglomeration and a greater density of discontinuities between particles than either of the other samples. Large agglomerates remain present in post-FC Pd84Pt16 and are approximately the same size as in the pre-FC sample. EDS spectra of washed post-FC catalysts indicated bulk Pt:Pd ratios within ± 2 at% of the pre-FC catalysts.
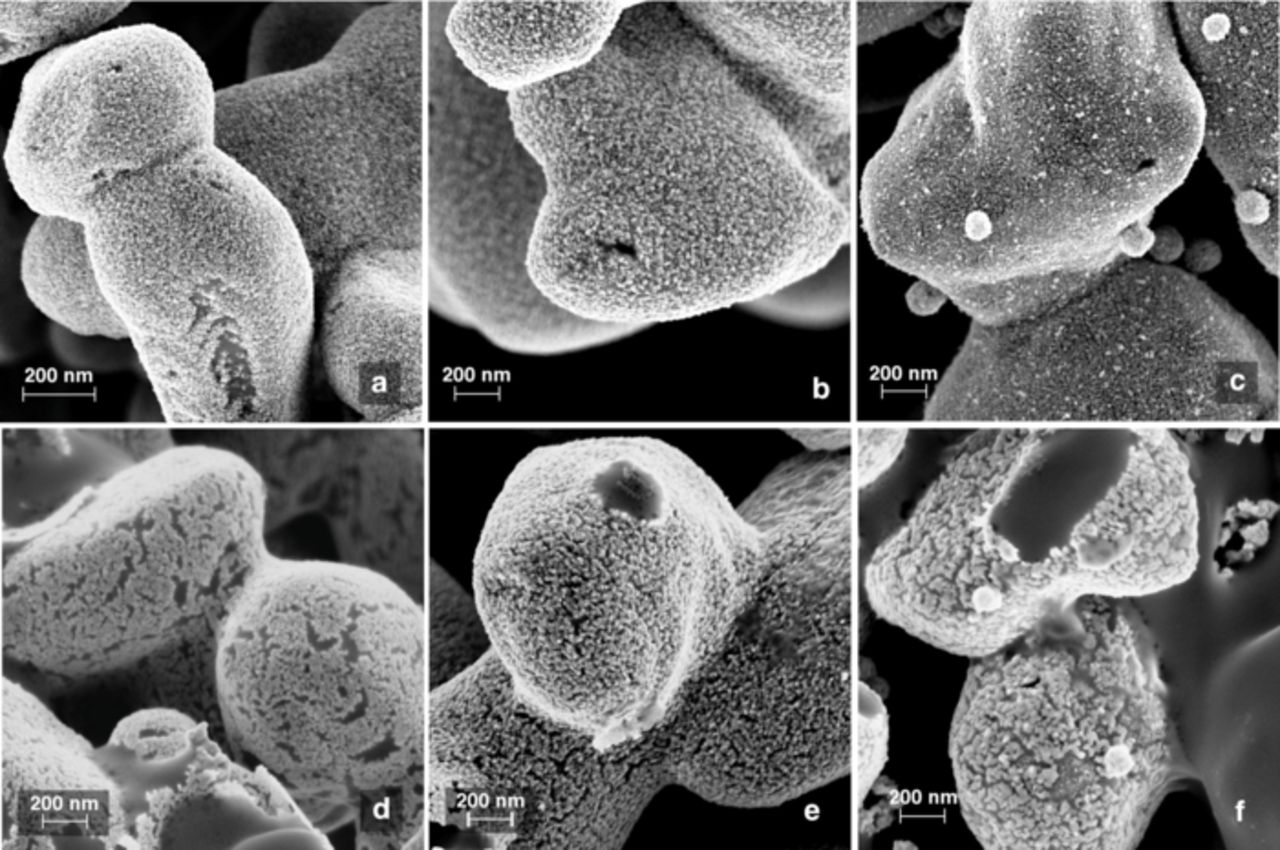
Figure 7. High resolution field-emission SEM micrographs of representative CsH2PO4 powders after deposition of (a) Pt, (b) Pd53Pt47, and (c) Pd84Pt16 catalysts at 210 °C. The lower portion of the figure shows micographs of (d) Pt, (e) Pd53Pt47, and (f) Pd84Pt16 catalysts after fuel cell testing at 250 °C.
Cu Kα X-ray diffraction patterns are shown in Figure 8 for pre-FC and post-FC catalysts absent of CDP. All samples show a crystalline fcc structure with no evidence of bulk oxides, with the exception of the post-FC Pd sample, which shows a weak PdO component. For strong (111) peaks, the Cu Kβ peak is present at approximately 36° in 2θ. The peaks of the as-sythesized particles are significantly broader than those extracted from tested cathodes. The coherence length of the respective particles was computed with the Scherrer equation applied to the fcc (111) peak. Post-FC samples displayed a domain size increase of 3 × to 4 × . The Scherrer width of the Pt control increased from 3.7 nm to 12.4 nm, while the Pd84Pt16 width increased from 4.3 nm to 17.2 nm. Complete results are collected in Table II.
Table II. Lattice parameter, a, and Scherrer coherence length, L, derived from Cu Kα XRD patterns of SAFC cathode catalysts before and after fuel cell testing.
| Before Testing | After Testing | |||
|---|---|---|---|---|
| Sample | a [nm] | L [nm] | a [nm] | L [nm] |
| Pd | 0.3991 | 6.9 | 0.3892 | 21.0 |
| Pd93Pt7 | 0.3979 | 5.2 | 0.3894 | 20.3 |
| Pd84Pt16 | 0.3963 | 4.3 | 0.3900 | 17.2 |
| Pd75Pt25 | 0.3960 | 4.1 | 0.3901 | 14.1 |
| Pd61Pt49 | 0.3948 | 4.0 | 0.3906 | 12.9 |
| Pd53Pt47 | 0.3935 | 3.6 | 0.3906 | 12.0 |
| Pd45Pt55 | 0.3928 | 3.7 | 0.3912 | 12.6 |
| Pd36Pt64 | 0.3922 | 3.7 | 0.3915 | 13.3 |
| Pd23Pt77 | 0.3921 | 3.7 | 0.3918 | 12.6 |
| Pd11Pt89 | 0.3916 | 3.8 | 0.3918 | 12.3 |
| Pt | 0.3920 | 3.7 | 0.3924 | 12.4 |

Figure 8. Cu Kα x-ray diffraction patterns of Pt-Pd catalysts before (a) and after (b) fuel cell tests at 250°C. Vertical lines indicate the positions of the Pd(111) and Pd(200) peaks for pure Pd metal. (c) The dependence of the derived lattice parameters on Pd content is plotted with the lattice parameters expected from application of Vegard's law.
Lattice parameters were also calculated with Bragg's law using the fcc (111) peak. Palladium has a slightly lower lattice parameter than platinum (Pd: 0.3892 nm; Pt: 0.3923 nm), and Pt-Pd solid solutions exhibit reasonable agreement with Vegard's Law. However, as shown in Figure 8, significant departures from this relationship are observed in the as-synthesized catalysts. Rather than contracting with Pd addition, the lattices of the as-synthesized materials are dilated, and become increasingly so with increased Pd content. The lattice parameters of post-FC catalysts, on the other hand, display very good agreement with Vegard's law. However, in the Pt-Pd system, the Pd lattice expansion due to Pt addition is less than Vegard's law predicts,31 suggesting that a slight lattice dilatation in excess of that expected from alloying may still be present.
The lattice expansion deduced from the pre-FC patterns is a hallmark of interstitial impurity defects, and common to Pd32–35 and Pd alloys36,37 exposed to hydrogen or hydrocarbon environments. Both carbon and hydrogen are likely to occupy interstitial sites in Pd, and have been shown to competitively insert based on environmental conditions.38–41 Carbon is a more likely impurity species in this case. Carbon impurities are common in thin films deposited from metallorganic precursors at low temperatures and in the absence of a strong reducing agent, and indeed, we have previously detected surface carbon species on Pt SAFC catalysts via XPS.20 Carbon and hydrogen content of the samples were determined by CHN analysis (Galbraith Laboratories) with a detection limit of 0.5 wt%. No hydrogen was detected, but carbon was found in all as-synthesized samples, in amounts increasing with Pd content. Post-FC samples still contained carbon, but in reduced amounts. The Pd84Pt16 sample contained 2.85 wt% carbon pre-FC, and 0.92 wt% post-FC. In comparison, both pre-FC and post-FC platinum catalysts had nearly identical carbon content, 1.14 wt% and 1.16 wt%, respectively.
A linear relation empirically describes the lattice parameter expansion induced by interstitial carbon:38
![Equation ([3])](https://content.cld.iop.org/journals/1945-7111/160/2/F175/revision1/jes_160_2_F175eqn3.jpg)
Here, a0 is the carbon-free lattice parameter (in this case, calculated for each composition using Vegard's law) and x is the mole fraction of dissolved carbon. Returning to the case of Pd84Pt16, equation 3 yields an interstitial carbon fraction of 0.10 prior to fuel cell tests. Conversion of the CHN data from weight to a molar basis results in a mole fraction of 0.22, indicating that approximately half of the carbon present in the sample does not occupy lattice sites. Above 53at% Pd, interstitial carbon accounts for approximately 50% of the total carbon in each sample. Below this composition, dissolved carbon fractions are not constant, but rather track the Pd fraction. Table III summarizes carbon content derived by various methods.
Table III. Catalyst carbon content measured before and after fuel cell tests by CHN analysis, XRD and XPS. For CHN data, contents are given as both weight percentages and converted mole fractions.
| pre-FC CHN | post-FC CHN | pre-FC XRD | pre-FC XPS | post-FC XPS | |
|---|---|---|---|---|---|
| Sample | wt% (xat) | wt% (xat) | [xat] | [xat] | [xat] |
| Pd | 5.31 (0.331) | 5.89 (0.356) | 0.148 | ||
| Pd93Pt7 | 3.85 (0.268) | 1.25 (0.104) | 0.127 | ||
| Pd84Pt16 | 2.85 (0.219) | 0.92 (0.081) | 0.100 | 0.687 | 0.497 |
| Pd75Pt25 | 1.76 (0.152) | 1.06 (0.097) | 0.092 | ||
| Pd61Pt49 | 1.32 (0.126) | 0.88 (0.087) | 0.068 | ||
| Pd53Pt47 | 1.20 (0.120) | < 0.5 | 0.045 | 0.555 | 0.408 |
| Pd45Pt55 | 1.34 (0.138) | 0.77 (0.084) | 0.032 | ||
| Pd36Pt64 | 1.09 (0.121) | 0.8 (0.092) | 0.019 | ||
| Pd23Pt77 | 0.97 (0.117) | 0.74 (0.092) | 0.012 | ||
| Pd11Pt89 | 0.94 (0.123) | (N/A) | 0.000 | ||
| Pt | 1.14 (0.158) | 1.16 (0.160) | 0.000 | 0.496 | 0.467 |
Discovering significant carbon content in all vapor-grown catalysts and the presence of an interstitial carbide phase in Pd-rich samples motivated a deeper inquiry into the surface chemistry of selected samples using X-ray photoelectron spectroscopy. Due to the possibility of surface carbides that can shift C1s binding energy,36,42 the Pt4f7/2 peak was used as a reference for calibration of binding energy. Pre-FC and post-FC samples of Pt, Pd84Pt16, and Pd53Pt47 were selected for analysis.
XPS C1s peaks are shown in Figure 9. Pre-FC samples clearly show enhanced intensity near 288 eV characteristic of the C = O bond, a likely remnant of the diketonate precursor ligand and in agreement with spectra we have reported previously.20 Pre-FC catalysts also show a systematic spectral shift toward lower binding energies, possible evidence of surface carbides. Nonlinear least-squares fitting was used determine the locations and intensities of the spectral components of the C1s peaks. Before testing, all samples show spectral shifts toward lower binding energies. The largest component of the Pd84Pt16 spectrum is found at 284.4 eV before fuel cell tests, and shifts to 284.7 eV after testing. Shifts to higher binding energies more often associated with graphitic carbon are also seen for Pt and Pd53Pt47 after testing.
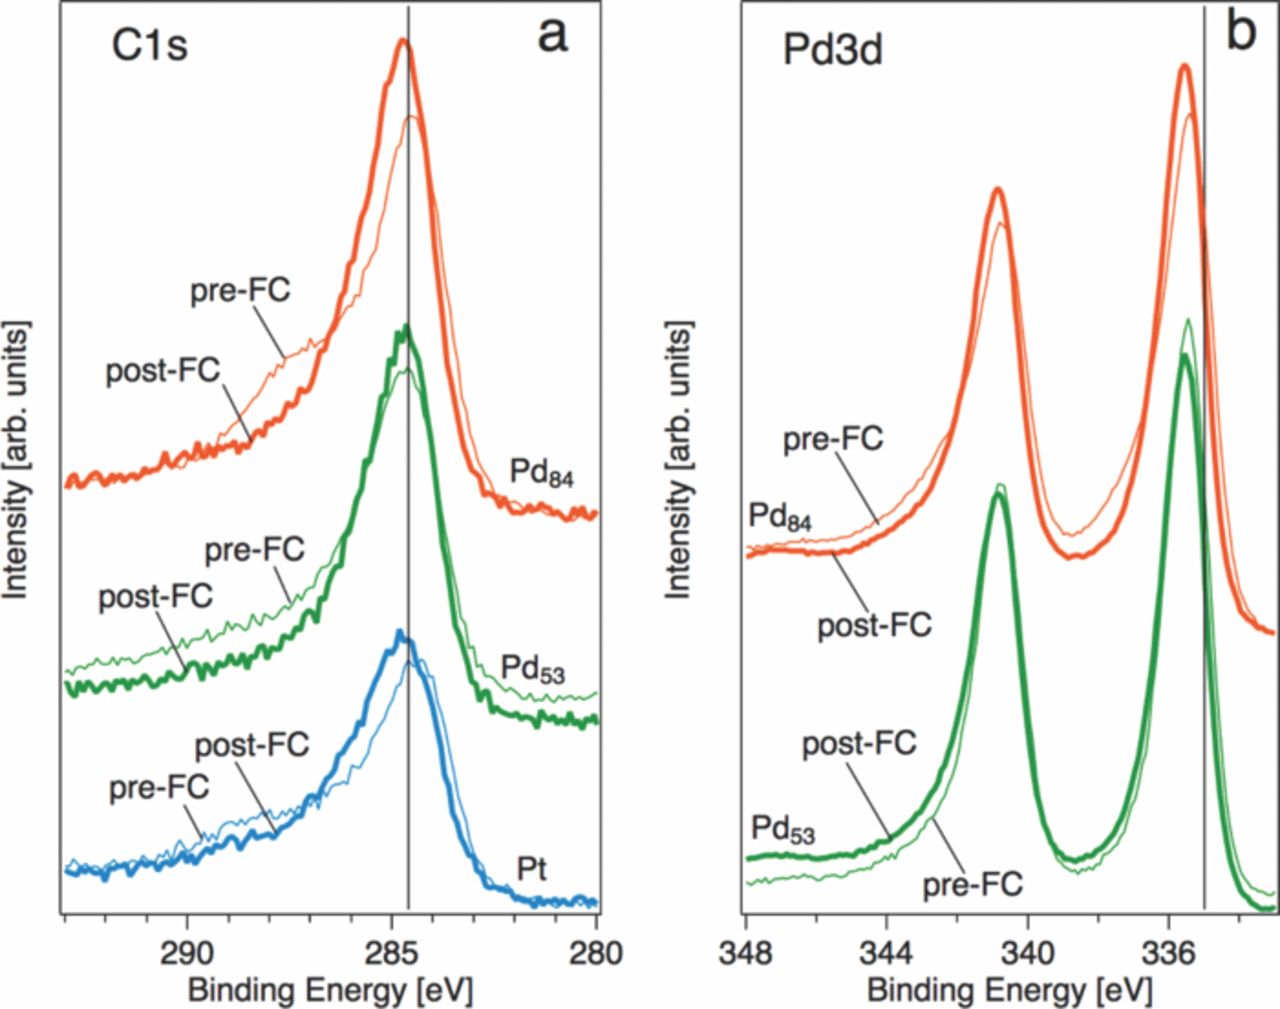
Figure 9. (a) C1s and (b) Pd3d XPS spectra for Pt, Pd84Pt16, and Pd53Pt47 before and after fuel cell testing. Spectra have been normalized and shifted vertically by arbitrary amounts for clarity. The Pt4f7/2 peak was set to a binding energy of 71.2 eV as an energy reference. Vertical lines denote acceped positions for (a) graphitic carbon, 284.6 eV and (b) Pd metal, 335 eV.
The possibility of surface carbides is supported by slight shifts in the Pd3d5/2 peaks to a binding energy higher than is usually reported for Pd metal. In Figure 9(b), the measured Pd3d spectra exhibit shifts of +0.4 to +0.5 eV with respect to the accepted Pd0 binding energy at 335 eV. This is consistent with values reported for carbide formation during alkyne hydrogenation41 and CO exposure.35 After fuel cell operation, we observed shifts to slightly higher binding energy (approximately +0.1 eV), possibly indicative of carbon migration from the lattice to surface sites.
The ratio of carbon to Pt and Pd was estimated from the XPS data using the equation
![Equation ([4])](https://content.cld.iop.org/journals/1945-7111/160/2/F175/revision1/jes_160_2_F175eqn4.jpg)
where xC is the mole fraction of carbon, Ij is the integrated intensity of the strong photoelectron peak for element j of the set C, Pt, and Pd (for the 1s, 4f, and 3d peaks, respectively) and sj are the associated atomic sensitivity factors. XPS offers a third perspective on carbon in this system, complementing the total carbon content obtained from CHN analyis and the lattice carbon from XRD with surface-sensitive compositional data.
All samples were significantly enriched in surface carbon in comparison with the values obtained via other methods. After fuel cell operation, the Pt-Pd alloys showed decreases in surface carbon of nearly 30%. Pt, on the other hand, showed no decrease in carbon content post-FC, in agreement with CHN analysis. This is good evidence that carbon is not electrochemically active in the Pt catalysts and is not oxidized in excursions to higher potentials. By the same token, the decrease in carbon content in Pd-containing catalysts, from both surface and lattice sites is likely to be a result of an anodic process.
The decarburization of Pd-rich samples during fuel cell operation, and the concomitant decrease in activity, suggests that carbon may play a role in oxygen reduction. Subsurface palladium carbides have been shown to play an essential role in hydrogenation processses,40–43 and have a strong influence on the activity and selectivity of Pd catalysts for alkene formation. It is possible that carbon may have a similar promotional effect on the ORR in SAFCs.
Equation 4 was also applied to the Pt 4f and Pd 3d intensities and scattering factors to estimate the state of the Pd84Pt16, and Pd53Pt47 surfaces before and after fuel cell tests. The surface composition of the Pd84Pt16 sample from this method was Pd72Pt28 prior to testing, indicative of surface enrichment in Pt relative to the bulk material. Virtually the same value is found post-FC (Pd73Pt27). For Pd53Pt47 an XPS surface composition of Pd41Pt59 is found, again indicating relative surface enrichment of Pt. However, after testing, a surface composition of Pd56Pt44 results, very close to the bulk value from EDS.
Conclusions
We have demonstrated the first application of alloy catalysts with greater mass activity than Pt in a solid acid fuel cell. A facile, low temperature vapor synthesis route was used to grow Pt-Pd alloy catalysts supported on the solid acid CsH2PO4. In SAFCs operating in H2-air at 250 °C, catalysts with a metal composition of Pd84Pt16 displayed an activity of 66 mA mg − 1PGM at an iRΩ free voltage of 0.8 V, 4.5 times greater than that of a vapor-deposited Pt catalyst.
The most active Pd-rich catalysts display anomalous structural and electrochemical characteristics in comparison with a vapor-deposited Pt control. X-ray diffraction showed lattice expansion in Pd-rich samples, an effect that was traced to the presence of interstitial carbon. Cyclic voltammetry indicated that the experimental catalysts are considerably more oxophilic than Pt, based on the observation that electrochemical oxide formation and reduction occurs at more cathodic potentials versus Pt. Large reductions in the empirical Tafel slope of the experimental catalyst and a limited oxygen gain also suggest that Pd-rich catalysts benefit from an enhanced oxygen binding affinity. This is an important datum for the design of more advanced SAFC cathode catalysts, given the categorical differences between solid acid electrolytes and more conventional acid electrolyte systems.
Although the ORR activity enhancement displayed by the experimental catalysts with high Pd content is pronounced, it is short-lived. The rapid de-activation of the catalysts during fuel cell operation is accompanied by lattice decarburization and particle coarsening. However, these effects are also observed in more stable compositions, suggesting that a more subtle effect may be the cause of the activity degradation. A more detailed probing of the coordination environments of Pd and Pt surface atoms, and the interaction of these sites with the solid acid electrolyte, is required for a complete picture of the activity and evolution of these catalysts to emerge.
Acknowledgments
Partial support for this work was provided by the National Science Foundation through TN-SCORE (NSF EPS-1004083) and by the University of Tennessee's Governor's Chair Fund. A portion of this work was supported by the U.S. Department of Energy's Office of Basic Energy Science, Division of Materials Sciences and Engineering, under contract with UT-Battelle, LLC. A. B. P. thanks David Wilson for assistance with sample preparation.