Abstract
Four hundred hour fuel cell tests were performed on commercial, as-received and Ca2+ contaminated catalyst coated membranes (CCMs) to evaluate the effects of long term exposure of foreign cations on fuel cell performance and degradation. Following testing, significant thinning of the cathode catalyst layer was observed across the entire active area in the contaminated cell, while only localized thinning was observed in the as-received baseline CCM. Analysis of the elemental maps and line intensity profiles of platinum (Pt) obtained from energy dispersive X-ray spectrum (EDX) shows minimal change in total platinum content across the thickness of the catalyst layer, and hence loss of carbon is suspected to be the cause of the thinning. A numerical model is employed to show the foreign cation redistribution during testing, which shows proton depletion in the cathode catalyst layer when the CCM is contaminated with foreign cations. We hypothesize that this lack of protons leads to accelerated carbon corrosion in the cathode to supply protons to oxygen reduction where foreign cations block transport of protons. A carbon corrosion scheme is presented which shows that under the operating potentials of the cell, carbon oxidation can occur, leading to the observed thinning.
Export citation and abstract BibTeX RIS

This is an open access article distributed under the terms of the Creative Commons Attribution 4.0 License (CC BY, http://creativecommons.org/licenses/by/4.0/), which permits unrestricted reuse of the work in any medium, provided the original work is properly cited.
The polymer electrolyte fuel cell (PEFC), a promising clean energy source for automobile application, still needs to overcome durability issues originating from various sources.1 Cationic impurities originated from either ambient air (e.g. roadside contaminants) or from the corrosion of stack and balance of plant components can significantly decrease the performance and life time of PEFCs.1–4 In this paper, we report on the influence of foreign cationic contamination on the thinning of the cathode catalyst layer during non-accelerated testing. Long duration (400hr) testing was conducted using commercial catalyst coated membranes which showed significant catalyst layer thinning in a calcium cation contaminated cell, this thinning of the cathode catalyst layer was not observed in a non-contaminated baseline. While foreign cations are known to cause several degradation mechanisms in PEFCs, no study has examined the influence of cationic contamination on carbon corrosion, which we believe causes the thinning of the catalyst layer.
To understand the impact and mechanism of cation contamination in PEFC, several modeling5–11 and experimental studies12–33 have been conducted, including ex-situ contamination of the polymer membrane with various cations before the test as well as injecting cations into the air or fuel stream during the cell test. Okada and co-workers extensively investigated the effect of various metal cations (Li+, Na+, Ca2+, Fe2+, Ni2+, Cu2+, Rb2+, Cs+) on the transport properties of perfluorosulfonic acid (PFSA) membranes, thermodynamics and oxygen reduction reaction (ORR) kinetics.5,13–18 They reported that, with the exception of Li+, all foreign cations have higher affinity toward the sulfonic acid side chain (SO3−) of the PFSA ionomer than protons, and in general, multivalent cations show higher affinity for sulfonic acid groups than the monovalent cations. Once the cations enter the ionomer, they displace protons resulting in reduced ionic conductivity and water content, as well as lower gas permeability of the ionomer.5,6,13–18 Other researchers confirmed the findings of Okada group as well.9,20,25,31,33
Sulek et al. tested PEFCs with polymer membranes that were pre-immersed with four different metal (Al, Fe, Ni, and Cr) sulfate (SO42−) solutions and found that the performance degradation order for those metals ions are: Al3+>> Fe2+>Ni2+, Cr3+.23 Pozio et al.19 investigated the degradation in PEFC that was caused by iron contamination from SS316L end plates and reported that contamination of the membrane electrode assemblies with iron led to degradation of the ionomer, revealed by a massive fluoride losses. Li et al. reported that a level of as low as 5 ppm of Fe3+ in the air stream caused significant cell performance degradation due to the formation of pinholes in the membrane.21 They suggested that these pinholes may have been promoted by the enhanced production of peroxide radicals catalyzed by Fe species through Fenton's reaction. They also reported that Al3+ reduced ORR kinetics and changed the ORR mechanism from a predominantly 4-electron pathway toward a 2-electron pathway.
Our group investigated the effect of different cations (Na+, K+, Mg2+, Ca2+, Ni2+, Ba2+, Al3+, Cr3+, Fe3+) combination with different anions (Cl−, ClO4− and SO42−) that were injected into the air stream of an operating fuel cell24–30 as well as modeled the effects of cation contamination on PEFC performance.9,11 Cation selection was based on several levels of screening: present in the air and water filter samples collected worldwide, contaminants likely to be encountered based on the current and probable future usage, valence state, solubility, toxicity, availability, paucity of scientific or engineering data, and relevance in terms of materials of construction. After the screening studies, one contaminant (Ca2+) was selected for more in-depth studies due to its prevalence in roadside particulates, abundance in the nature, and limited prior investigation.
Our studies confirm that the cation solutions not only affect the polymer membrane by reducing the proton transport and water content, it also affects water management significantly, in some cases which resulted in salt precipitation on the flow field and the gas diffusion layer (GDL) surface that caused serious mass transport losses.25–27,29,30 Owing to the hydrophobic nature of GDL and low solubility of cationic solutions, most of the salt is preferentially deposited on the GDL and flow channels rather than penetrating through the GDL and the electrode layers to contaminate the polymer membrane.
In this present study, we explore the influence of foreign cations (specifically Ca2+) on the apparent thinning of the cathode catalyst. For these tests, two CCMs are tested in fuel cell mode for 400 hours each. One CCM is pre-soaked in a CaSO4 solution; while a baseline CCM (as received, uncontaminated) was also tested under similar conditions for comparison. Following long term (400 hr) testing, uniform catalyst layer thinning in the contaminated CCM was observed, which contrasts with the non-contaminated baseline, where only localized thinning was observed. This thinning is thought to be a result of the corrosion of the carbon support. Further examination of this phenomenon was performed using accelerated stress testing (AST) for carbon support durability.34
Cationic contamination has not been directly linked to causing or accelerating carbon oxidation. Carbon corrosion is one of the major degradation mechanisms limiting PEFC durability, with various causes including transient processes like fuel starvation35–37 and repeated startup/shutdown cycling (where the cathode potential can exceed 1.2V),35,37,38 while additionally having been reported as occurring during normal operating conditions with potentials as low as 0.55V.38,39
Typically PEFC electrodes consist of platinum catalyst nano-particles (2–3 nm) are dispersed over high surface area carbon support particles, ∼20–30 nm in diameter.35 While carbon supports may provide structure and electrical conductivity to the catalyst layer, they are subject to corrosion, which occurs when the cathode potential exceeds 0.207 V (vs. RHE) at 25°C.36
![Equation ([1])](https://content.cld.iop.org/journals/1945-7111/165/6/F3015/revision1/d0001.gif)
Equilibrium potential for this reaction drops to 0.161V (vs RHE) at 80°C. A parallel pathway, resulting in CO exists (C + H2O → CO + H+ + e−, 0.518 V vs RHE), however occurs at a rate that is an order of magnitude slower that the carbon dioxide formation pathway, and is often neglected.35
In cases of fuel starvation, depletion of hydrogen in certain regions of the anode results in lack of protons. To compensate for this, the carbon oxidation occurs in the cathode to supply protons to the anode as a reverse current.40 This is similar to starting a PEFC purged with air, where oxygen is present in the anode upon hydrogen reintroduction, generating high potentials in the anode (0.8V), which can push cathode potentials well above 1.0V, initiating carbon oxidation and supplying protons for oxygen reduction in the anode.36 In both cases, the oxidation of carbon support provides the protons for irregular electrochemical reactions under non-standard cell operating conditions.
Loss of carbon due to oxidation has many effects on the performance of PEFCs. Corrosion of the support leads to both electrical isolation and agglomeration of the platinum catalysts,41 resulting in electrochemical surface area (ECSA) losses of over 50% for certain carbon materials, with limited Pt agglomeration shown by TEM studies, confirming that isolation is the main culprit for ECSA loss.42 This is compounded as the loss of carbon leads to compaction of the catalyst layer (thinning and loss of porosity) which increases the resistance to oxygen transport,38,41,42 further reducing long term performance of the PEFC. This is magnified by an increase in carbon hydrophilicity caused by the formation of surface oxides during the corrosion process, which retards liquid water removal from the catalyst layers.42
There is not a single well-defined model for carbon corrosion in PEFCs.37,39 Certain characteristics of the process are known, including its dependence on relative humidity and that the carbon corrosion rate decreases with time as carbon is removed from the catalyst layers and passive surface oxides are generated on the carbon surface.35,36,39 However, multiple oxidation pathways exist for carbon corrosion, depending on the carbon-oxygen interface (platinum or ionomer).
For direct oxidation of (graphitic) carbon (in cases of fuel starvation or start/stop cycling), Gallagher and Fuller39 had proposed a carbon oxidation model that is highly dependent on carbon surface oxides, including COH, an intermediate product experimentally known to be present during this process. This model includes two types of carbon surface sites. The first are sites where water can adsorb on the surface and initial surface oxides are formed (including COH, Reactions 2–3). Once these have adsorbed/formed on the surface, sites proceed with additional steps wherein intermediary products are formed (including the rate determining step in Reaction 4) and consumed as the carbon is oxidized into carbon dioxide. It should be noted that many of the reaction pathways proposed following Reaction 4 are based on the stoichiometry of the overall reaction and have no experimental evidence of these being the proper intermediate steps.35
![Equation ([2])](https://content.cld.iop.org/journals/1945-7111/165/6/F3015/revision1/d0002.gif)
![Equation ([3])](https://content.cld.iop.org/journals/1945-7111/165/6/F3015/revision1/d0003.gif)
![Equation ([4])](https://content.cld.iop.org/journals/1945-7111/165/6/F3015/revision1/d0004.gif)
According to Pandy et al.43 complete carbon corrosion of the surface COH via this pathway requires high potential (0.95V vs. RHE) to completely oxidize to carbon dioxide.
![Equation ([5])](https://content.cld.iop.org/journals/1945-7111/165/6/F3015/revision1/d0005.gif)
The addition of platinum to the carbon oxidation process however changes the corrosion process and potentials required for complete oxidation.43,44 It is through this pathway that we hypothesize that carbon corrosion occurs when foreign cations are present in the cathode.
The next section provides an overview of the experimental methodology and the results from experiments where CCMs contaminated with foreign cations operated for an extended period. Catalyst layer thinning is discussed by comparing the post-mortem cross-section scanning electron microscopy (SEM) images to uncontaminated CCMs operated similarly.
The rest of the paper is organized as follows: We hypothesize that due to the presence of foreign cations in the cathode catalyst layer, proton flux to and proton occupation of the sulfonic acid side chains in the ionomer is significantly restricted in the cathode catalyst layer, especially near the cathode diffusion media. We use a numerical model to determine the distribution of foreign cations and to examine how foreign cations affect the protonic current distribution in a contaminated CCM and show the proton depletion in the cathode catalyst layer. During long term testing, it is proposed that as current is drawn from the cell, there are two sources of protons in the cathode catalyst layer: those generated in the anode and those generated in the cathode from carbon support oxidation (icathode = iH+ + icor), where iH+ is the protonic current from the anode that is equal to the external current and icor is the internal current in the cathode due to carbon oxidation. Following, we present the results of the ASTs, which show minimal effect of the foreign cations, and further confirm our hypothesis of the role of cation accumulation. ASTs confirm this phenomenon occurs over long term testing under sufficiently high loads, not under accelerated stress tests with low currents.
Cell Testing
Components and test conditions
Cell assembly, testing and contamination were performed in accordance with our previous foreign cation contamination experiments.24–30 The CCMs were GORE PRIMEA Membrane Electrode Assemblies (GORE PRIMEA, W. L. Gore and Associates) with a Pt loading of 0.4 mg/cm2 for both anode and cathode. Freudenberg C4 gas diffusion layers (Freudenberg FCCT SE & Co. KG, Germany) were used during assembly. A set of 25cm2 single-cell hardware (Fuel Cell Technology, Albuquerque, NM, USA) was used for each test. The cell hardware consisted of two aluminum end plates, two gold-plated current collectors, and two machined graphite flow fields with single serpentine and triple serpentine flow channels on the anode and the cathode, respectively.
Calcium sulfate (99.99% pure, Sigma-Aldrich, St. Louis, MO, USA) was used as the contaminant. Contaminated CCMs were prepared by soaking in a cationic solution consisting of 0.9 mM of CaSO4 and 29.1 mM of H2SO4 with full details described elsewhere.24 Ion exchange capacity (IEC) measurements were performed to determine the milli-equivalent of ion exchange group in 1 g dry ionomer. The procedure used was similar to that in Ref. 24 and showed the IEC of the contaminated CCM is decreased by 58% compared to the as-received CCM as calcium cations replaced protons in the electrolyte. This is in agreement with the results presented by Qi et al.45 who measured the Ca2+ exchange isotherms (cation uptake) for Nafion membranes soaked in cation solutions.
Two fuel cells were built, one with an as-received CCM, and the other with the contaminated CCM. After assembly, the cells were conditioned using a constant voltage break-in procedure and run overnight until a stable performance was achieved. For break-in, the cell voltage was set at 0.6 V with cell temperature of 80°C, H2/Air stoichiometric flow of 2/2, anode/cathode relative humidity (RH) of 100%/75%, without backpressure. Ultra-high purity hydrogen (99.9998%) from a HOGEN Hydrogen Generator (Proton Energy Systems Inc., Wallingford, CT) and zero grade air (99.8%, Airgas Inc., Hastings, NE, USA) are used in fuel cell testing. Following break-in, beginning of test characterization, including polarization curves, cyclic voltammetry (CV) for electrochemical surface area, and linear sweep voltammetry (LSV) for hydrogen crossover were measured. The operating conditions for polarization curve measurements were similar to those for conditioning. H2 crossover and CV curves were measured using a potentiostat/galvanostat (Solartron SI 1287). During both H2 crossover and CV experiments, the cathode was purged with N2, while H2 is fed through the anode with flow rates of 250 sccm.
Cell test
The as-received baseline CCM was operated in galvanostatic mode at 400mA/cm2 for 400 hours. Shown in Figure 1 are the cell potential and resistance data, measured by current interrupt method, showing the voltage decay rate is 49 μV/h, with an average cell voltage from 100 hours to 300 hours is 0.73 V. End of test (EoT) polarization scans (not shown) also display little change in the performance following the 400hr current hold.
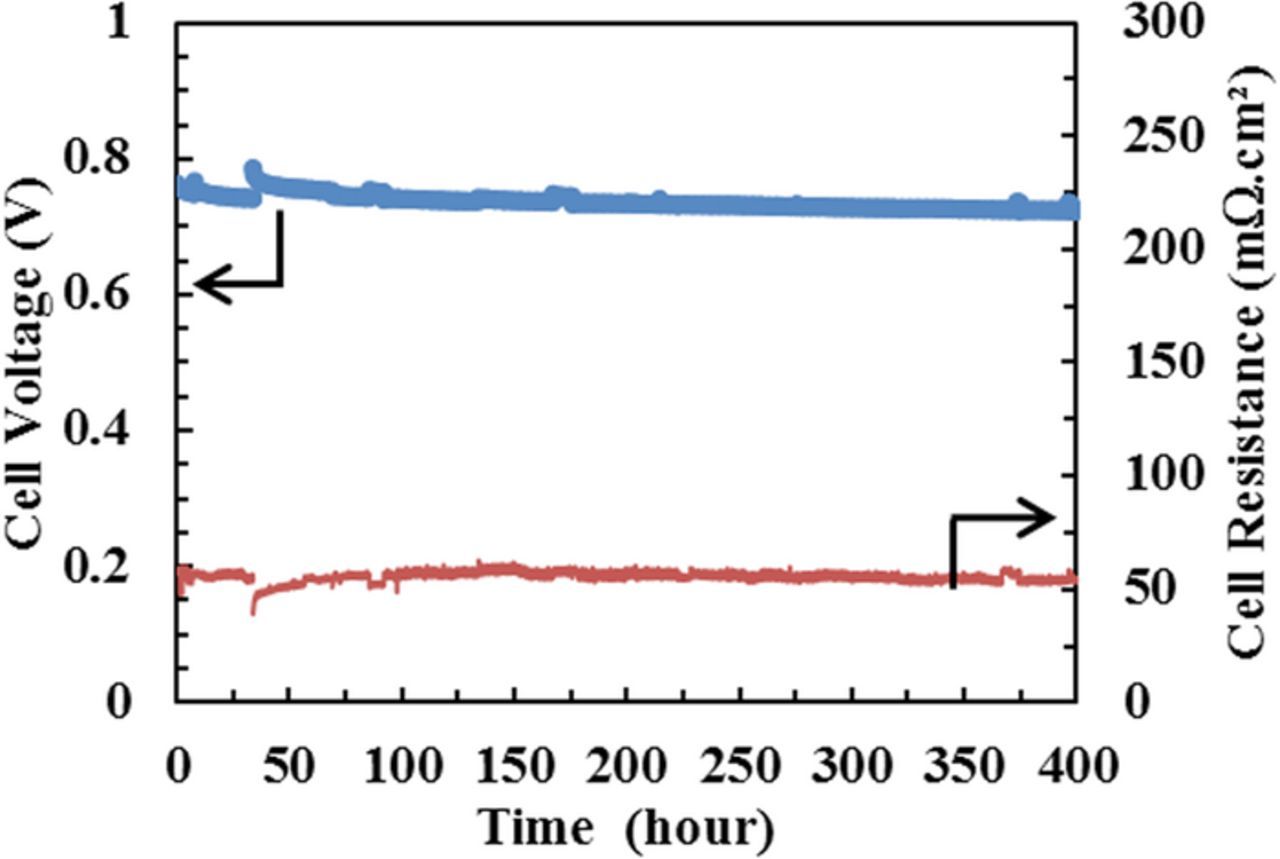
Figure 1. Cell performance of the baseline test measured at 400 mA/cm2 showing stable performance during 400hr test duration. Operating conditions: cell temperature: 80°C; flow rate H2/air: 1.66/1.75 slpm; A/C: 25/125% RH, 1.5/15 psig back pressure.
The calcium contaminated CCM was broken-in in the same methodology to the baseline CCM. During this time, the contaminated cell was unable to reach the 400mA/cm2 current density of the baseline cell. Hence, the contaminated cell was tested in potentiostatic mode at an average potential equal to that of the baseline test for comparison. Figure 2 shows the cell performance of the contaminated CCM tested at 0.73 V. A sharp drop in performance is observed during the first 125 hours of testing, the current density decreases from 100 mA/cm2 to 16 mA/cm2. We believe that the redistribution of the cations and accumulation in the cathode occurs during this initial period, resulting in significant decay in performance. Then the current density remains steady for the next 275 hours and drops by only 3 mA/cm2. The cell voltage fluctuation after approximately 125 hours is due to the electronic load operating near its low power range. During this time, it is not possible to get an accurate measurement of the cell resistance as the cell is running below the minimum current required by the current interrupt method.

Figure 2. Cell performance of contaminated CCM measured at 0.73V. Operating conditions: cell temperature: 80°C; flow rate H2/air: 1.66/1.75 slpm; A/C: 25/125% RH, 1.5/15 psig back pressure.
The loss in cell performance mostly originates from Ca2+ cations replacing protons in the sulfonic acid side-chains of the ionomer resulting in a decrease of the proton conductivity. This ionic conductivity loss stems from multiple, coupled effects including a drop in ionic conductivity for Nafion (from 105.9±1.7 mScm−1 for H-form membrane to 14±1.4 mScm−1 for Ca-form membrane), and a reduction in water content.5,6,9,11,13–17
SEM imaging of cathode catalyst layers
Following both tests, the cells were disassembled and the CCMs were examined using SEM (FEI Quanta 250, FEI, Hillsboro, OR, USA) and energy dispersive X-ray spectroscopy (EDX). The cross section samples of the CCMs were prepared by casting them in epoxy and polishing, and multiple samples from fuel cell inlet, middle, and outlet were examined, with elemental maps and elemental (Pt M-absorption edge) intensity profile (from line scans) of the cross-section collected. For each sample, multiple line scans were collected and averaged to obtain the element intensity profile. To measure the thickness of the various layers of the CCMs, first, the interface of the layers was found from the first derivative of the average intensity profile, then the thickness measured. The uncertainty in the thickness is determined from full width at half maximum (FWHM) of the intensity profile.
Representative SEM cross sections of the baseline test CCM, and the Ca2+ contaminated CCM after the 400 hour testing are presented in Figure 3 along with a cross section from an as-received, untested CCM for comparison. Corresponding Pt maps (from EDX), and average line scan profiles for three samples are also provided. Table I summarizes the catalyst layer thickness and the average Pt intensity derived from the SEM images and EDX analyses. For an as-received CCM, the average thickness of the cathode catalyst layer is uniform at 12 μm throughout the entire length of the sample with a slightly higher platinum intensity near the membrane. Following testing of the non-contaminated as-received baseline, the cathode catalyst layer thickness remains near its beginning of test measurement, with platinum dispersed throughout the layer in the same manner as the before testing. Only localized thinning of the catalyst layer is observed upon a more critical inspection of the samples (shown in Figure 4). Localized thinning has been reported for CCMs after extended operating periods, and can be expected.40,46
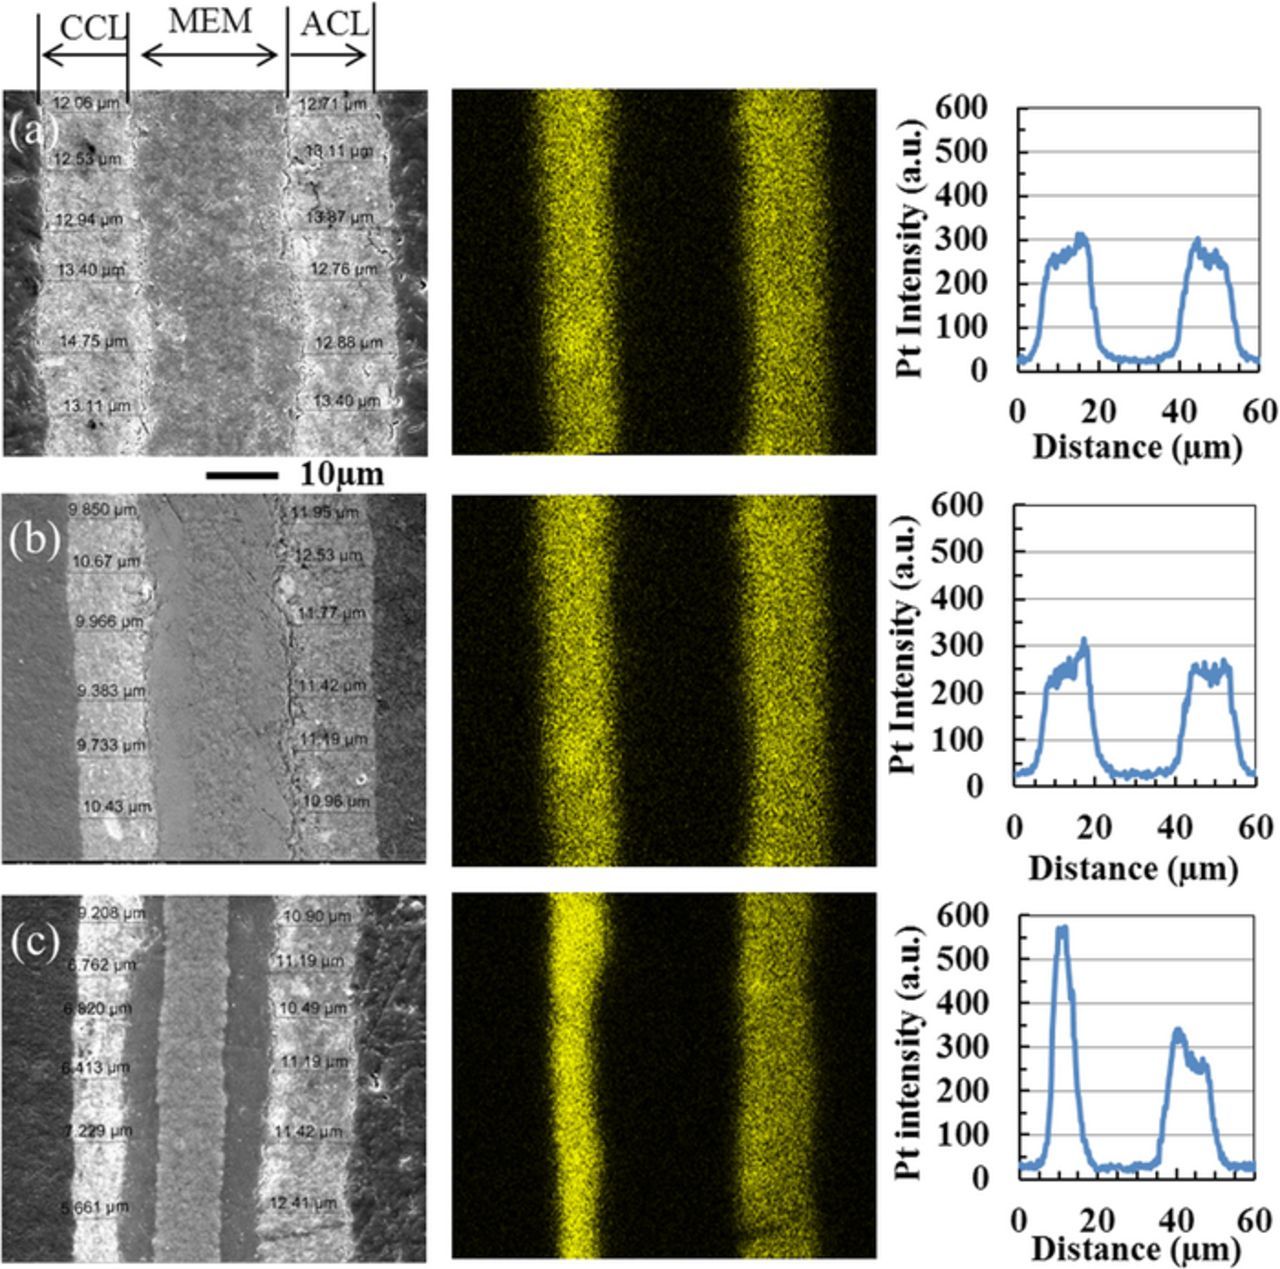
Figure 3. Representative membrane/electrode assembly cross sections imaged by SEM (left), corresponding Pt maps (middle), and average line scan (right) of (a) as-received CCM, (b) baseline test CCM, and (c) Ca2+ contaminated CCM after 400 hour fuel cell test. (CCL-cathode catalyst layer, MEM-membrane, ACL-anode catalyst layer).
Table I. Average catalyst layer thickness and Pt intensity of as-received CCM, baseline posttest CCM, and Ca2+ contamination posttest CCM.
| Average cathode | Average anode | Average cathode | Average anode | |
|---|---|---|---|---|
| CCM | thickness (μm ±1) | thickness (μm, ±1) | Pt intensity (±100) | Pt intensity (±100) |
| As-received CCM | 12 | 11.75 | 3000 | 2900 |
| Baseline test | 10 | 11 | 2860 | 2800 |
| Ca2+ contaminated test | 6 | 11 | 2850 | 3000 |
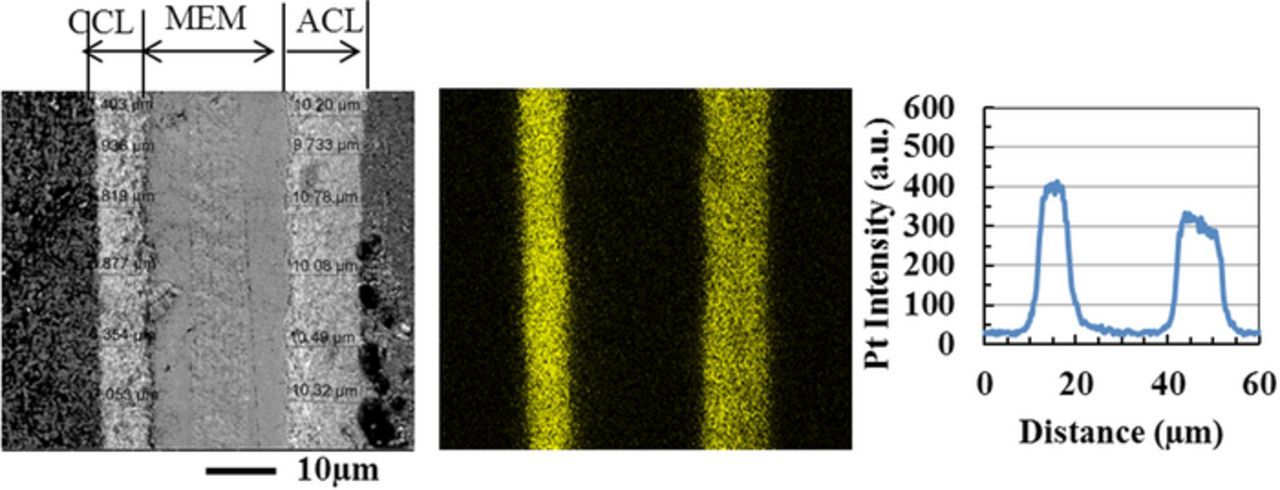
Figure 4. Localized catalyst layer thinning near the outlet in the baseline test. Membrane/electrode assembly cross section imaged by SEM (left), corresponding Pt map (middle), and Pt line scan (right) after a long duration fuel cell baseline test. (CCL-cathode catalyst layer, MEM-membrane, ACL-anode catalyst layer).
In contrast to the non-contaminated baseline, the cathode catalyst layer of the contaminated cell is significantly thinner across the entire active area of the CCM. The cathode catalyst layer thickness of the contaminated CCM reduced from 12 μm to 6 μm, the contaminated CCM did not retain its initial thickness anywhere in the cell.
There can be multiple mechanisms that can cause the thinning of the cathode catalyst layer seen in the contaminated CCM. The first is the compaction of catalyst layer. The catalyst layer has a bulk porosity of ∼40%,11 and is compressed by ∼15% during the cell build. Considering porosity along with compression, the thickness of the catalyst layer cannot decrease more than 1 μm. Moreover, same cell building procedure and parameters are followed for the baseline cell, and there is no significant reduction in catalyst layer thickness. Anode catalyst layer remains unaffected for both CCMs as well. Due to all of these factors, compaction due to assembly pressure is ruled out as a major factor in thinning of the cathode catalyst layer observed in the contaminated CCM.
A second possible mechanism for catalyst layer thinning is the loss of material from the cathode catalyst layer (e.g. loss of platinum or loss of carbon). The cathode catalyst layer of the contamination test CCM loses half of its thickness, but the total Pt content is largely unchanged as evidenced by the EDX profiles. We reach this conclusion because, the Pt signal appears much brighter in the EDX map, the Pt intensity is higher in the line scan (Figure 3) for the contaminated samples, and the total Pt intensity is unaffected (Table I). It needs to be mentioned here that the penetration depth of the X-ray may be different between contaminated and uncontaminated CCMs, due to apparent densification of the catalyst layer in the contaminated CCM. Since the Pt signal looks much brighter in the contaminated CCM, it contains more Pt in a smaller space. So, penetration depth of the X-ray should be smaller in contaminated CCM due to high atomic number of Pt compared to carbon. Despite the lower penetration depth, total Pt intensity in contamination test was comparable with the baseline test. Therefore, the only possible element loss that may cause significant catalyst layer thinning is carbon. Hence, it is hypothesized that the Ca2+ ion directly increases the carbon oxidation reaction rate resulting in catalyst layer thinning of the cathode.
Mechanism for the Thinning of the Catalyst Layer
We hypothesize that the lack of protons to sustain the oxygen reduction reaction in a large portion of the cathode catalyst layer is the major reason for the increased catalyst layer thinning. The lack of protons causes oxidation of the carbon, similar to fuel starvation,40 resulting in thinning of the catalyst layer.
We estimate the average carbon loss due to foreign cations is around 50%, as the average thickness of the cathode catalyst layer of contaminated CCM is ∼6 μm vs ∼12 μm for the baseline CCM. The CCMs have a nominal loading of 0.4 mg Pt/cm2 on either side with 50% wt Pt on C. The carbon loss is then ∼0.2 mg/cm2 ( = 0.0167 mmol/cm2). Complete oxidation of C (Eq. 1) produces 4 e−, hence the total charge generated by carbon corrosion is 6.45 C/cm2 (q = 4nF), corresponding to an average carbon corrosion current density of ∼4.48 μA/cm2 over 400 hours of testing, much smaller than the cell current.
The required low current density and relatively high cathode potentials make accelerated carbon corrosion as a feasible mechanism. Next section describes a numerical model that predicts the distribution of foreign cations, and proves that in a large fraction of the cathode catalyst large there is minimal proton concentration as foreign cations accumulate due to migration.
Numerical model
We use Uddin and Pasaogullari11 model to describe the cation distribution in the membrane-electrode assembly. For detailed description of model equations, the reader is referred to Ref. 11, however the model is briefly described below:
The modeling domain includes the MEA, namely the anode catalyst layer, the polymer electrolyte membrane (PEM), and the cathode catalyst layer. The MEA is pre-saturated with foreign cations (Ca2+), and it is assumed to be uniformly distributed prior to cell operation under potential differential. The amount of foreign cations (Ca2+) is estimated from the IEC measurements described earlier.
In this model, three charged species are considered in the PEM: positively charged proton (H+), one foreign cation (Ca2+) and the negatively charged sulfonic acid side-chains. Sulfonic acid side-chains are considered as stationary species. Through electro-neutrality, yH+ = 1–2yCa2+ for divalent Ca2+, therefore, the following species conservation equation is solved for H+ and Ca2+.
![Equation ([6])](https://content.cld.iop.org/journals/1945-7111/165/6/F3015/revision1/d0006.gif)
Here, N represents the total flux of cation j, which Serincan et al.9 derived the cation flux equation using generalized Maxwell-Stefan (MS) approach. The source term includes generation and consumption of the cations (active here for protons).
![Equation ([7])](https://content.cld.iop.org/journals/1945-7111/165/6/F3015/revision1/d0007.gif)
where y is the relative occupancy and [B] is a matrix including binary diffusivities and relative occupancies. The total cation flux is a balance of diffusion (first term on the right hand side) and migration (second term) due to the electrolyte phase potential. The elements of [B] are47
![Equation ([8])](https://content.cld.iop.org/journals/1945-7111/165/6/F3015/revision1/d0008.gif)
![Equation ([9])](https://content.cld.iop.org/journals/1945-7111/165/6/F3015/revision1/d0009.gif)
Binary diffusion coefficient, Djk is calculated by51
![Equation ([10])](https://content.cld.iop.org/journals/1945-7111/165/6/F3015/revision1/d0010.gif)
where Dj,M and Dk,M are self-diffusivities of species j and k.
Self-diffusivity of proton is calculated from Nernst-Einstein relation as
![Equation ([11])](https://content.cld.iop.org/journals/1945-7111/165/6/F3015/revision1/d0011.gif)
where  is the conductivity of proton. An expression for conductivity of membrane in pure proton form is used from Springer et al.49 to determine the self-diffusivity of H+:
![Equation ([12])](https://content.cld.iop.org/journals/1945-7111/165/6/F3015/revision1/d0012.gif)
Self-diffusivity of Ca2+ is calculated using a relation incorporating the polymer volume fraction for a water swollen membrane (Vp) and the foreign cation's aqueous diffusion coefficient ( ). Parameter b is an empirical parameter has a value of 1.3 for divalent cations.50,51
![Equation ([13])](https://content.cld.iop.org/journals/1945-7111/165/6/F3015/revision1/d0013.gif)
Boundary conditions
As evidenced from our prior experiments,28 there is no mechanism to remove foreign cations from the CCM in an operating fuel cell, hence we expect the cations to remain inside the CCM during the cell operation, therefore no-flux boundary conditions are applied for the foreign cations at the catalyst layer-diffusion media interfaces, i.e. the outer boundaries of the modeling domain. Similarly, proton flux is also zero at these interfaces as the diffusion media cannot conduct protons.
Model parameters
The physical and electrochemical properties for the model remain the same as used by Uddin and Pasaogullari,11 except for changes required Ca2+ instead of Na+, and adjusting the relative humidity for the experimental test conditions. Properties related to Ca2+ are listed in Table II. The initial foreign cation occupancy is based on the IEC measurements. Due to a lack of information on the water uptake for Ca2+ form membranes, the Na+ water uptake curve used by Uddin and Pasaogullari is maintained for this model.
Table II. Physical and Electrochemical Properties Modified for Ca2+ Contamination.
| Description | Value | Ref. |
|---|---|---|
| Relative Humidity at Anode | 25% | |
| Relative Humidity at Cathode | 100% | |
| Ca2+ Cation Charge (z) | 2 | |
| Electro-osmotic Drag Coefficient for Water for Ca2+ Ionomer (nd) | 11 | 13 |
Aqueous Diffusion Coefficient of Ca2+ ( ) ) |
0.79 × 10⁻⁹ m2/s | 52 |
| Volume Fraction of Polymer in Ca2+ form Nafion (Vp) | 0.710 | 51 |
| Initial Ca2+ Cation Occupancy | 60% | 45 |
Model results
Figure 5 shows the proton flux (i.e. protonic current density) across the membrane-electrode assembly, for both contaminated and uncontaminated cases at a potential of 0.72 V, similar to the potential controlled in the contaminated MEA testing (potentiostatic testing) and potential measured in the uncontaminated case (galvanostatic testing). As seen, the protonic current is significantly lower when the MEA is pre-contaminated with foreign cations (Ca2+), mostly due to reduced effective proton conduction; however other effects described by Uddin and Pasaogullari,11 including the effect of foreign cations on oxygen transport, equilibrium potential and on water transport are also accounted for and affect the overall cell operation. It is seen that that majority of the hydrogen oxidation reaction occurs near the membrane in the anode catalyst layer as the relative humidity in the anode is quite low (25%).
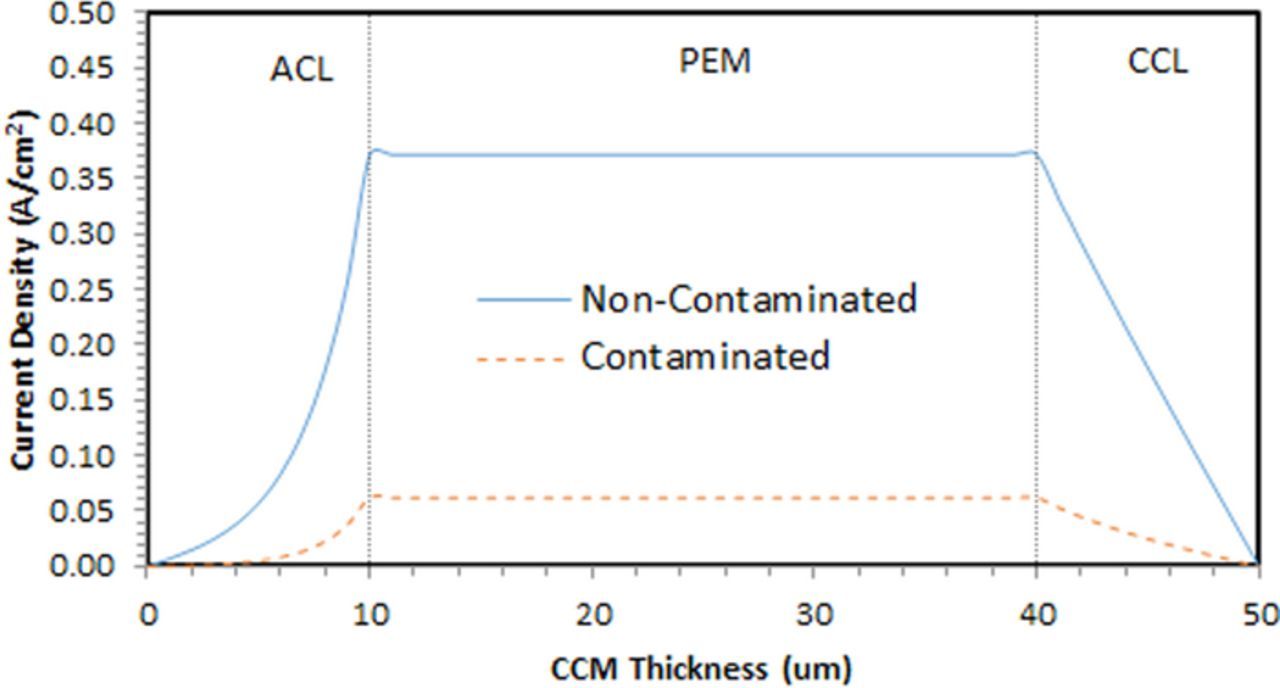
Figure 5. Protonic current density distribution along the MEA thickness for the contaminated and the non-contaminated case. Operating conditions: cell voltage: 0.72 V; RH anode/cathode: 25%/100%; cell temperature: 80°C.
Figure 6 shows the fraction of sulfonic acid side chains (SO3−) attached to protons and foreign cations (Ca2+). This is identical to the distribution of protons and foreign cations fraction in the ionomer across the MEA, with the exception that each Ca2+ occupies two sulfonic acid side chains (SO3−) due to its valance.
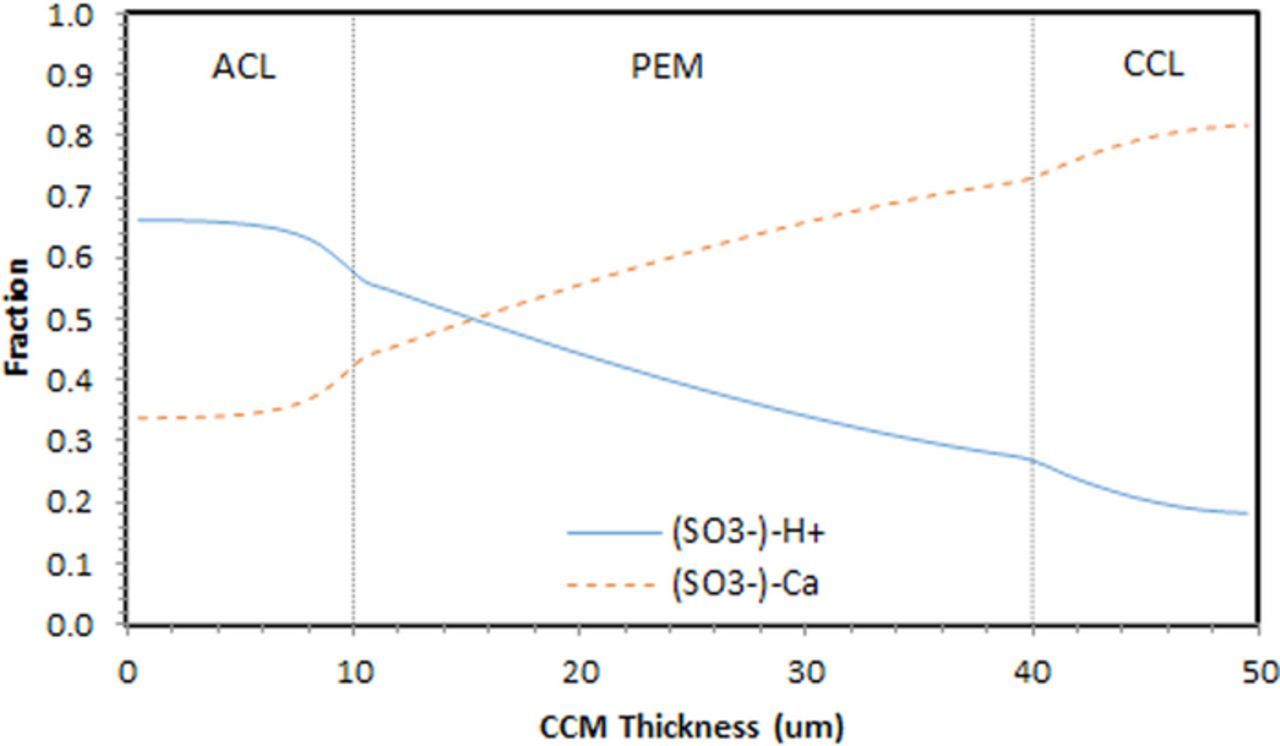
Figure 6. Fraction of the sulfonic acide side chain occupied by protons and foreign cations, across the MEA.
As shown in the figure, due to a balance of migration and diffusion, foreign cations accumulate in the cathode side, severely restricting proton access to many active catalyst sites (as high as 80%). We postulate that in these regions of the catalyst layer, lack of proton access accelerates the carbon corrosion.
Carbon corrosion
Following the soaking of the CCM in a cationic solution, based on the IEC measurements, 58% of the sulfonic acid sidechains are occupied with foreign calcium cations, which have replaced protons in the membrane. During the operation, the foreign cations rearrange themselves as the cation flux balances diffusion and migration (a function of the electrolyte phase potential). As cations are unable to exit the CCM, the model shows that foreign Ca2+ cation accumulate in the cathode catalyst layer, lowering the proton flux, leading to a depletion of protons in the cathode catalyst.
While there is a depletion of protons in the cathode, high potential (0.73V) and abundance of oxygen exist. The protons generated in the anode and transported to the cathode do participate in the oxygen reduction. And this occurs in the catalyst region nearest to the membrane. But there is still a lack of protons for the available oxygen, especially in the region farthest from the membrane. We hypothesize that this is where carbon oxidation is more prevalent, as illustrated in Figure 7. To maintain the ORR in the cathode, protons need to be generated. Similar to how protons can be generated through carbon oxidation in the anode during fuel starvation, carbon oxidation in the cathode can provide the protons necessary for sustaining oxygen reduction. However this can only occur if the operating potential of the cell is high enough to promote carbon corrosion.
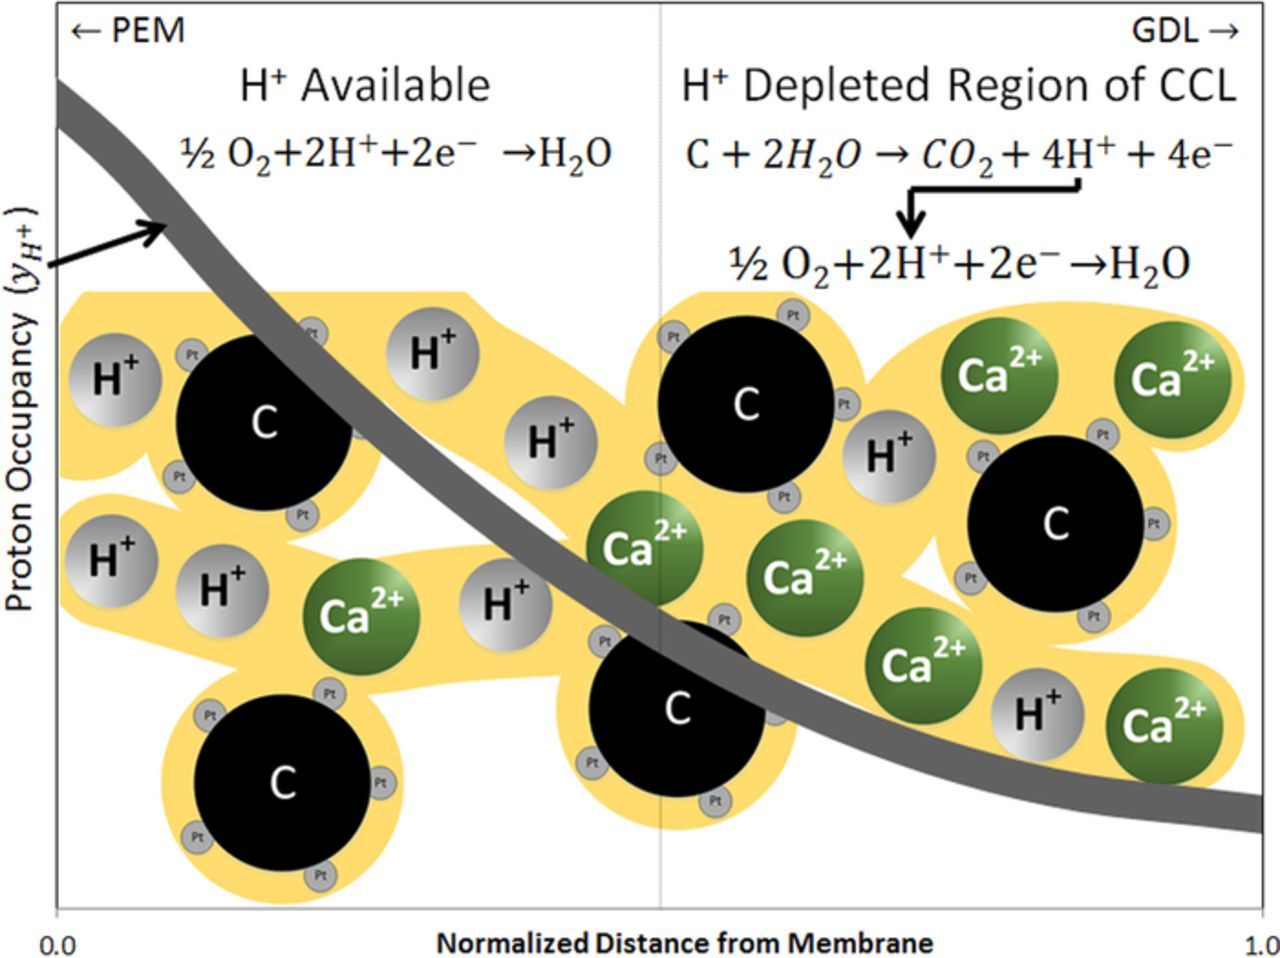
Figure 7. Hypothesized carbon corrosion process. In the area nearest the membrane, where protons are available, the ORR proceeds as normal. Farther from the membrane, where the proton depletion is the highest, protons necessary for continued oxygen reduction are generated through carbon oxidation.
The presence of platinum in PEFC catalyst layers does promote alternate carbon corrosion pathways42–44 that differ from those presented by Gallagher and Fuller.39 These pathways require lower potentials for carbon oxidation than are required for direct conversion of surface carbon oxides into carbon dioxide. This mechanism begins with the adsorption of hydroxyl radicals on the platinum surface (Reaction 14) can reduce the potential necessary for converting the carbon surface oxides into carbon dioxide (either through Reactions 15 and 16 or solely Reaction 17) to levels seen during normal operation.
![Equation ([14])](https://content.cld.iop.org/journals/1945-7111/165/6/F3015/revision1/d0014.gif)
![Equation ([15])](https://content.cld.iop.org/journals/1945-7111/165/6/F3015/revision1/d0015.gif)
![Equation ([16])](https://content.cld.iop.org/journals/1945-7111/165/6/F3015/revision1/d0016.gif)
![Equation ([17])](https://content.cld.iop.org/journals/1945-7111/165/6/F3015/revision1/d0017.gif)
The potentials required for these steps all are below the operating potentials for the two cells presented in this paper, which means that either Pt reaction pathway can promote carbon corrosion. Thus, it is proposed that foreign cation contamination can lead to carbon corrosion by depleting the cathode catalyst of protons, and initiating the carbon oxidation reaction as a means of supplementing protons in the catalyst layer to sustain oxygen reduction.
Accelerated Stress Testing
Accelerated stress tests for carbon corrosion, are run to complement our findings on the effect of foreign cations on the rate of carbon corrosion and to provide a more complete understanding of the carbon oxidation process. These tests are designed to promote carbon corrosion at elevated potentials above 1.0 V seen in conditions simulating start-stop testing. For accelerated stress testing, two additional fuel cells are built; one with an as-received CCM, and the other with the contaminated CCM. Conditioning of each cell was performed as described in the Cell Test section. Following this, the cells were both exposed to the U.S. DRIVE Fuel Cell Tech Team (FCTT) protocol for accelerated testing for measuring catalyst support durability.34 The cells were operated on H2/N2 at 80°C with flow rates of 100 sccm, 100% RH and no backpressure in the anode/cathode. Each cell was cycled between 1.0V and 1.5V for 5000 cycles at a scan rate of 0.5V/s. Polarization scans and CVs are recorded at the beginning of test, after 10, 100, 200, 500, 1000, 2000 cycles, and at the end of test. During testing, a portable carbon dioxide meter (CO2Meter Inc., Ormond Beach, FL) was connected in line with the cathode vent line to measure the carbon dioxide concentration exiting the cell in real time. The vent line was heated to 105°C to prevent condensation of water which CO2 would dissolve in, and consequently affect the CO2 emissions.
Significant ECSA loss was observed in both ASTs, with the as-received CCM's ECSA dropping from 45 m2/g down to 11 m2/g and the contaminated CCM's ECSA dropping from 21m2/g down to less than 1m2/g. Carbon dioxide emissions measured during the AST (recorded as ppmv) are presented in Figure 8. There is little difference in both the profiles of the carbon dioxide emissions and the integrated total carbon loss between the as-received and contaminated cells after completion of the 5000 triangular sweep cycles. The total carbon loss (as measured from the CO2 emissions), for the as-received membrane was calculated to be 37.7%, while 37.2% carbon loss was computed for the contaminated membrane.
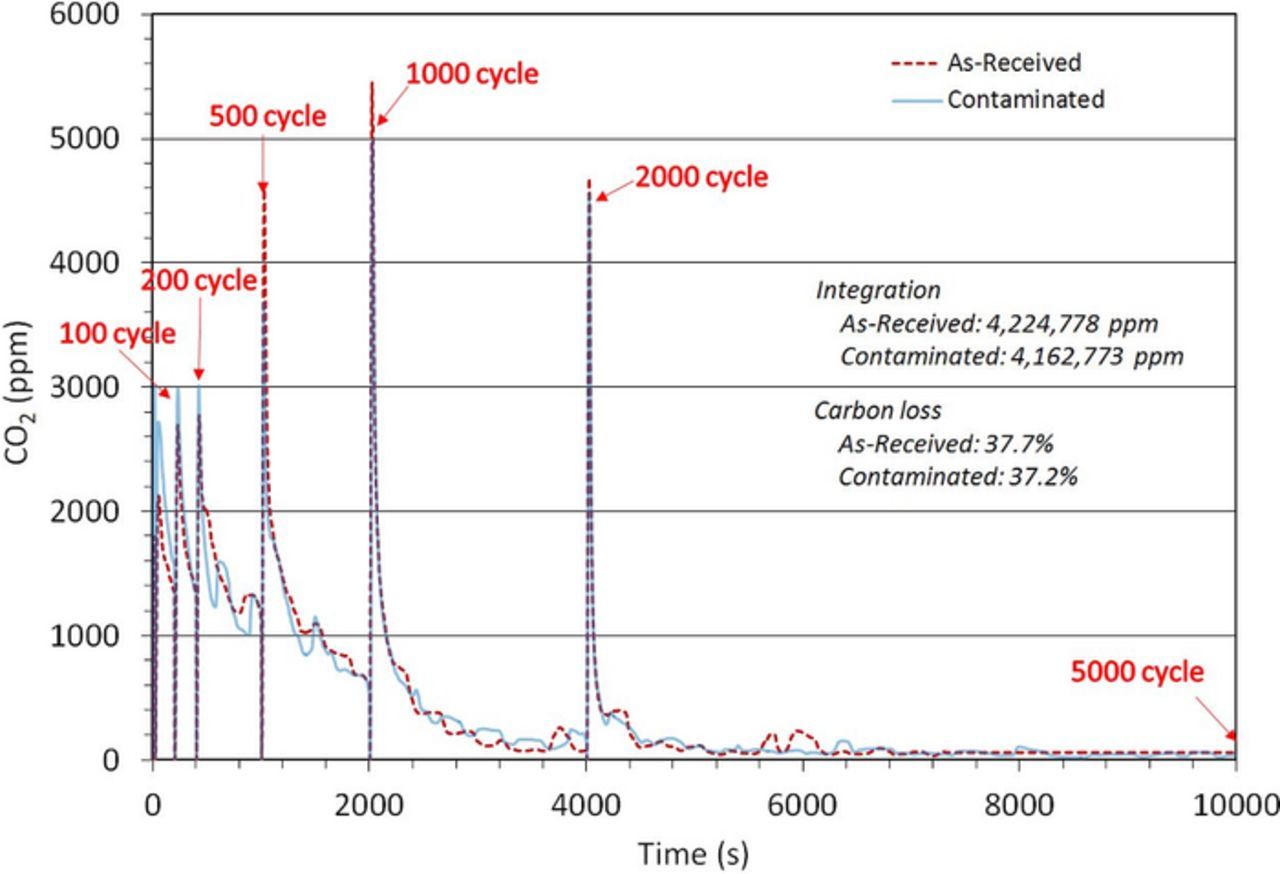
Figure 8. Carbon dioxide emissions during the AST of the as-received and contaminated CCMs.
The peaks appearing in the plot are representative of intermittent breaks in cycling, where polarization scans and cyclic voltammetry were measured. Upon each restart of the AST, an increased carbon corrosion rate is observed which decays with time. This is expected for carbon corrosion experiments, primarily due to exposure to oxygen during the polarization scans. The decrease is caused by multiple factors, including the mass loss of carbon, which reduces the amount of carbon surface sites that can be oxidized. The buildup of passive surface oxides further reduces the carbon sites available for oxidation. Additionally, the reduction of surface oxides (namely COH into CxO2 and CxO3) reduces the surface concentration of species present during the carbon oxidation process.39
The lack of difference in the carbon dioxide emissions is confirmed in the SEM imaging of the two CCMs performed after disassembly of the two cells. As shown in Figure 9, the cathode catalyst layer for both the as-received and contaminated cells become significantly thinner across the entire active area of the CCM. For the inlet and outlet regions presented, the cathode catalyst layer is thinnest, decreasing from an initial thickness of 11μm down to 4 μm after the AST.
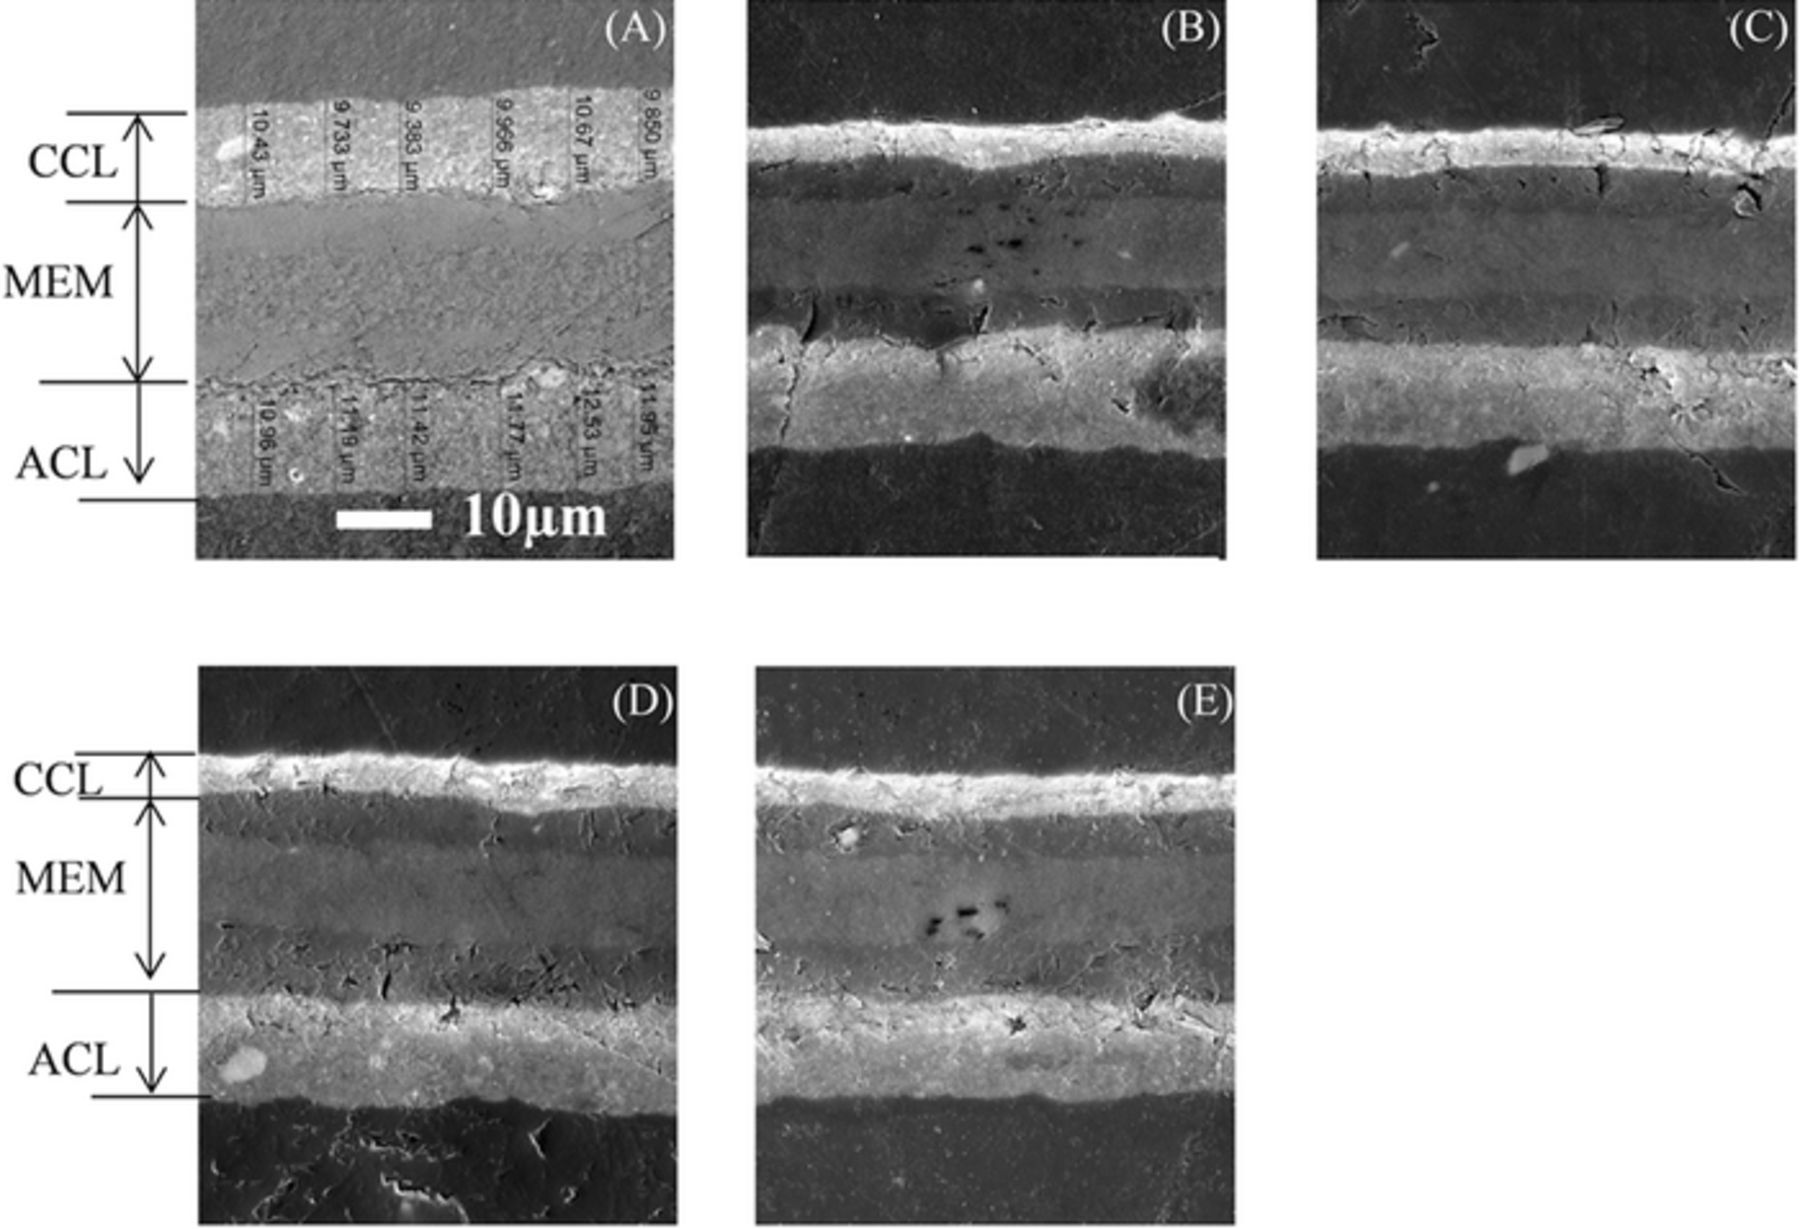
Figure 9. Catalyst coated membrane cross sections imaged by SEM of (a) as-received CCM, (b) baseline cell (inlet), (c) baseline cell (outlet), (d) contaminated cell (inlet), and (e) contaminated cell (outlet).
The results from the two different tests (the AST and the 400 hour potentiostatic/galvanostatic holds) appear to provide conflicting evidence for the role of foreign cations in carbon corrosion. However, these results first need to be evaluated for the conditions in which the cells were operated. While both CCMs were contaminated using the same method, test conditions were significantly different. For the long duration 400 hour hold, the cell is operating under an H2-air environment, in which the oxygen reduction reaction occurs. When foreign cations are present, this reduces the flux of protons across the catalyst layer, while the potential still promotes oxygen reduction across the entire surface of the catalyst layer. To generate the protons that are necessary to support to oxygen reduction, carbon is oxidized, generating carbon dioxide, protons and electrons which can react with oxygen, producing a current over the long duration of testing. Under the AST, where oxygen is not present, a different reaction occurs in the cathode, hydrogen evolution (2H+ + 2e− → H2) at very low rates (∼4mA/cm2). The much lower current densities observed during the AST, require a much lower proton flux, so that even in the case of foreign cation contamination causing a low proton occupancy in the cathode ionomer, there are sufficient protons in the cathode. Since there is very minimal electrolyte phase potential gradient in the AST, there is very little migration of the foreign cations toward the cathode, leaving a uniform Ca2+ distribution in the CCM that does not deplete protons in the cathode catalyst layer. Thus, the magnified effect from reduced proton flux and lack of protons seen in the presence of oxygen is not present in the AST, and thus the AST does not show the impact of foreign cations on carbon corrosion, resulting in the same amount of carbon corrosion in the as-received and contaminated CCMs.
Conclusions
We examined the role that foreign cation contamination plays in carbon corrosion. Two cells, one as-received baseline and one Ca2+ contaminated, were tested for 400 hours. Following testing and disassembly, the CCMs were examined with SEM and it was found that the contaminated CCM had significant, uniform catalyst layer thinning, while the baseline CCM had only localized thinning. Platinum mass loss was found not to have occurred; leading to the conclusion that carbon mass loss was the cause for the thinning. To understand how the foreign cations affected the performance of the cell, a numerical model was employed to examine the distribution of the cations during operation. It was found that cations preferentially accumulated in the cathode, leading to proton depletion in the cathode catalyst layer. In the absence of protons required for oxygen reduction, a carbon corrosion mechanism is proposed, whereby oxidation of the carbon support can generate protons in the cathode that can react with oxygen, leading to the thinning of the cathode catalyst layer during operation. While the present data supports the proposed carbon oxidation mechanism, further investigation to confirm the validity of the carbon corrosion mechanism hypothesis with continued experimental testing will improve upon the exact fundamental role of foreign cations on catalyst layer thinning, resulting in improved durability.
Acknowledgments
The authors are grateful for the financial support of the Department of Energy (DOE)-EERE, DE-EE0000467 (prime contractor: University of Hawaii, PI: Jean St-Pierre).
ORCID
Charles J. Banas 0000-0002-2270-5285